
Using regression trees to predict citrus load balancing accuracy and costs
- DOI
- 10.2991/ijcis.2018.25905183How to use a DOI?
- Keywords
- citrus production; regression trees; machine learning; feature selection
- Abstract
In order to define management and marketing strategies, farmers need adequate knowledge about future yield with the greatest possible accuracy and anticipation. In citrus orchards, greater variability and non-normality of yield distributions complicate the early estimation of fruit production. This study was conducted with the objective of developing a method to estimate citrus load based on orchard characteristics, morphological information of trees and number of fruits in defined locations of the crow. Field data from 16 citrus orchards obtained from 2005/06 through 2013/14 seasons were used. Machine learning techniques were applied to predict yield; these methods can reduce the estimation error as well as decrease the need for in-field measuring, thus reducing both the cost and time of the process.
- Copyright
- © 2018, the Authors. Published by Atlantis Press.
- Open Access
- This is an open access article under the CC BY-NC license (http://creativecommons.org/licences/by-nc/4.0/).
1. Introduction
Adequate yield forecasting allows farmers to define management and marketing strategies. To increase the information base for decision-making it is necessary to achieve the greatest possible accuracy and anticipation of fruit harvest forecasts. In citrus orchards, the great variability, derived from longevity of perennial crop conditions, makes it difficult to estimate fruit production early. The main problems associated with yield estimation are primarily due to the non-normality of yield distributions, an issue that has been highlighted in numerous studies. Yield-mapped datasets are expected to be normally distributed when derived from large numbers of sampling observations1; however, farm and regional-scale datasets have yielded both normal and non-normal results2,3,4.
Yield prediction as a feature of precision agriculture has concentrated on annual arable crops rather than perennial crops. The few studies conducted on perennial crops, such as apple 5,6,7, pear8 or citrus9 reported yield estimation at harvest (based on coloration), when the fruits are already fully colored. However, the challenge in growing perennial fruits is to estimate the number and diameter of citrus on the trees as soon as possible, because the amount of fruits that can fall from the tree each year is large and variable10. This may have been one of the reasons why approaches at the flowering stage have yielded poor results, in some cases of just 18% accuracy11. Models for estimating fruit-trees yield based on field measurements include the identification and estimation of production area (N trees×ha−1), load (N fruits×ha−1 or N fruits×tree−1) and fruit size or weight (g×fruit−1). Notice that the first component always implies certain knowledge of the trees in an orchard. For estimating the final size of fruits, growth curves have already been modeled12. Therefore, estimating fruit load is a challenge due to the high differences found between estimated and real load13,14.
In citrus orchards, production is primarily defined by the amount and size of fruits. Both characteristics are affected by endogenous factors (e.g. genetic characteristics of species or varieties, and physiological characteristics) and exogenous ones (e.g. environmental and crop conditions, especially irrigation and fertilization)15,16. Production is also determined by trees age17 and morphological characteristics of trees16. Linear regression equations were also analyzed in Royal Gala apple orchards 18 in order to estimate load from radiometric leaf area index, cross-sectional area of trunk, crown area and volume. De Rezende et al.19 estimated the number of fruits per tree in sweet orange based on quantification of the number of fruits of fixed size in terminal branches for different varieties and ages of trees; the authors obtained R2 values between 0.79 and 0.94.
In order to estimate load in Valencia late sweet orange, different methods based on counting total fruits or number of fruits into pre-defined sections of crown have been evaluated. The sampling quadrat count method consists of counting the number of fruits in sampling quadrat of known volume and then calculating the total number of fruit per tree so that the potential of trees can be estimated based on crown dimensions. Regarding the estimate of crown volume, there is no consensus in the equations that should be used for each species and variety concerned. The proposed formula20, which considers the shape of trees crown as a sphere, was used to estimate the volume of Valencia orange21 and Arrayana mandarin17. Morin et al.22 considered that the citrus tree crown is rounded; other authors used an elongated hemisphere23,24 for mandarin Nova and Clementina.
Avanza12 studied the number of fruits estimated by counting the total number of fruits and the number of fruits in sampling quadrat of known volume, testing different formulas for crown volume. Although high correlations were found between estimated and real load, estimation errors were important and R2 values were low (from 0.16 to 0.51 for the sampling quadrat method and 0.60 to 0.75 for total count); total fruit count was the selected method adjusted by a hidden fruit coefficient. Alvarez25 sampled trees in Valencia sweet orange orchards of between 7 and 10 years of age and studied the relationships between morphological characteristics of trees and load; the author found that trunk perimeter does not affect fruit load, and defined linear regression models to estimate fruit load based on plants height and crown diameter (with R2 between 0.16 and 0.90), concluding that precision increases with trees age.
The present work aimed at developing a method to estimate citrus load based on characteristics of orchards, morphological information of trees and number of fruits in defined sectors of the crown. To that end, we used artificial intelligence (specifically, machine learning) techniques to build a yield prediction system that can use all the information available with two aims: first, to intend to decrease the estimation error obtained with fruit-counting methods; second, to explore the possibility of reducing the need of in-field work and, consequently, the overall cost of the process.
These machine learning methods have already been successfully used in precision agriculture tasks. For instance, Yu et al.26 proposed a crop yield forecasting model based on the combination of artificial neural networks (ANNs) while, in 27, Zhou et al. applied the Grey-Markov forecasting model28 to yield prediction. Saruta et al.29 found that predictive models using support vector machines had the potential to describe the relationship between yield or protein content and multiple explanatory variables. Support vector machines were applied to build predictive models for yield and protein contents of brown rice. Quantitative accuracy of the models was approximately 1T×ha−1 in yield and 0.8% in protein. Görgens et al.30 evaluated the performance of three machine learning tools for predicting stand volume of fast-growing forest plantations. Rather than being limited to a subset of predictor variables, machine learning techniques explored the complete set of metrics, looking for patterns between them and the dependent variable.
Schulze et al.31 compared three different models for mass estimation of mango fruits, using simple linear regression, multiple linear regression and artificial neural networks; they found that the latter method was the most accurate and robust model for mass estimation. Predictive accuracy of machine learning and linear regression techniques for crop yield in 10 crop datasets was also compared 32; the results showed that M5-Prime model trees achieved the largest number of crop yield predictions with the lowest errors (and they are more interpretable than K-Nearest Neighbours, the other system with lowest error). In fact, M5-Prime has been successfully applied to determine the variables with the highest influence on citrus yield33. For these reasons, in this work we will use M5-Prime regression trees to build the yield prediction system.
The goal of this paper is to predict citrus load avoiding costly features. We apply machine learning techniques (specifically, the M5-Prime regression trees) to build yield prediction systems for sweet orange and tangor Murcott orchards, considering information that includes geographical and morphological data as well as volume and fruit number estimations.
The rest of the paper is organised as follows: Section 2 describes the data considered in this work for citrus load prediction. Section 3 details the method used to estimate citrus load. Section 4 shows the performance of the approach. Section 5 discusses the results while Section 6 draws some conclusions and presents ideas for future work.
2. Description of the data
The used field information was obtained from 16 citrus orchards located in Corrientes and Entre Ríos provinces, Argentina, between 27° 39′ 39″ and 31° 23′ 59″ S, and 57° 00′ 01″ and 58° 58′ 59″ W, during 2005/06 to 2013/14 seasons. The trees belonged to three different varieties, Murcott tangor (Citrus reticulata Blanco x C. sinensis L. Osbeck) and Valencia late and Salustiana sweet oranges (C. sinensis L. Osbeck), located in different rootstocks, soil types and irrigation conditions. In each orchard, different numbers of trees were selected, in accordance with orchard size and present variability. Table 1 describes the characteristics of orchards.
| Orchard | Sp | Var | Season | N | Soil | Irrig | Age |
|---|---|---|---|---|---|---|---|
| AYU | Tangor | Murcott | 2010/11 | 54 | Sandy | Yes | 15 years |
| CAC | Sweet orange | Valencia late | 2005/06 | 17 | Sandy | No | 17 years |
| DNT | Sweet orange | Valencia late | 2006/07-2009/10 | 89 | Sandy | No | 15 years |
| LCI | Sweet orange | Valencia late | 2006/07 | 46 | Sandy | No | 23 years |
| LLA | Sweet orange | Valencia late | 2007/08-2009/10 | 54 | Sandy | No | 23 years |
| LLU | Tangor | Murcott | 2007/08-2009/10 | 50 | Sandy | Yes | 11 years |
| LHE | Sweet orange | Valencia late | 2006/07-2009/10 | 33 | Sandy | Yes | 29 years |
| LPA | Tangor | Murcott | 2007/08-2009/10 | 35 | Sandy | No | 12 years |
| MEN | Sweet orange | Valencia late | 2005/06 | 25 | Sandy | No | 12 years |
| SJR | Tangor | Murcott | 2007/08-2009/10 | 79 | Sandy | No | 18 years |
| SJV | Tangor | Murcott | 2007/08-2009/10 | 73 | Sandy | Si | 30 years |
| S23 | Sweet orange | Valencia late | 2006/07-2009/10 | 80 | Clay | Yes | 26 years |
| S24 | Sweet orange | Valencia late | 2006/07-2009/10 | 84 | Clay | Yes | 16 years |
| STM | Sweet orange | Valencia late | 2006/07-2009/10 | 89 | Sandy | Yes | 9 years |
| VC1 | Sweet orange | Salustiana | 2013/14 | 76 | Sandy | No | 4 years |
| VC2 | Sweet orange | Salustiana | 2013/14 | 100 | Sandy | No | 4 years |
Basic characteristics and control variables of orchards
For each orchard, satellite global position was determined (latitude and longitude degrees, minutes and seconds; LatD, LatM, LatS, LongD, LongM, LongS). During the seasons indicated below, morphological variables of tree crown (height (h), diameter within (dm) and between rows (dM)) and total number of fruits at harvest (Har) were recorded in each tree. Crown radius (r) and average diameter (d) were also calculated. In two moments before harvest (60 and 30 days before the estimated harvest time, Est1 and Est2), total number of visible fruits were counted (T) and a sampling quadrat of known volume (V = 0.5 m x 0.5 m x 0.5 m = 0.125m3) was placed at 1.5 m above the ground on the four cardinal points of crown. Then, the number of fruits per frame was counted (NumE, NumW, NumN, NumS). The average number of fruits in frames per tree was also calculated (AveNum). Volume of tree crown was calculated using the formulas in Fig. 1 in order to estimate the number of fruits in the whole crown.
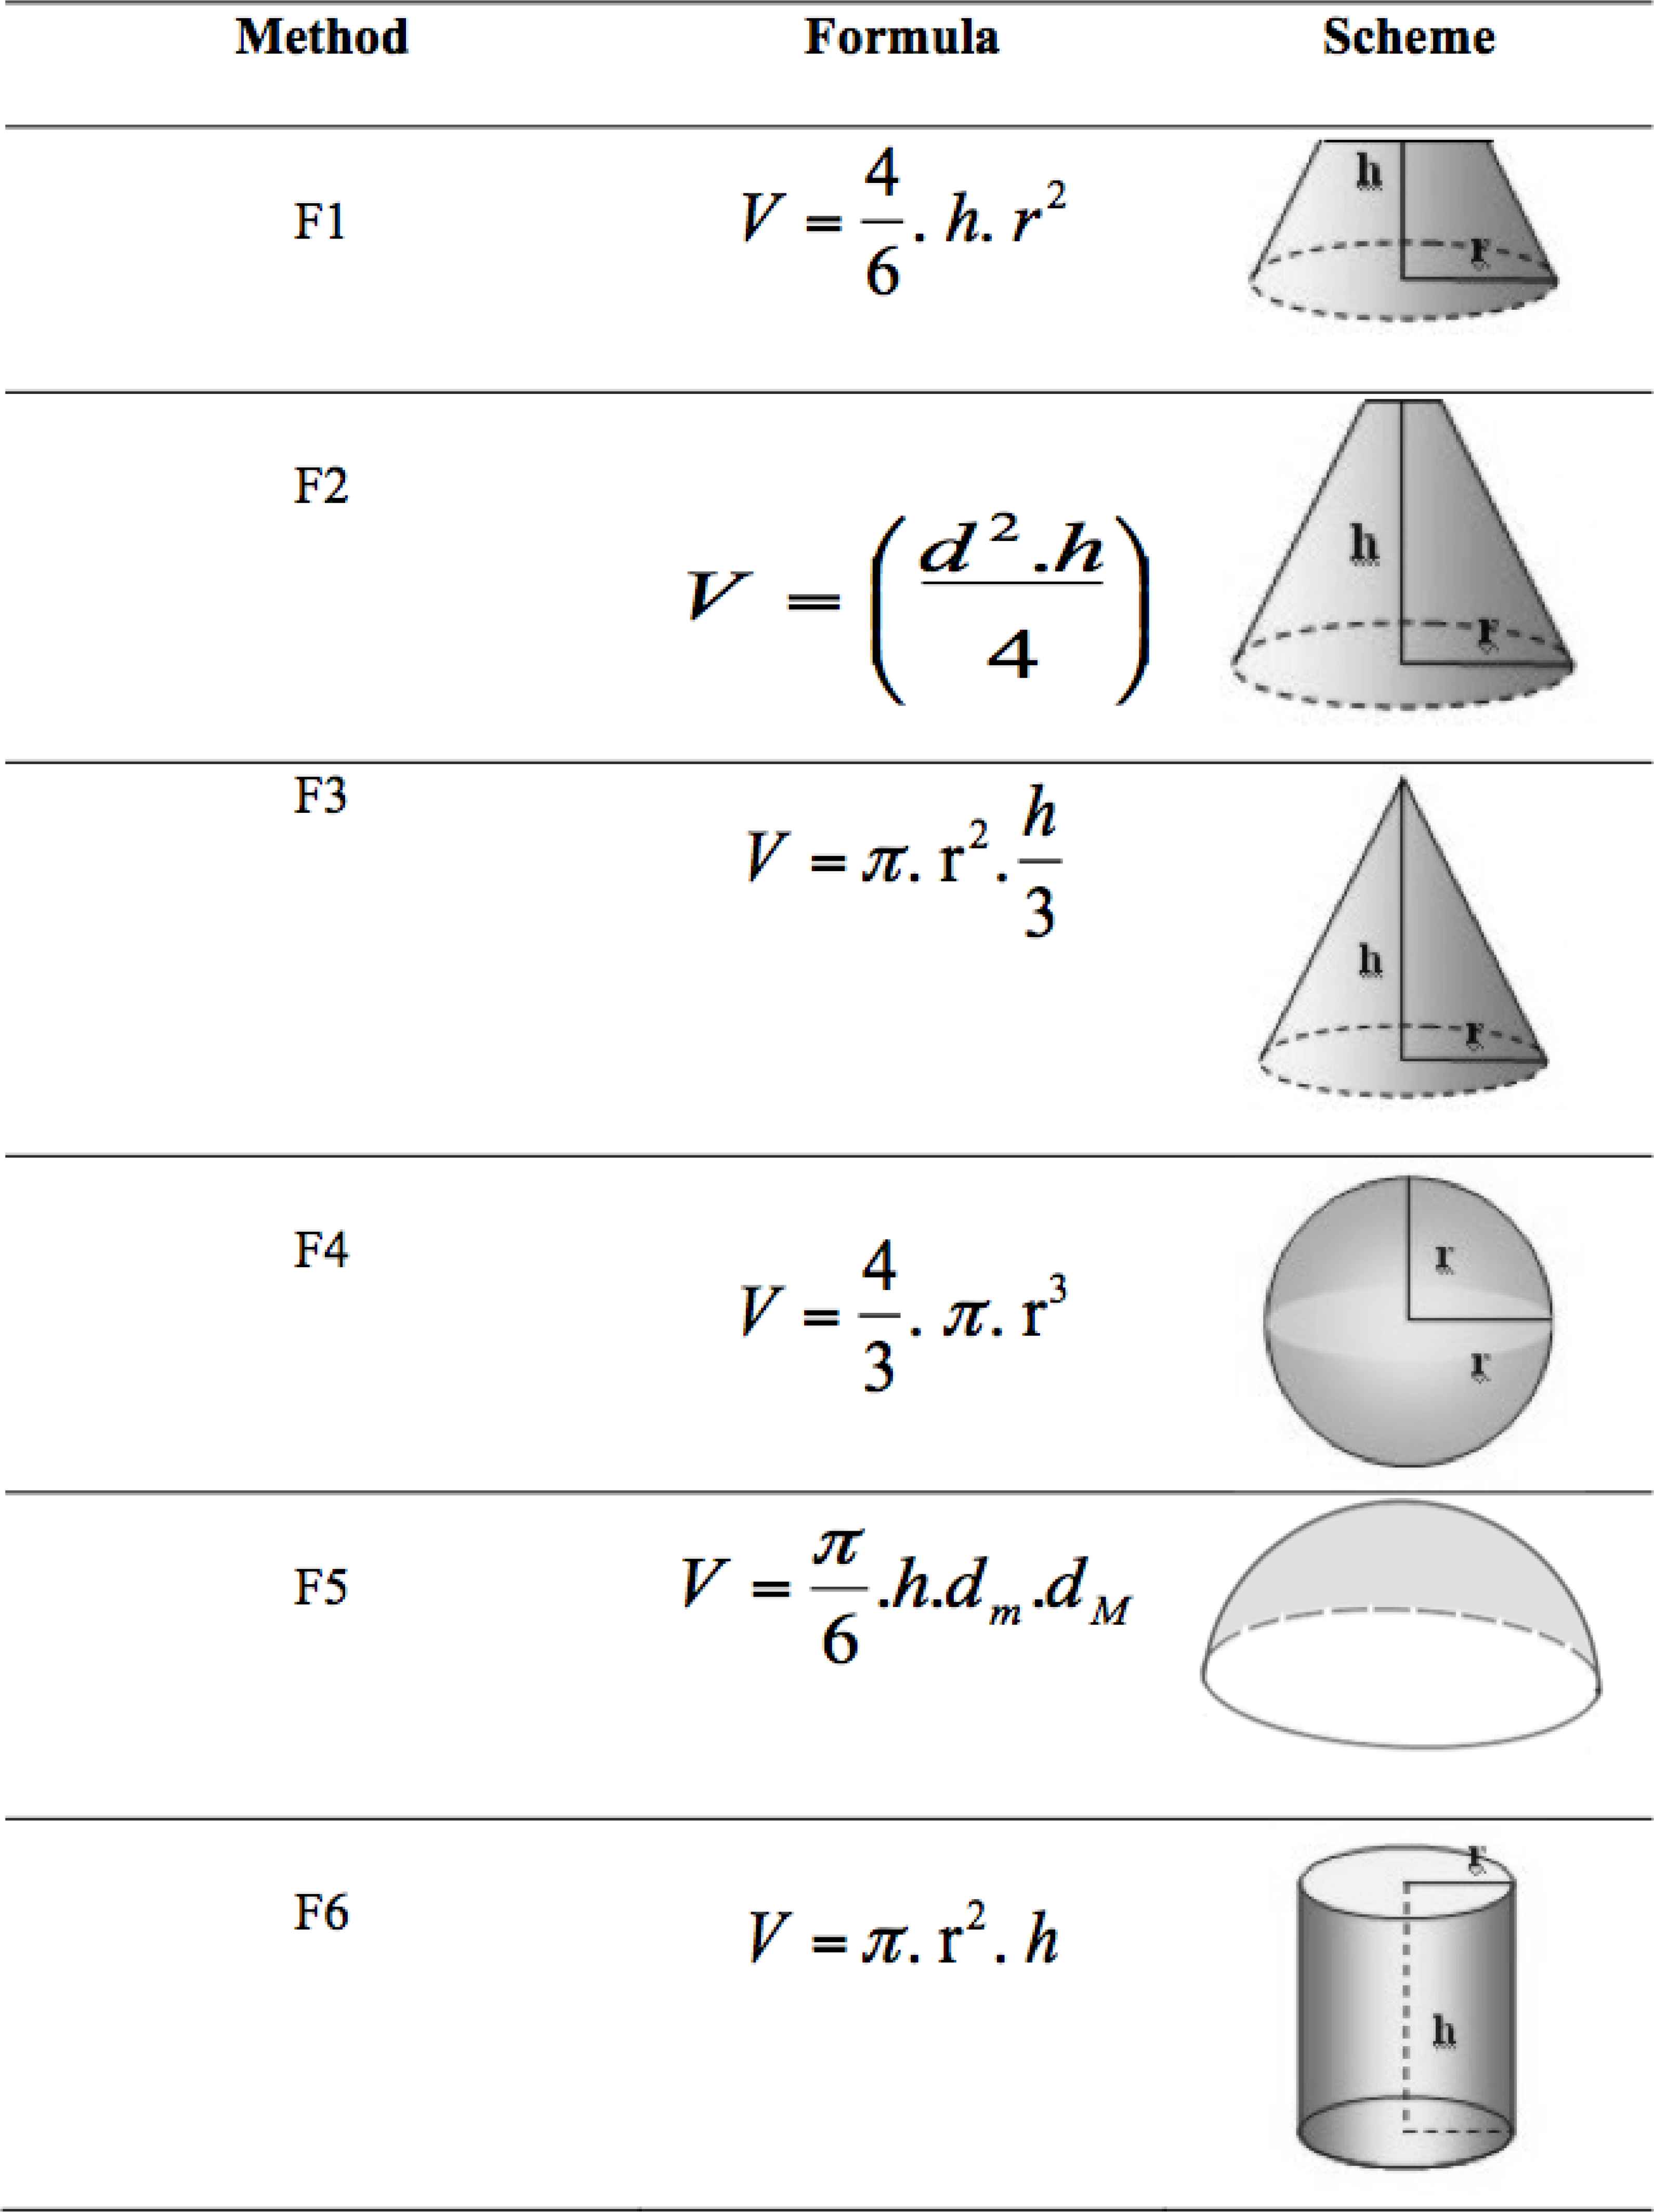
Estimation of trees crown volume
3. Data Analysis
Graphical and analytical descriptive statistical tools were used. Correlation coefficients (R) were calculated to define and characterize relationships between all variables and production per tree. These analyses were performed using InfoStat 201734.
Citrus production is predicted via regression trees, which have been demonstrated to be suitable methods for crop yield prediction. The most common algorithms used to build regression trees are CART (Classification and Regression Trees)35, M536 and M5-Prime37.
All of the algorithms used a similar strategy to construct the tree38. They use a divide and conquer strategy to build the model. The first node in the tree is called the root. A node with outgoing edges is called a test node and a node without outgoing edges is a leaf. Each path from the root of the tree to a leaf determines a region, i.e., a more homogeneous group subset of the input data. Therefore, the orchards are grouped according to the characteristics i.e. groups include orchards with a similar estimated production. Initially, the whole training set is associated with a leaf. By applying a recursive procedure, a test is used to decide if the set associated with a leaf is split into smaller subsets associated with new leaves.
The main differences among the described methods are the splitting criteria, the prune rules and the mechanism to estimate the leaf value. CART uses variance as splitting criterion, whereas M5 uses standard deviation reduction (SDR). In addition, the estimated value for a leaf is constant in CART, whereas M5 approximates the leaf values by linear regression models. In addition, it is able to improve predictions by introducing a smoothing procedure39. In addition, trees generated with M5 are smaller than those generated with CART. Thus, M5 outperforms CART in accuracy and simplicity. M5-Prime is an improvement over M5 that can deal with missing values and enumerated attributes37. According to the results previously obtained32, M5-prime is the more suitable modeling tool for yield crop prediction with regard to accuracy metrics. What is more, it is more interpretable than other ML techniques, such as K-Nearest Neighbours.
Thus, in this work we selected M5-Prime as the method selected in this work to predict citrus production. M5-Prime is a learner that constructs regression trees producing a classification based on piecewise linear functions as they partition the space into a set of regions and fit the predicted value within each region using a linear model. This method works as follows: Assuming a training set with examples each one defined by its value of a set of attributes (discrete or continuous) and a continuous target, the method constructs a model that relates the target values of the training examples to the values of the variables defining the example. M5-Prime selects the split that maximizes the expected error reduction. Once the tree is constructed, a multivariate linear model is built for the examples at each tree node via standard regression techniques using only attributes that are referenced by tests or linear models somewhere in the sub-tree at this node. The main characteristics of this method are:
- (i)
Regression tree construction:
- •
Splitting criterion: Maximize standard deviation reduction (SDR)
where T is the set of examples (in this case, orchards) that reaches the node and T1,T2, … the subsets resulting from the node split according to the chosen attribute. - •
Stopping criterion: Standard deviation below a given threshold (small enough)
- •
Pruning: Heuristic estimation of absolute error of linear regression models by means of
where n is the number of examples that reach the node and v the number of parameters that represents the class value at that node. Pruning greedily removes terms from linear regression models to minimize the estimated error. - •
Smoothing is used to compensate discontinuities between adjacent linear models at the leaves of the pruned tree. The smoothing process uses first the leaf model to compute the predicted value and then filters that value along the path back to the root, combining it with the value predicted by the linear model for that node. The modified prediction p is computed by
where n is the number of examples at the smoothed node, k is a constant, and p and q are respectively the predictions passed to the studied node from below and the value predicted by the model at the studied node, respectively. Basically, what this process does is to achieve the effect of incorporating ancestor models into the leaves.
- •
- (ii)
The value at each leaf is estimated using a linear regression function.
- (iii)
For each node, only a subset of attributes that appear in the subtree is used.
The experiments are conducted using the RWeka Package40, using the M5-Prime function with the standard configuration, i.e, with pruning, smoothing and with a minimum number of 4 examples per node. The accuracy of this method is studied in terms of root mean square error (RMSE), correlation coefficient (R) and the relative mean absolute error (MAE).
In order to evaluate accuracy of each estimating method, absolute value percent errors between estimated and real loads were calculated as follows
4. Results
In this section some experiments are conducted in order to obtain the combination of feature set and regression tree predicting citrus load as accurate as possible. First of all we study the behavior of previously defined counting methods (those described in Section 2). Then, the proposed approach based on regression trees and feature selection is applied to perform such prediction.
4.1. Prediction of citrus load using counting methods
Table 2 shows correlation coefficients (and associated p-values) between load estimated by different counting methods and real harvest for orange and tangor orchards. R coefficients indicate that load is significantly and positively associated with production estimated by all methods. However, it is strongly correlated only for total number of visible fruits count (T).
| Sweet orange | Tangor Murcott | |||
|---|---|---|---|---|
| Variables | R | p-value | R | p-value |
| F1 | 0.33 | < 10−4 | 0.25 | < 10−4 |
| F2 | 0.51 | < 10−4 | 0.41 | < 10−4 |
| F3 | 0.61 | < 10−4 | 0.36 | < 10−4 |
| F4 | 0.07 | < 10−3 | 0.17 | < 10−4 |
| F5 | 0.10 | < 10−4 | 0.17 | < 10−4 |
| F6 | 0.19 | < 10−4 | 0.19 | < 10−4 |
| T | 0.92 | < 10−4 | 0.87 | < 10−4 |
Pearson correlation coefficients (R) between different variables and harvest, and associated p-values.
Table 3 shows the behavior of the real harvest estimators. The first and fourth columns show the error (in percentage) associated with each estimator for predicting orange and tangor harvest, respectively. The second and fifth columns show the average harvest estimated with each method for orange and tangor, respectively. The third and sixth columns represent the associated standard deviation for orange and tangor, respectively. Each estimation {F1,…F6} is obtained by applying the formulas in Fig. 1 using AveNum as number of fruits.
| Sweet orange | Tangor Murcott | |||||
|---|---|---|---|---|---|---|
| Method | Error | Mean | SD | Error | Mean | SD |
| F1 | 94.82% | 32.66 | 42.31 | 89.97% | 50.25 | 107.14 |
| F2 | 82.85% | 102.37 | 125.08 | 81.29% | 110.21 | 164.74 |
| F3 | 84.99% | 86.64 | 83.77 | 82.71% | 102.53 | 168.77 |
| F4 | 94.48% | 78.24 | 202.41 | 92.96% | 117.34 | 340.54 |
| F5 | 92.92% | 65.15 | 126.81 | 93.14% | 115.97 | 340.56 |
| F6 | 87.33% | 118.09 | 191.89 | 99.94% | 190.85 | 508.54 |
| T | 41.69% | 329.99 | 225.74 | 43.94% | 373.66 | 260.17 |
| Real Harvest | 505.55 | 386.31 | 566.19 | 471.26 | ||
Error percentage (between real and estimate harvest by different methods (F1, F2, F3, F4, F5, F6, T) for the different varieties of sweet orange and tangor studied), average estimated harvest and its standard deviation
Note that all the current harvest estimations are far from the real harvest numbers. The closest estimation is the one associated with the total number of visible fruits counted (T). Thus, the studied sampling quadrat methods were not able to estimate real load and the most accurate method, T, presented high variability. In addition, it is a quite costly activity.
4.2. Intelligent-based prediction of citrus load
Let us analyse the performance of the proposed artificial intelligence method in harvest prediction. As it was previously mentioned, the goal is to predict harvest using the least information from orchards possible and, at the same time, to reduce the error, if possible.
Because of the high cost of obtaining in-field data, different combinations of input variables were tested in order to find an estimation method balancing the trade-off between an adequate accuracy and the cost associated with data collection.
Thus, we used the following variable combinations:
- •
Basic variables. First of all, harvest is predicted using the following information: LatD, LongD, Soil type, Irrigation, Age, and Diameter d. Only d, which is the averaged diameter of tree crowns, is taken in the field.
- •
Volume based variables. Basic variables plus different crown volume estimations (F1, F2, F3, F4, F5, F6).
- •
Sampling quadrat based variables. Basic variables plus NumN, NumS, NumE, NuwW variables. Note that this is a more costly approach, because obtaining sampling quadrat variables is costly in terms of work hours.
- •
VOLi + Numj. We also consider a selective feature selection with the aim of feeding the machine learning algorithm with some valuable information but avoiding the cost of using all the infield data. Thus, the algorithm is trained by considering Basic variables plus each combination of Volume and Sampling quadrat variables, with i ∈ {F1,F2,F3,F4,F5,F6} and j ∈ {N,S,E,W}
- •
All= Basic + Volume + Sampling quadrat variables. In this case, all the available information is considered to predict harvest.
Fig. 2 shows the error obtained when harvest is predicted via M5-Prime using each one of the previously introduced variable sets. The lines represent the error obtained when the prediction is estimated by the total count of visible fruits (T), or with regression tress using Basic, Volume, Sampling quadrat or all the variables as input. Note that the estimation from the total number of visible fruits count is the worst of them all. On the other hand, each bar represents the prediction when Basic variables and just one combination of Volume and Sampling quadrat is considered. As it can be seen, the errors obtained for sweet orange when only a combination of Volume and Sampling quadrat is considered were similar to those obtained when considering Basic, Volume or all the Sampling quadrat. However, these approaches are much more expensive. On the other hand, information provided by Sampling quadrat in the North combined with VolM2 estimation yielded the lowest errors.
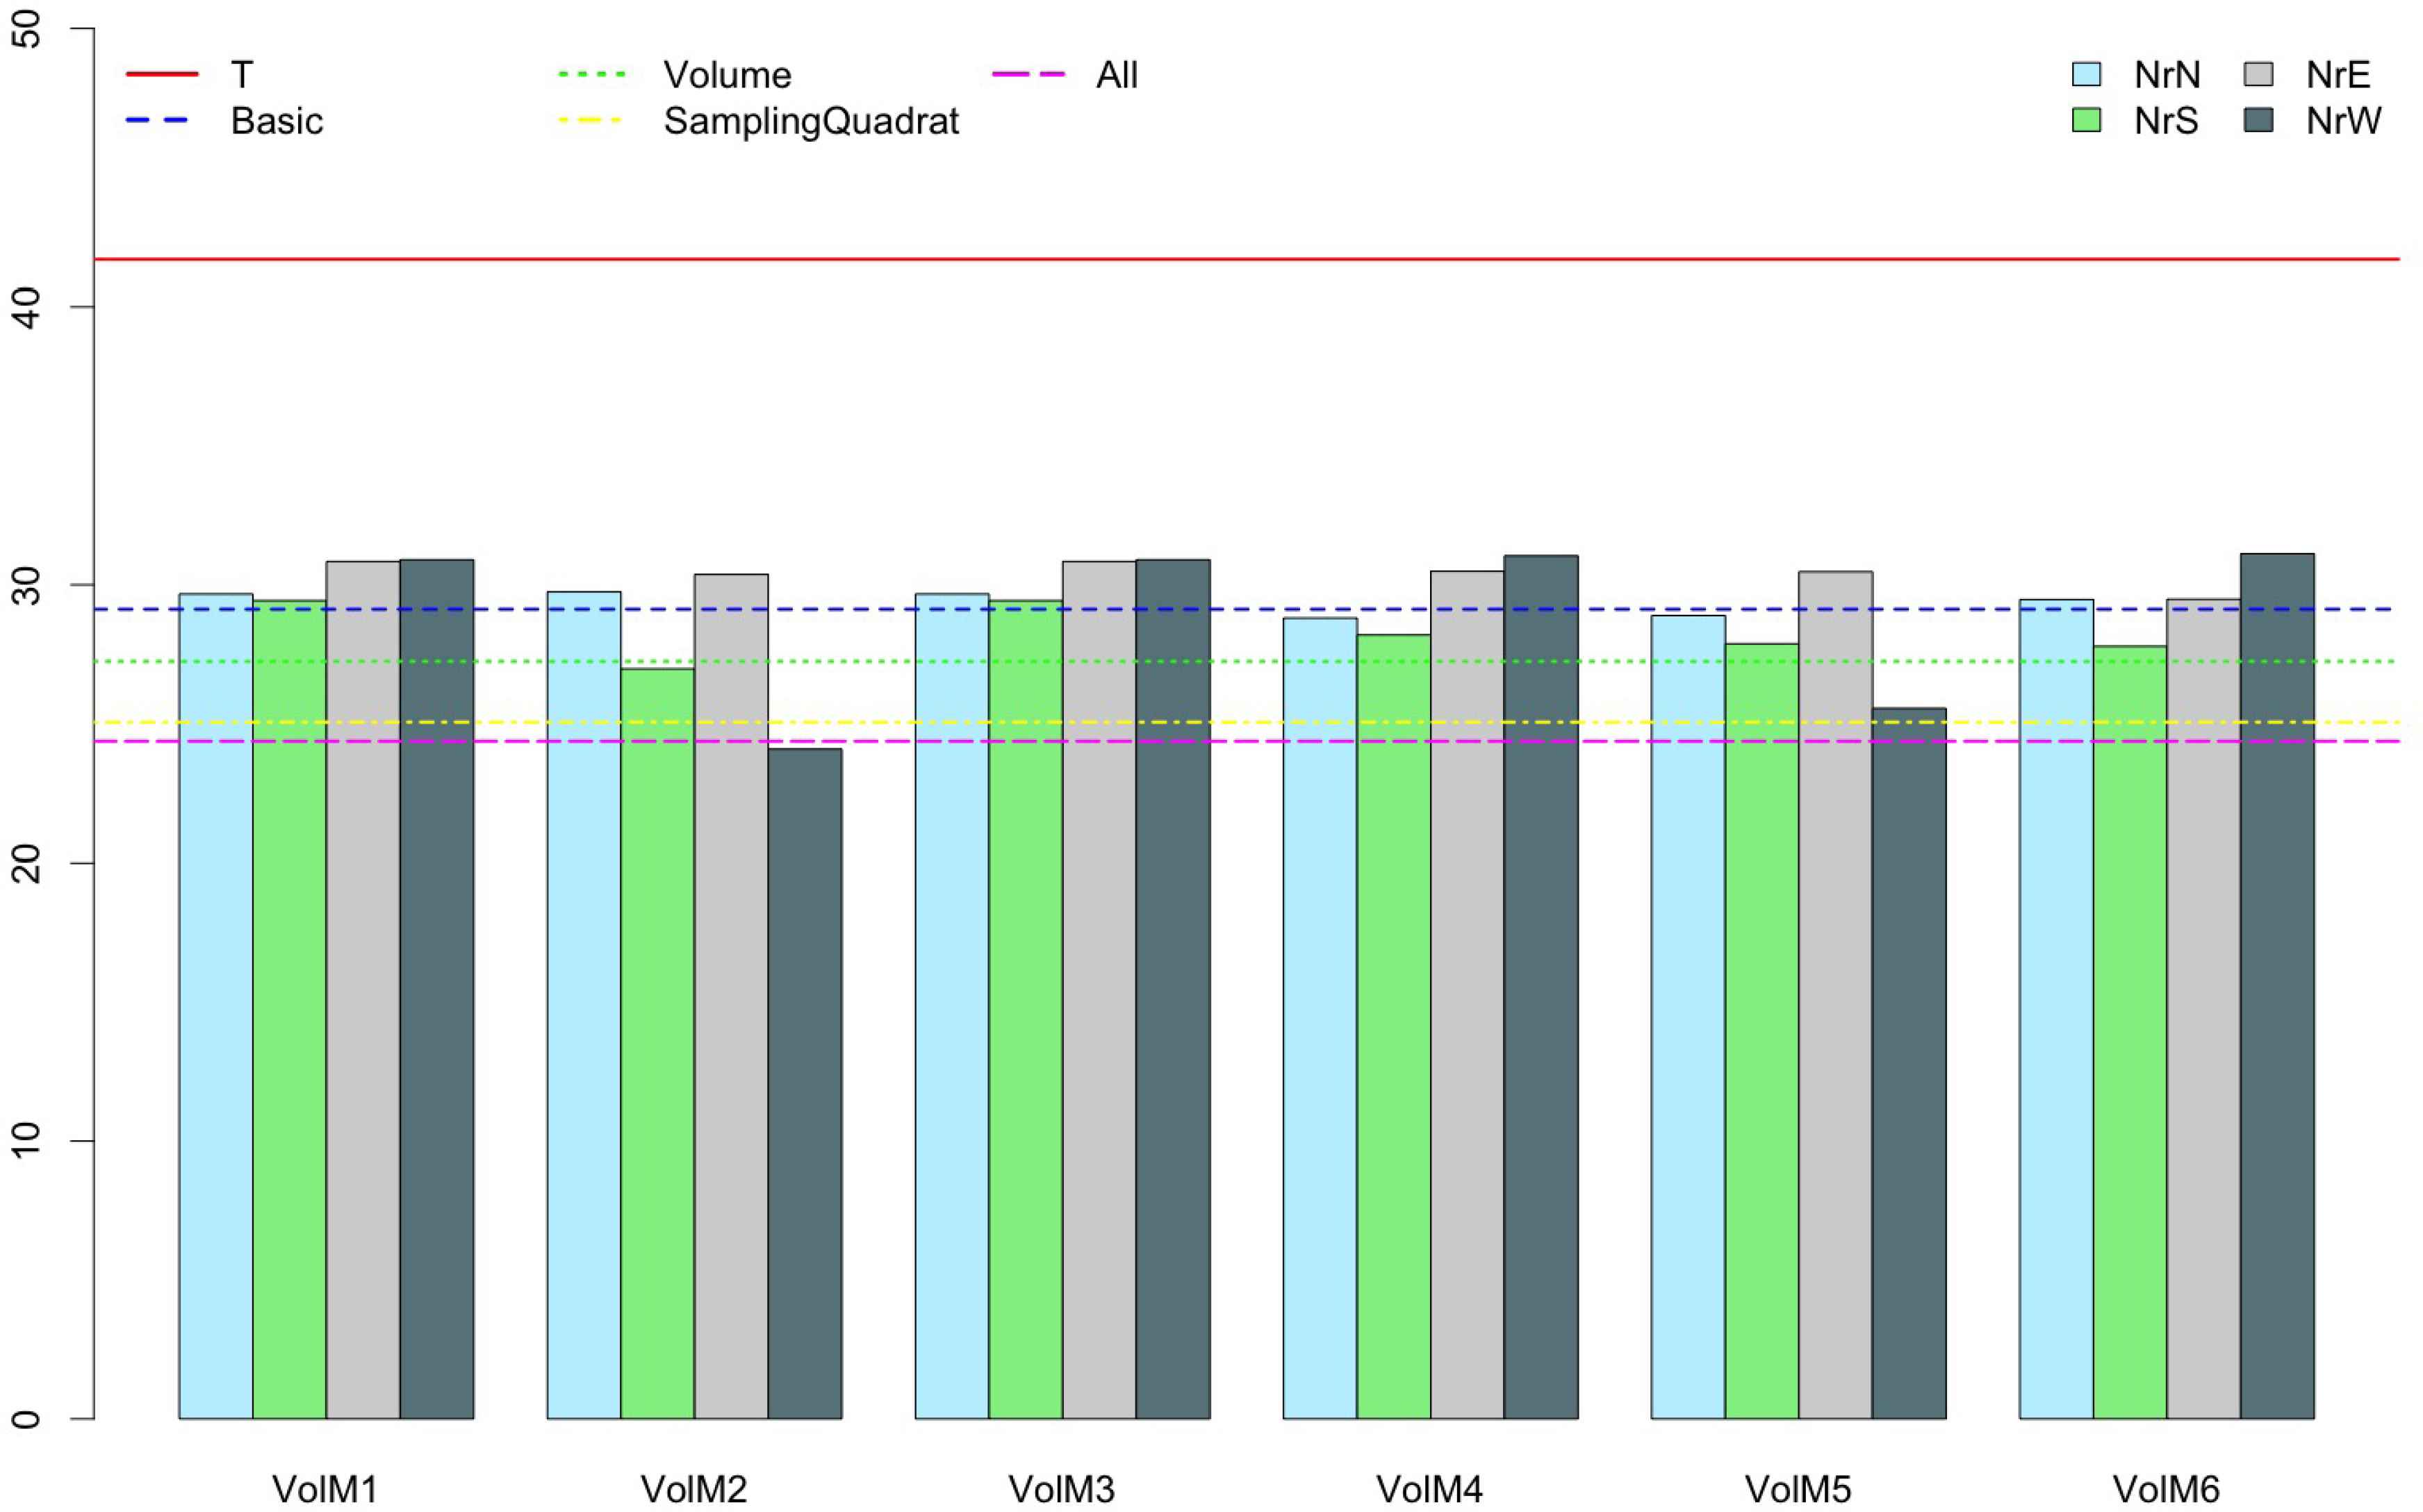
Errors obtained using the different variable sets for sweet orange.
The errors for tangor (Fig. 3) behaved a little differently, since some errors were greater than those obtained by T. This result may be attributed to the fact that the features provided low quality information. In fact, when only Basic or Volume variables were considered as input of the learning procedure, again the performance was worse than that obtained by T. In addition, there were a lot of combinations of sampling quadrat positions and volume estimations with low errors, although the combination of sampling quadrat at west (NrW) and volume 6 (VolM6) estimations is the one that performed best.
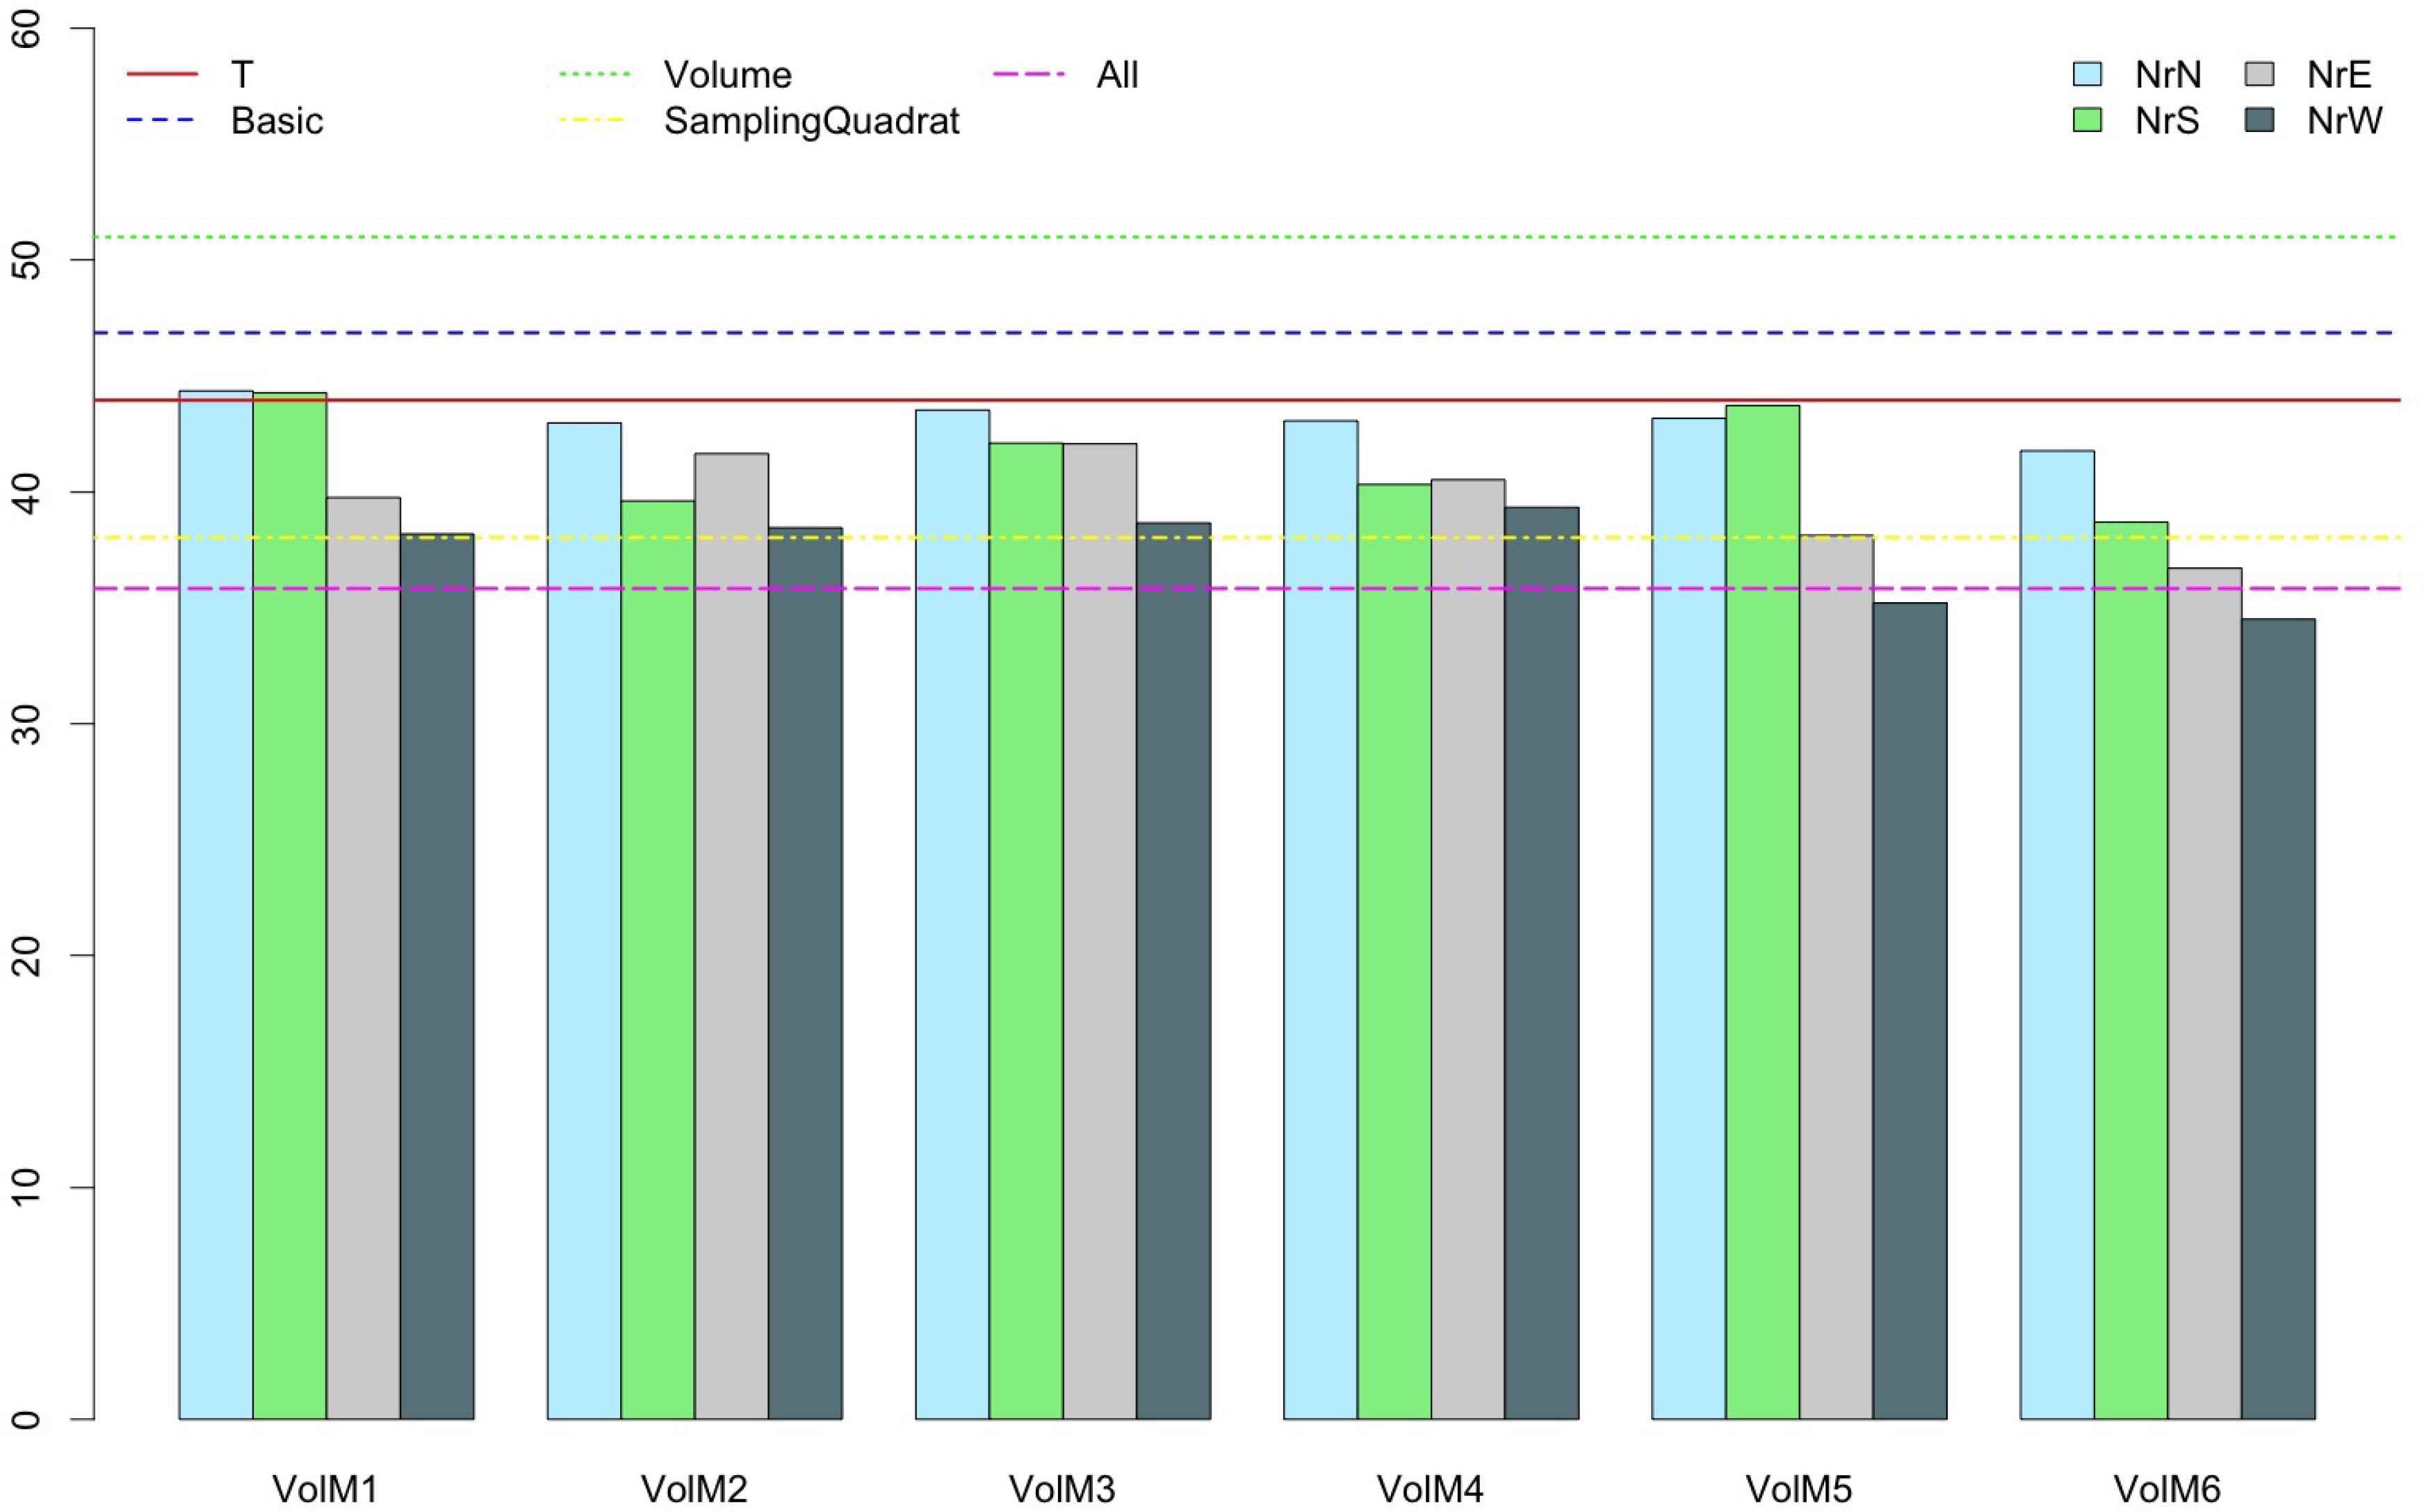
Errors obtained using the different variable sets for tangor Murcott.
Tables 4 and 5 show the results obtained with M5-Prime for the best combinations of variables. The first column of both tables represents the error computed according to formula 1, i.e., computed tree by tree. The second column shows the total error, i.e., the difference between the real production and the predicted one considering all the trees and all the orchards. Note that these errors are different because the errors associated with each tree are overall compensated. The third column contains the correlation coefficient associated with each combination of variables. The fourth and fifth columns indicate the complexity of the model, i.e., the number of tree leaves and the number of variables used for constructing regression equations at leaves.
| Method | Error (computed by tree) | Total Error | Correlation coefficient | Number of Leaves | Number of Variables |
|---|---|---|---|---|---|
| Basic | 29.9% | 0.005% | 0.83 | 10 | 8 |
| Volume | 27.8% | 0.003% | 0.84 | 14 | 11 |
| Sampling quadrat | 27.8% | 0.020% | 0.84 | 1 | 11 |
| All | 24.7% | 0.006% | 0.91 | 10 | 17 |
| VolM2-NrW | 24.3% | 0.007% | 0.86 | 25 | 11 |
Characteristics of each method for sweet orange harvest prediction.
| Method | Error (computed by tree) | Total Error | Correlation coefficient | Number of Leaves | Number of Variables |
|---|---|---|---|---|---|
| Basic | 58.7% | 0.071% | 0.64 | 7 | 4 |
| Volume | 45.4% | 0.061% | 0.73 | 12 | 10 |
| Sampling quadrat | 39.8% | 0.096% | 0.81 | 5 | 10 |
| All | 39.2% | 0.060% | 0.78 | 1 | 12 |
| VolM6-NrW | 34.5% | 0.006% | 0.84 | 7 | 10 |
Characteristics of each method for tangorMurcott harvest prediction.
Notice that, when analyzing the errors obtained, it is necessary to consider that the information needed to calculate volume is determined only once a year; if sampling quadrat values are needed, the required in-field work increases and so does the cost, and it is important to evaluate the benefits of obtaining higher accuracy at the expense of increased costs.
5. Discussion
The correlation between the different classical methods for estimating the number of fruits and the actual load was significant, as indicated by the p-values; however, in most cases the R values showed a weak association. Only in the case of the total count (T) was this correlation strong. In sweet orange, R2 for sampling quadrat estimations varied from 0.005 to 0.37 and its value was 0.85 for total count estimation; in tangor Murcott, R2 for sampling quadrat estimations varied from 0.03 to 0.17 and for total count it was 0.76.
These results for sampling quadrat estimation of sweet orange and tangor Murcott are lower than values found in sweet orange 12,19,25. Total count correlation coefficients were similar to previously found values 12. When differences between estimated and real load or absolute value percent errors are considered, the sampling quadrat method combined with the different crown volume formulas showed lower accuracy than total count, with errors between 82.82% and 94.48% versus 41.69% of total count in sweet orange, and between 81.29% and 99.94% against 43.94 in tangor Murcott.
When harvest was predicted using M5-Prime, errors decreased to values between 24.3% and 29.9% for sweet orange, which are lower than values found for total count. For tangor Murcott, errors varied between 34.5% and 58.7%. In this case, not all the combinations obtained an error lower than that of the total count (T).
As it can be seen in figures 2 and 3, sweet orange and tangor Murcott harvest predictions were slightly different. In the case of sweet orange, when all orchards were considered (see table 4), any prediction was more accurate than the best previous prediction (T). In addition, when only Basic variables were considered for harvest prediction, the error decreased from 41.7% to 29.9%. That means that just with the introduction of some basic information related to each tree, such as tree Age, the estimation improved. In addition, prediction accuracy increased with increasing amount of added information, reaching the lowest error (21.3%) when Basic, Volume and Sampling quadrat variables were considered. However, this is the most costly option. Thus, the different options VOLi + Numj were studied. As shown in Fig. 2, the best combination in terms of accuracy was that of Basic variables plus VolM2 and NrW. We must remark, however, that when errors were considered for each orchard, in VC1 and VC2 orchards, errors of estimation based on Basic and Volume variable sets were higher than the others, including human estimator (T). This might be explained by the condition of trees in these orchards, which some time before harvest had suffered a hard frost that caused a strong fruit drop. This suggests that under normal conditions, the method has good accuracy for estimating load; under exceptional conditions and with considerable variation of the number of fruits, the method is sensitive to these changes and has to be used carefully. Sampling quadrat measurements and human estimation were performed after fruit fall, which justifies their better behaviour.
The behavior of tangor Murcott harvest prediction was similar to that obtained when harvest for sweet orange was predicted, meaning that when more information was added to the method, the error decreased. However, when only Basic or Volume variables were considered, the error was higher than the obtained by the human estimator (T). In addition, it is possible to obtain the lowest errors when NrW sampling quadrat and VolM6 are combined.
6. Conclusions and Future Work
In this work, we have applied machine learning techniques (specifically, the M5-Prime regression trees) to build yield prediction systems for sweet orange and tangor Murcott orchards. We have considered information that includes geographical and morphological data as well as volume and fruit number estimations.
Compared to traditional prediction systems, artificial intelligence methods allowed us to decrease the estimation error in all cases for sweet orange orchards and in most cases for tangor Murcott orchards. Moreover, with an adequate choice of the variables fed to the system it is possible to reduce the amount of in-field work needed to obtain an accurate prediction, thus reducing the overall cost and time of the process.
In future studies, we will test the possibility of including meteorological information as well as satellite imagery data. We will further explore the construction of more accurate prediction systems, for instance with the use of feature selection and extraction methods.
Acknowledgements
This work was supported by Excellence project TIN2017-87600-P from the Ministry of Economy, industry and competitiveness of Spain
References
Cite this article
TY  - JOUR
AU  - G. R. R. Bóbeda
AU  - E. F. Combarro
AU  - S. Mazza
AU  - L. I. Giménez
AU  - I. Díaz
PY  - 2018
DA  - 2018/11/01
TI  - Using regression trees to predict citrus load balancing accuracy and costs
JO  - International Journal of Computational Intelligence Systems
SP  - 79
EP  - 89
VL  - 12
IS  - 1
SN  - 1875-6883
UR  - https://doi.org/10.2991/ijcis.2018.25905183
DO  - 10.2991/ijcis.2018.25905183
ID  - Bóbeda2018
ER  -