
Environmental Effects of the African Continental Free Trade Agreement: A Computable General Equilibrium Model Approach
 , Hanna C. Norberg5
- DOI
- 10.2991/jat.k.210719.001How to use a DOI?
- Keywords
- Trade; environment; AfCFTA; air pollution; CO2; non-CO2; greenhouse gas
- Abstract
Growth and development in middle- and low-income countries often come at an environmental cost, but is that trade-off always necessary? This study uses a computable general equilibrium model to estimate the macroeconomic and environmental impact of the world’s most significant plurilateral trade agreement, the African Continental Free Trade Agreement (AfCFTA). We build a novel dataset using the Global Trade Analysis Project data, which allows us to estimate the effect on emissions of carbon dioxide (CO2), non-CO2, and other pollutants. In terms of macroeconomic impact, African nations benefit from gross domestic product growth by 1.2% and employment by 2.1%, with less developed economies, such as Togo and Benin, obtaining the largest macroeconomic gains from trade liberalization. On aggregate, we estimate that the agreement will lead to a marginal, 0.3% increase in CO2 emissions, a 19.6% increase in non-CO2 greenhouse gas emissions, and a 21.5% decline in air pollutants. We find considerable heterogeneity across countries. For Nigeria, the rest of Central Africa, and South-Central Africa, the AfCFTA is expected to reduce emissions, while in Ethiopia, Cameroon, and Burkina Faso, estimations show an increase. Transit countries connected to large ports, such as Togo and Benin, are most negatively impacted. We conclude that while the AfCFTA implementation is expected to lead to notable improvements in air quality by reducing air pollutants, the resulting increase in climate-related emissions may require member countries to make concerted efforts to deal with the adverse effects.
- Copyright
- © 2021 African Export-Import Bank. Publishing services by Atlantis Press International B.V.
- Open Access
- This is an open access article distributed under the CC BY-NC 4.0 license (http://creativecommons.org/licenses/by-nc/4.0/).
1. INTRODUCTION
Africa is currently on the road to operationalizing its continental free trade area. The African Continental Free Trade Agreement (AfCFTA), which entered into force in May 2019, is the world’s largest free trade area regarding the number of participating countries since the formation of the World Trade Organization.1 The AfCFTA brings together 1.3 billion people with a combined Gross Domestic Product (GDP) valued at 2.5 trillion US dollars. The successful implementation of the AfCFTA is a concern for the African Union and the rest of the world, given the current political environment, which is gripped by trade tensions.2
The agreement is set up to remove tariffs for 97% of all tariff lines and not less than 90% of all trade, aiming to allow free access for commodities, goods, and services across the continent.3 The main objectives of the agreement are to create a single market, deepen the economic integration of the continent, achieve market liberalization, allow the movement of capital and people, and foster investment. In sum, the implementation of the agreement aims to achieve sustainable and inclusive socio-economic development.
Environmental protection is currently one of the main objectives for trade policymakers to ensure the sustainability of countries’ economic growth. The connection between trade and the environment has been widely recognized in the international community and is now also earning a seat at the table in trade negotiations. Since trade is known to facilitate the industrial transition, policymakers are finding it increasingly necessary to study whether trade can also be used as a tool to tackle environmental concerns. The improvement of the environmental quality in the context of Africa should be a top priority in setting the rules for trade. While Africa’s carbon emissions are among the lowest in the world, African Greenhouse Gas (GHG) emissions, mainly stemming from agricultural activities, are among the fastest-growing emissions globally (Tongwane and Moeletsi, 2018). Additionally, a high concentration of air pollutants is directly linked to negative health outcomes, increase in poverty rates and delay development. Due to less advanced technologies and excessive reliance on coal and biomass, less developed economies are more prone to have higher air pollutants than GHG emissions.
Despite the environmental impact being one of the most relevant socio-economic issues worldwide, little focus has been put on the potential environmental effects of the implementation of AfCFTA. This paper aims to bridge this gap. In particular, we set out to answer the question: can AfCFTA help reduce pollution? The purpose of the study is to estimate the impact of trade liberalization on the African continent, focusing on carbon dioxide (CO2), non-CO2 emissions (GHGs), and other air pollutants. We argue that this question is crucial since the main objective of a free trade area is to boost trade and prevent trade from having a negative effect on the environmental quality of both the signatory countries and their trading partners.
We construct a novel dataset for the 55 countries involved in the AfCFTA agreement to answer this question. We use a Computable General Equilibrium (CGE) model to measure the impact of the free trade area on the environment. In the study, we use the Global Trade Analysis Project (GTAP) database version 10. A (which includes data for four benchmark years 2004, 2007, 2011, and 2014) and the standard GTAP model (Hertel, 1997). Using these data allows us to split the composite African regions into individual countries that are members of AfCFTA to gain access to macroeconomic, trade, and sectoral data from these countries. Furthermore, we collect and merge the CO2 and non-CO2 emissions (GHG) databases originating from different sources into the GTAP database. The CGE model allows us to capture linkages between all sectors and agents of the economy and compute trade flows across AfCFTA members and the rest of the world.
The closure of our model is set to allow for the national level of labor employment to change to better reflect the underlying African labor market dynamics without keeping the real wages fixed. We assume an aggregate labor supply curve with an elasticity of 1. While this is a feature that most of the previous CGE studies on the impact of the AfCFTA do not include, it is nevertheless an approach to modeling the labor market, which is both well-documented and implemented in other studies (see Peterson, 2019). Moreover, the focus of previous studies is to estimate the economic and welfare effects of the implementation of the agreement. While our analysis also does render the macroeconomic and welfare impacts of the agreement, our primary focus lies on estimating the impact on the environment. Compared to previous studies on trade and environment that focus solely on carbon emissions, we contribute to this strand of the literature by expanding the focus beyond CO2 emissions and including the effects on two additional environmental outcomes, namely non-CO2 emissions and air pollutants.
There is a shortage of studies that focus on the environmental assessment of FTAs in general and the AfCFTA in particular. As far as we know, no other studies are focusing on the impact of AfCFTA on CO2, GHGs, and air pollutants. The results of our analysis suggest a positive and significant macroeconomic impact, with an increase in trade and GDP across Africa, with the less-developed nations expected to benefit the most from trade liberalization economically. Our estimates suggest the negative environmental impact of the liberalization of trade within Africa on CO2, and GHGs, both increasing. Meanwhile, our results predict the AfCFTA to lead to the reduction of African emissions of other air pollutants by almost 25%.
Our paper shows that Africa’s growth and development can be fostered through intra-regional trade but we need to assess the effect on the environment for governments to design policies and regulations to cope with potential negative externalities. The rest of the paper is organized as follows: Section 2 presents the review of the previous literature; Section 3 describes the model, data, and assumptions; Section 4, presents the results; and Section 5 contains conclusions and policy recommendations.
2. LITERATURE REVIEW
Several previous studies use the CGE model incorporating GTAP data to estimate the economic impacts of the AfCFTA. The studies have used different setups, both regarding underlying assumptions for the baseline model and the expected outcome of the agreement. None of the previous studies, however, assess the estimated impact on emissions. This section provides an overview of previous studies to provide a backdrop for our paper.4 Hence, we summarize the findings of previous studies modeling the elimination of Intra-African tariffs. However, with the exception of the dynamic closure in Saygili et al. (2018) and Sandrey and Jensen (2015)’s model – which do allow for labor mobility – it is important to note that previous studies differ from ours. These studies assume that the supply of production factors, that is, labor and capital, is constant. In our baseline model, the increase in demand for labor can be captured even at the aggregate level.5
The previous studies estimate the welfare and GDP gains to be between 0.1% and 0.5%, and the estimated economic impact differs significantly across the continent. This results from the heterogeneity in country characteristics such as geographical location, production, and trade patterns. The most recent AfCFTA CGE modeling exercise is the World Bank (2020) study, which uses GTAP 2014 data and the World Bank’s ENVISAGE CGE model. Table 1 summarizes the main characteristics and results of previous studies that focus on welfare and macroeconomic effects.6
| Authors | Model | Data and liberalization | Results |
|---|---|---|---|
| Mevel and Karingi (2012) | Mirage model | 2004, total liberalization by 2017 | 0.6% increase in GDP |
| Sandrey and Jensen (2015) | GTAP model and data | 2011 | Increase in African welfare by $17 billion |
| Chauvin et al. (2016) | Mirage model and GTAP data | 2007 | Increase of 1.3% in GDP |
| Vanzetti et al. (2018) | Mirage model and GTAP data | 2014 | Overall welfare gain of about US$ 3.6 billion in the long run, which is approximately 0.1% of GDP |
| Saygili et al. (2018) | CGE dynamic model | 2014, liberalization takes place over 5 and 8 years, respectively | GDP growth estimated by 1% and total employment to increase by 1.2%. Intra-African trade is estimated to expand by 33% |
| African Development Bank (2019) | CGE | 2014 | 0.1% increase in net real income for the African continent, corresponding to an increase of $2.8 billion. Assumes NTB reductions in addition to tariff reductions as a result of the agreement |
| Abrego et al. (2019) | CGE with GTAP data | 2014 | Increase in the welfare of 0.05% for the continent GDP |
| World Bank (2020) | World Bank’s ENVISAGE CGE model GTAP data | 2014 | Continental real income to increase by 0.2%. Major gains from the introduction of trade facilitation measures and the reduction of non-tariff barriers* |
Notes: Own elaboration.
This study models tariff reductions in a less stylized way, incorporating more progressively reductions to mimic the actual outcome of the negotiations closer. Tariff lines on 90% of tariff lines are eliminated over a 5-year period (10-year period for the least developed countries, or LDCs). Starting in 2025, tariffs on an additional 7% of tariff lines are assumed that will be eliminated over a 5-year period (8-year period for LDCs). NTB, Non-Tariff Barriers.
Estimates of the welfare effects of the impact of the African Continental Free Trade Agreement
Concerning the literature that focuses on the environmental effects of FTAs, Glomsrød et al. (1992) is one of the first studies that use a CGE model to analyze the economic impact of introducing CO2 stabilizing policy instruments on Norwegian economic growth. Their analysis, which includes CO2 and other emissions, indicates that a cap on CO2 emissions could be introduced without dramatically reducing economic growth. That policy implementation could simultaneously reduce emissions to air other than CO2, yielding considerable gains in noneconomic welfare. Baghdadi et al. (2013) investigate whether Regional Trade Agreements (RTAs) with environmental provisions affect absolute and relative pollution levels. The study focuses on the determinants of CO2 emissions for a cross-section of 182 countries over the period 1980–2008. A propensity score matching approach is combined with difference-in-differences techniques to effectively isolate the effect of the RTA variable. The main results indicate that the CO2 emissions of the pairs of countries that belong to an RTA with environmental provisions tend to converge and are lower in absolute terms. Furthermore, they find that emissions converge more rapidly for North American Free Trade Agreement (NAFTA) than for EU-27 and Euro-Med countries. Cherniwchan (2017) estimates the effects of NAFTA on the emissions of particulate matter (PM10) and sulfur dioxide (SO2) from manufacturing plants in the United States. The findings suggest that trade liberalization led to significant reductions of these pollutants at affected plants. On average, the estimates account for nearly two-thirds of the reductions in PM10 and SO2 emissions from the US manufacturing sector between 1994 and 1998. Those reductions can be attributed to trade liberalization following NAFTA. Zhou et al. (2017) use panel data methods for 136 countries from 2001 to 2010 to estimate the effect of trade liberalization with and without environmental provisions on the resulting levels of PM 2.5 air pollution.7 Their main results show support for including environmental provisions in RTAs since those RTAs are likely to be associated with a lower level of PM2.5 concentrations, and those without lead to worse air.
Less attention has been directed to the effects of trade and trade policies on local air pollution in developing countries. Xu and Masui (2009) assess the impacts on local air pollutant emission reduction and ancillary CO2 emission reduction of SO2 by introducing a sulfur tax in China.8 Their results show that, while an emission cap could help control SO2 emissions, it would also likely result in a large GDP loss. Oh et al. (2019) use a static CGE model to analyze the economic impact of policies for reducing air pollutants and the interactions between those policies in Korea. The results indicate that the economic impacts of policies aiming to reduce air pollutants and GHGs were significant, ranging from 0.3% to 1.8% of GDP.
Gumilang et al. (2011) use a CGE model for Indonesia to compute the environmental impact of its trade agreements with Japan (IJEPA; Indonesia-Japan Economic Partnership Agreement) and ASEAN (AFTA; ASEAN Free Trade Area). Overall, tariff reform is shown to induce air pollution and reduce water pollution. Results indicate that Indonesia’s participation in the IJEPA and AFTA agreements is not likely to bring drastic changes to the economic and environmental performance. Yao et al. (2019) use a gravity framework to study the impact of FTAs on carbon emissions. They find a significant impact of FTA agreements on reductions of CO2 pollution by pair of countries. However, the evidence is mixed: for high-income countries, FTAs are beneficial, but for lower-middle-income countries, the environmental quality declines. They claim that low-income countries have a more significant pollution effect even after implementing an FTA due to lenient environmental standards.
In the specific context of Africa, studies that relate trade, development, and environmental impact are quite scarce. Our work breaks new ground in quantifying the impact of an increase in trade and economic activity due to implementing the AfCFTA on environmental outcomes.
Frankel and Rose (2005) set out to determine the causality behind the observed correlation between trade openness and environment, that is, analyzing the effect of trade on a country’s environment for a given level of GDP. Their results support trade as a measure to reduce air pollution, such as SO2 and NO2. They interpret their findings as refute to the race-to-the-bottom theory, which states that increased openness to trade has a generally detrimental effect on the environment. Moreover, they conclude that their analysis lends general support for the Environmental Kuznets Curve (EKC). EKC is the notion that openness to trade accelerates the growth process at higher income levels and has positive effects on the environment.9
Other studies, such as Osabuohien et al. (2015), extend the EKC model by including indicators of the presence of multinational corporations, trade, and energy to analyze their impact on measures of environmental pollution (CO2). This model was tested on a sample of 27 African countries for the period 1996–2010. Their findings suggest that trade may not have much contemporaneous impact on the environment. However, their lagged values have an adverse and significant influence on the current values of environmental challenges. They suggest that institutional development helps to suppress the negative excesses (like pollution) from the activities of trade and consequently reduce environmental pollution.
Beyene and Kotosz (2020) focus on testing the EKC hypothesis for East African countries from 1990 to 2013. The results show that the economic activities in East African countries do not lead to a significant increase in CO2 emissions. They find that the relationship between per capita income and CO2 emissions follows an inverted U-shaped relationship. For low-middle-income countries, higher development will lead to higher levels of emissions until those countries reach a more advanced level of development; economic growth (hence higher income) will reduce emissions.
3. METHODOLOGY AND DATA
In this study, we use the GTAP database version 10a and our customized extension of the standard GTAP model (Hertel, 1997) to analyze the macroeconomic and environmental impact of the AfCFTA. We use the GTAP CGE modeling framework to explore the impact of trade liberalization under the AfCFTA on emissions in the African Subcontinent. The GTAP Model is a multi-region, multisector, CGE model with perfect competition, which runs simulations interactively using the GTAP general equilibrium model.
To complement the standard GTAP model, we include emissions as a function of output and inputs. Here, CO2 emissions are available for different uses of commodities: government consumption, private consumption, and intermediate inputs – both domestic and imported. The equations in the model depict the change (in %) of each type of emissions as the change (in %) in the corresponding economic variable. For example, a change in imported private consumption qpmi,s also induces a change in emissions from the imported private consumption. The aggregate CO2 emission is the sum of all these types of emissions as shown in Equation (1), for a commodity i in region s; industrial emissions are summed across industry uses j:
The GTAP-E model captures the changes such as the ones above. However, the purpose of this paper is not to analyze emissions trading and carbon taxes, but instead, we use this extension for emissions accounting to examine the impact of trade policy on emissions. Furthermore, we include other types of emissions and pollutants, which is a novel contribution of our model extension within the GTAP framework. It is important to note that there are trade-offs and tensions between reducing different types of emissions, which we set out to capture in our analysis. We have output-linked emissions for air pollutants and non-CO2 GHG emissions, whose percent change is the same as the percent change in output, input-linked emissions, and consumption-linked emissions. In addition, we have emissions linked with intermediate inputs and endowment use by firms, separately identified in the model. Equation (2) shows the accounting equation for Air Pollutants (AP) and non-CO2 GHG emissions, denoted collectively by APNonCO2, for a given sector i and region s, while the emissions associated with the inputs are summed up across industries j.
We follow Chepeliev (2020a and b) methodology in which the input-based emissions (both primary and intermediate inputs), output-based emissions, and consumption-based emissions are mutually exclusive. Input-based emissions come from the use of specific primary inputs consumed by industries. Output-based emissions are those that are only generated during the process of production. Those sum up to the total emissions for both non-CO2 emissions and air pollutants.
Each variable in Equations (1) and (2) is derived from a corresponding variable in the economic part of the model as described above. Equations (3)–(6) show these linkages for inputs, households, output, and government, respectively, in a simplified way and expressed in percent differences. We have more complex linkages in the actual model code, such as those between domestic and imported consumption by firms, government, and households, for CO2 emissions and not for non-CO2 or air pollutant emissions. We linearized the equations that capture emission intensities. In so doing, we assume that the emissions intensity with respect to a specific type of category of emissions remains the same before and after our simulation. For instance, if an industry emits X units of emissions when one unit of output is produced, then if the output doubles, it is assumed that the emissions also double. In other words, these equations do not capture any behavioral relationship between different variables and emissions, but instead, they are simply accounting linkages between them.
Another departure we make from the standard GTAP model is to assume that both aggregate employment and real wages can change and assuming an upward-sloping labor supply curve, with a unit-elastic response of labor supply to real wages at an aggregate level. This is a standard assumption in the literature, particularly dealing with CGE modeling for labor markets comprehensively (Peterson, 2019). This is shown in Equation (7):
It is possible to use the slack variable to allow for exogenous changes in labor supply or even endogenize it. In other words, our assumption is flexible, with possibilities to fix or flex different types of labor using the slack variable. Therefore, we do not require to keep all types of labor as fully employed or otherwise. We can assume one type of labor as fully employed and another type under-employed, if needed. This flexibility in assumption is important to capture the reality that trade liberalization can simultaneously affect employment and real wages. For our simulation, we assume full employment in skilled labor and unemployment in unskilled labor.
For our study, we use the GTAP 10A database with the benchmark year of 2014. The CO2 and non-CO2 emissions (GHG) databases are integrated into the GTAP database. We use the database FAOSTAT 2019 (Food and Agriculture Organization of the United Nations) to source agricultural non-CO2 GHG emissions, and EDGAR version 5.0 and version 4.2 databases are used to source non-agricultural emissions. Each emission flow is associated with one of the four sets of emission drivers: output by industries, endowment by industries, input use by industries, and consumption by households (see Chepeliev, 2020a and b). FAOSTAT reports 10 emission categories under agricultural emissions. Those represent activities that produced such emissions. FAOSTAT does not report agricultural emissions of Fluorinated Gases (FAGS), but only nitrous oxide (N2O) and methane (CH4) emissions. Three out of 10 emission categories have both GHGs; these include burning crop residues, burning savanna, and manure management, while seven remaining categories produce either N2O or CH4.
The following emissions are included in our analysis:
- (i)
CO2 emissions presents CO2 emissions data from energy commodities consumption. Energy commodities include coal extraction (coa), crude oil (oil), natural gas extraction (gas), petroleum products (p_c), electricity (ely), and gas manufacture and distribution (gdt). CO2 emissions for electricity are equal to zero, as well as for all other non-energy commodities. The CO2 emissions are measured in Giga gram or Gg.
- (ii)
Non-CO2 GHGs emissions: The GTAP non-CO2 database complements the GTAP-E database and provides information on other GHG emissions: CH4, N2O, and FAGS.
- (iii)
The air pollution database provides information on the emissions of 10 air pollutants: black carbon (BC), carbon monoxide (CO), ammonia, non-CH4 volatile organic compounds (short cycle carbon) (NMVB), non-CH4 volatile organic compounds (long cycle carbon) (NMVF), nitrogen oxides, organic carbon, PM10, PM2.5, and SO2.
Hence, we arrive at a total of 14 types of emissions and air pollutants. The AfCFTA will create an expanded single continental market; African countries have agreed to eliminate 97% of tariff lines on intra-Africa trade in goods. Hence in simulating the experiment, we shock by eliminating 97% (Chidede, 2020; IMF, 2020a and b) of import tariffs of all tradable commodities in all the AfCFTA regions and countries. The import tariff elimination will lead to the proliferation of imports, and with that, the domestic industry will boost employment opportunities and production output.
In the Appendix, Table A1 shows the corresponding codes for the endowments, Table A2 shows the 65 sectors that have been used for the analysis, and Table A3 summarizes the regions and areas object of study.
4. RESULTS
First, we focus, succinctly, on the macroeconomic and welfare results based on 97% intra-African tariff elimination. Figure 1 summarizes the estimated change in trade in the African subcontinent. As can be seen from Figure 1, the vast majority of countries are estimated to experience increases in trade (exports and imports), with the largest increases in Togo (39%), Senegal (24.7%), Kenya (22.1%), and Ethiopia (21.3%). The exception, with a substantial drop in exports, is Burkina Faso.10 Imports in the coastal countries of Benin, Ghana, Cote D’Ivoire, and Togo, are all expected to increase significantly (47.6%, 18.6%, 16.3%, and 7.9%, respectively). For the 16 landlocked countries, where intra-regional trade is important, greater regional integration can help these countries become less constrained by unfavorable boundaries. Overall, our simulations project a continent-wide 5.6% increase in exports and a 6.1% increase in imports.
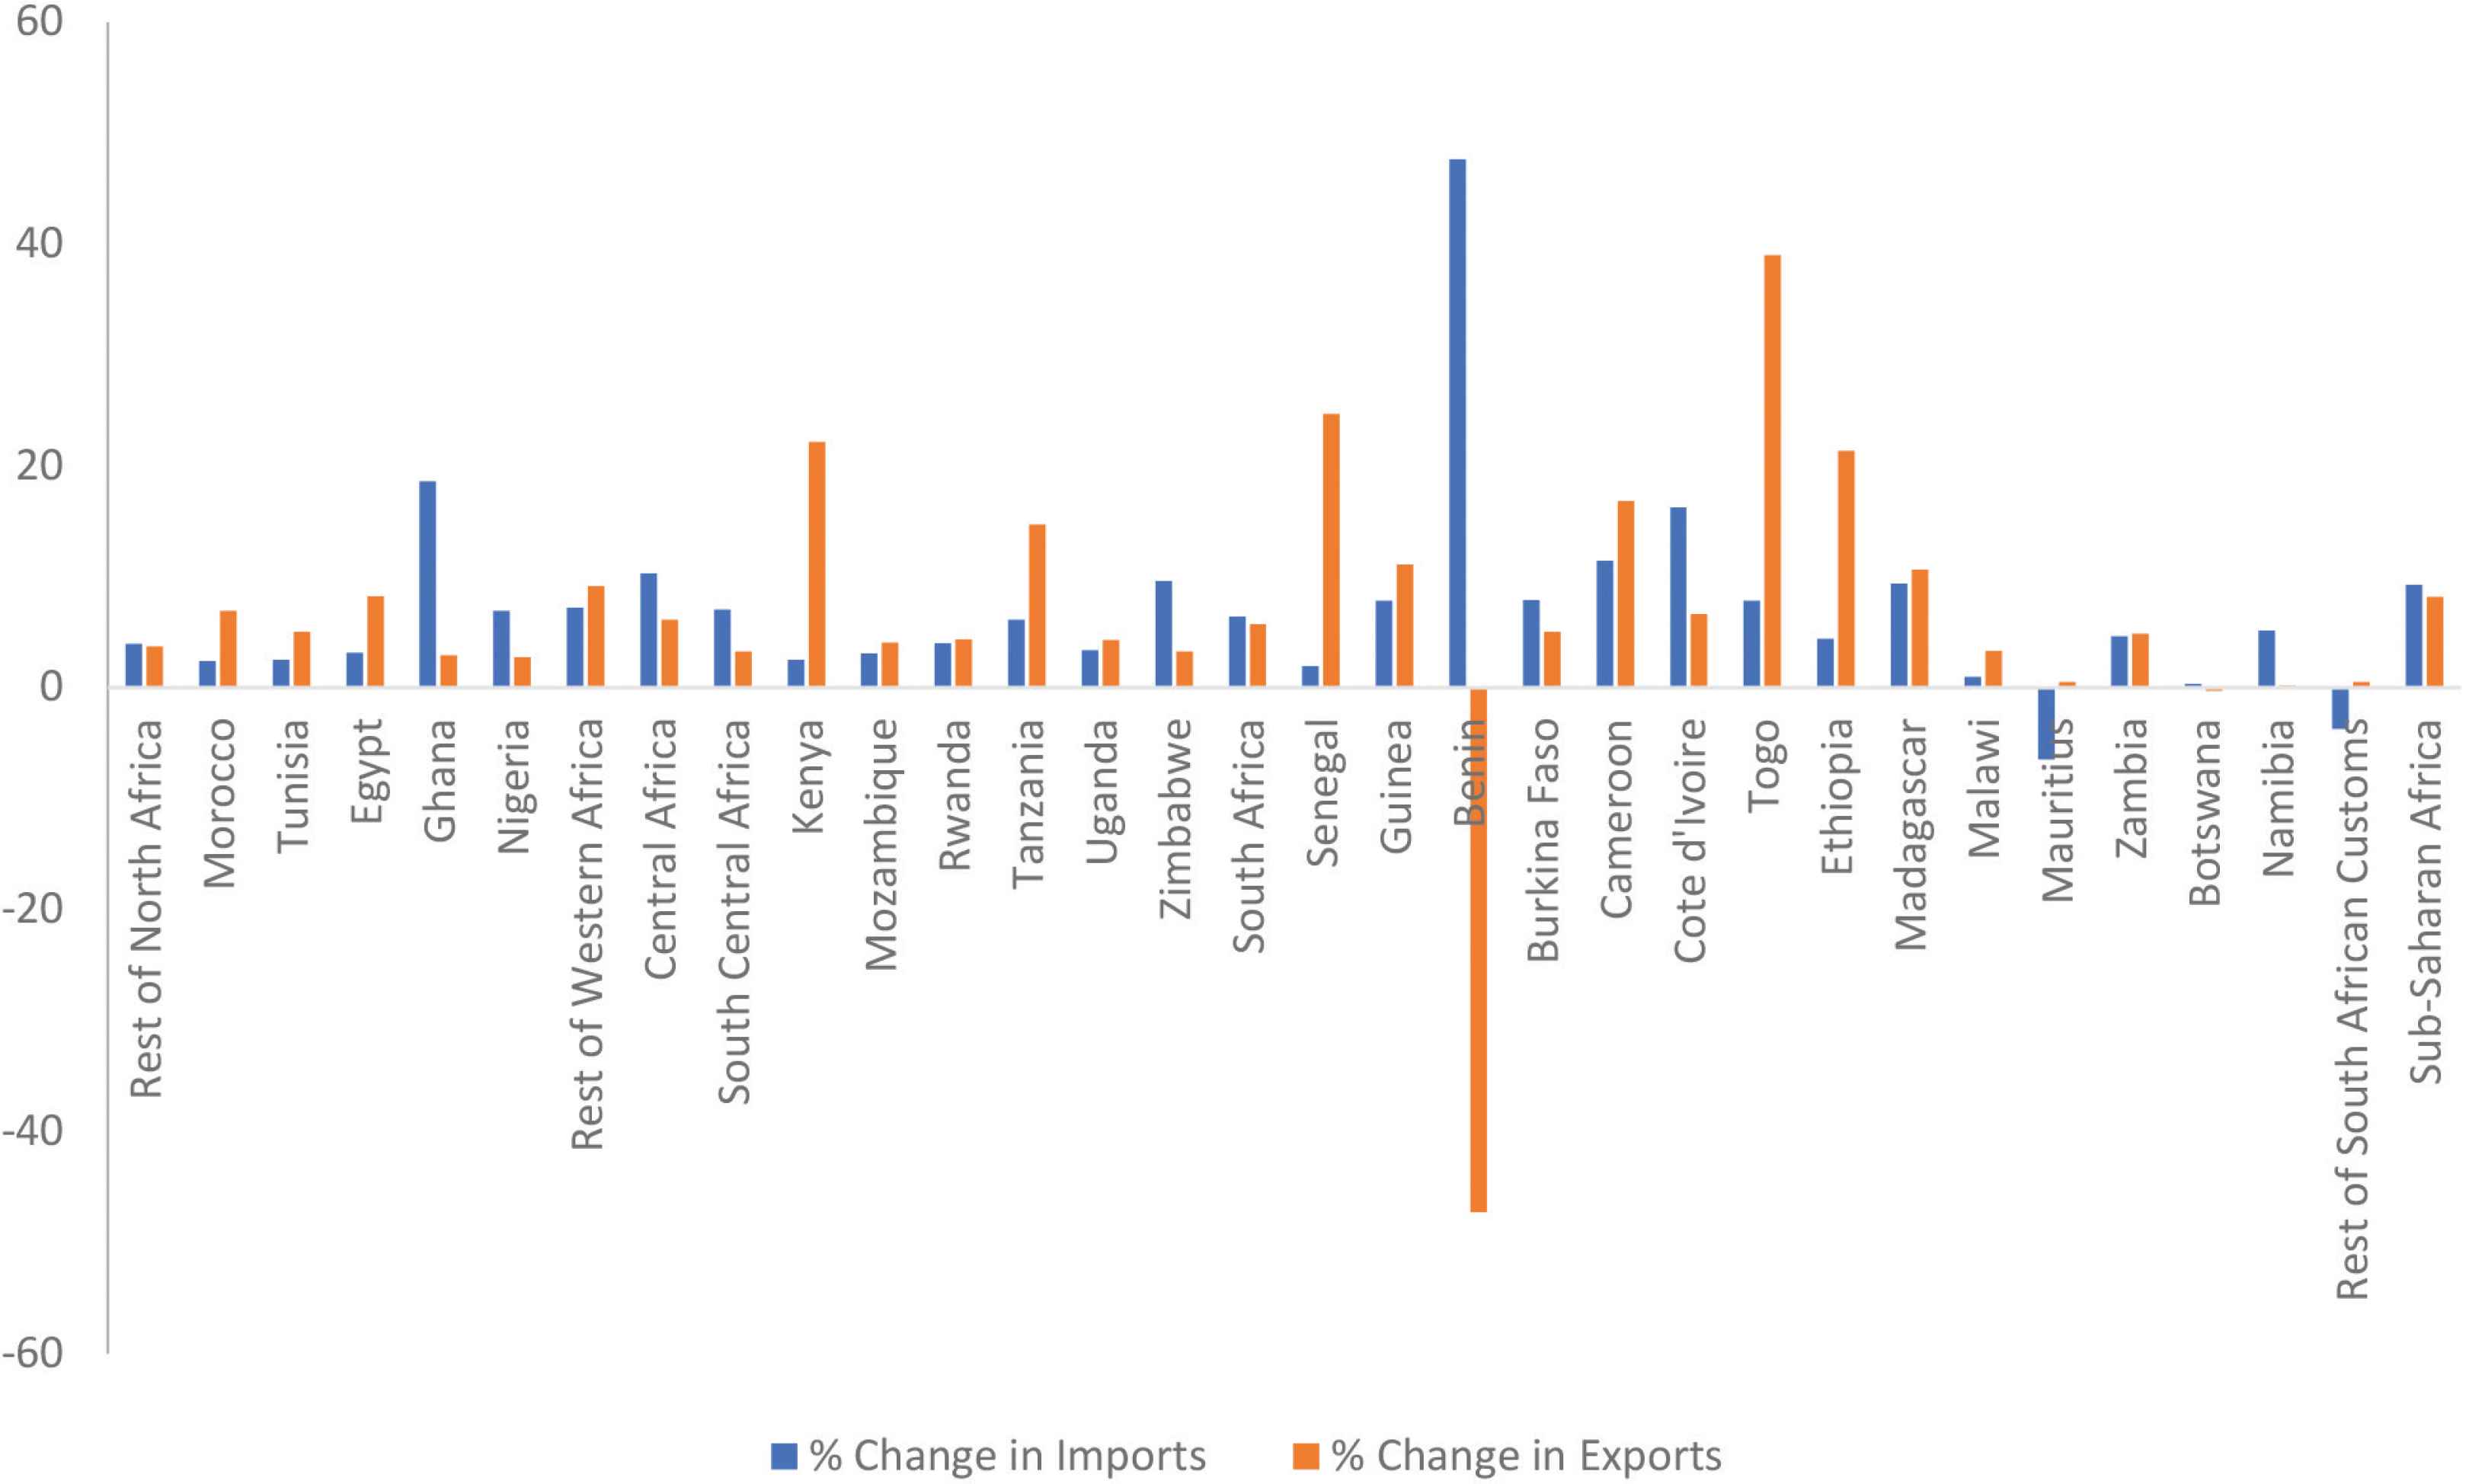
Change in imports and exports in African subcontinent due to trade liberalization. Source: GTAP model results from the authors’ analysis.
Table 2 summarizes the main macroeconomic results, GDP change, welfare effects, and emissions. Lower tariffs are shown to lead to a 1.2% increase in GDP for the continent as a whole. Our analysis shows that transit countries, such as Togo and Benin, stand to gain significantly from the agreement on the disaggregated level.11 Here, Ghana and Cote d’Ivoire will experience a 9.9% and 6.2% increase in GDP, respectively, from reducing tariffs under the AfCFTA. Benin experiences the highest estimated GDP increase by 31.2%.12 However, GDP in Senegal (–0.2%) and Mauritius (–2.2%) are expected to contract slightly as a result of the FTA.
| Country | GDP (%) | Welfare (million $) | CO2 emissions (% change) | Non-CO2 (% change) | Air pollutants (% change) |
|---|---|---|---|---|---|
| Rest of North Africa | 0.8 | 2436.1 | –0.3 | –11.3 | 47.1 |
| Morocco | 1.7 | 760.5 | 1.7 | 17.3 | 1.8 |
| Tunisia | 1.7 | 397 | 0.4 | 16.0 | 15.5 |
| Egypt | 1.9 | 3745.8 | 1.7 | 31.6 | 0.9 |
| Middle East and North Africa | 0.8 | 39745.8 | –0.1 | 14.3 | –45 |
| Ghana | 9.9 | 3587.7 | 9.0 | 74.9 | 121.3 |
| Nigeria | 0.8 | 6093.8 | –0.5 | 3.8 | –80.8 |
| Rest of Western Africa | 4.1 | 666.2 | 5.4 | 30.8 | 50.4 |
| Central Africa | 2.0 | 1684 | 3.2 | 2.8 | –24.8 |
| South Central Africa | 1.6 | 3150.1 | 1.0 | 18.9 | –76.8 |
| Kenya | 1.4 | −517.4 | 1.8 | 14.0 | 56 |
| Mozambique | 2.0 | 178.8 | 3.0 | 22.8 | –12.1 |
| Rwanda | 2.9 | 211.9 | 3.3 | 34.6 | –98.8 |
| Tanzania | 2.5 | 353.9 | 2.8 | 46.8 | –58.4 |
| Uganda | 0.7 | 176.3 | 1.0 | 22.0 | –35.7 |
| Zimbabwe | 3.4 | 457.2 | 2.0 | 19.2 | –54.1 |
| South Africa | 1.2 | 3034 | 0.7 | 19.6 | 8.8 |
| Senegal | –0.2 | –644.1 | –0.4 | –16.4 | 19.4 |
| Guinea | 4.2 | 217.5 | 3.7 | 48.2 | 52.1 |
| Benin | 31.3 | 2848.6 | 38.7 | 354.7 | 20.0 |
| Burkina Faso | 1.7 | 267.5 | 0.8 | 9.4 | 52.1 |
| Cameroon | 3.1 | 571.8 | 3.6 | 43.7 | 52.3 |
| Cote d’Ivoire | 6.3 | 2035.4 | 6.1 | 67.5 | 15.2 |
| Togo | 8.2 | –80.2 | 5.7 | –29.0 | 203.2 |
| Ethiopia | 1.6 | 196.3 | 2.2 | 18.2 | 89.5 |
| Madagascar | 1.3 | 46.8 | 1.1 | 18.5 | –46.8 |
| Malawi | 0.3 | –35.9 | 0.1 | –27.2 | 10.2 |
| Mauritius | –2.2 | –435.1 | –0.7 | –2.6 | 6.4 |
| Zambia | 1.8 | 482.8 | 2.3 | 5.9 | –18.9 |
| Botswana | 0.3 | 125.7 | 0.0 | 3.1 | 0.1 |
| Namibia | 2.5 | 417.4 | 2.1 | 17 | –39.4 |
| Rest of South African Customs | 0.3 | –55.1 | 0.0 | 1.5 | 23.6 |
| Sub-Saharan Africa | 3.1 | 2230.3 | 3.0 | 36.1 | –31.4 |
| Aggregate African continent | 1.2 | 74351.2 | 0.3 | 19.6 | –21.5 |
Source: GTAP model results from the authors’ analysis.
Country specific effects – selected countries
With respect to changes in employment, Figure 2 shows the results by sectors. All countries will experience gains in employment growth except for Mauritius, Malawi, Senegal, and the rest of South African customs.
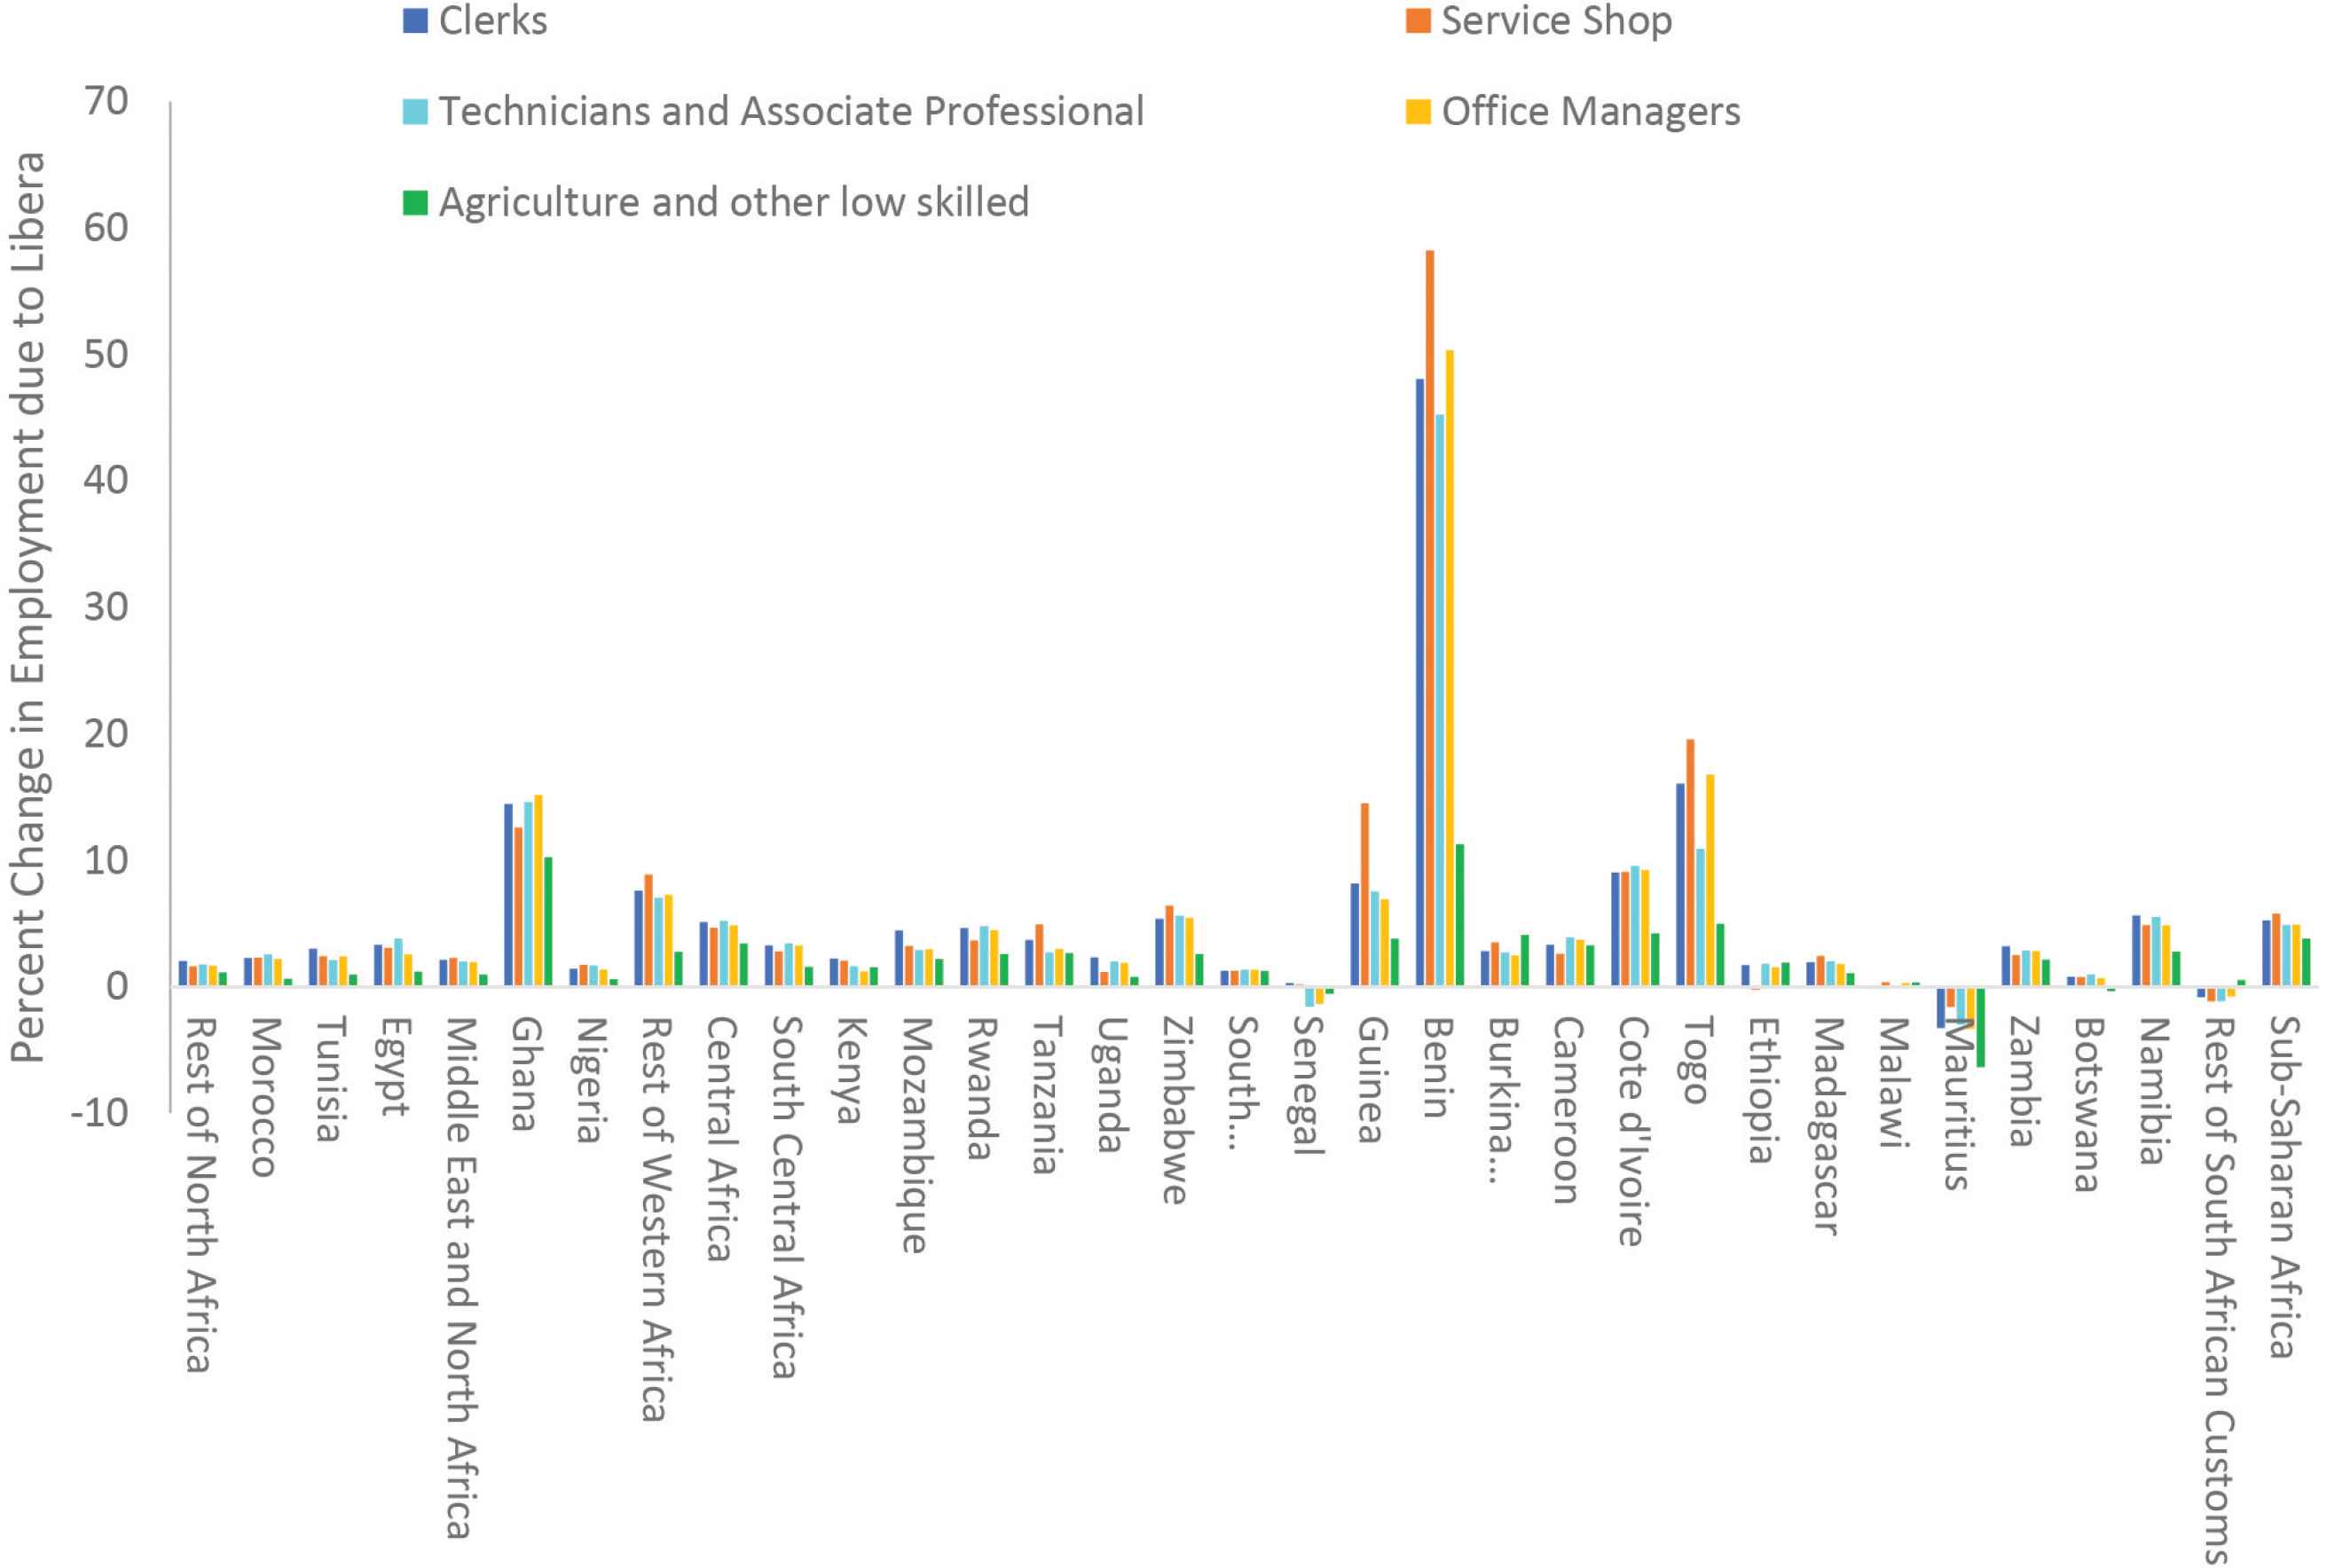
Change in employment due to liberalization. Source: GTAP model results from the authors’ analysis.
The corresponding environmental effects are reported in the Heatmaps (Figures 3–6). While the data for all countries are available in the Appendix, we focus on some countries of particular interest. Heatmap 1 (Figure 3) compiles the effects of the implementation of the AfCFTA on overall emissions. As can be seen from Figure 3, CO2 emissions are expected to increase by 0.3%. For the continent, non-CO2 GHGs emissions expand by 19.6%, while air pollutants decrease by 21.5%. The potential reduction of air pollutants is particularly relevant in Africa, which is in the grip of acute poverty and underdevelopment since health hazards associated with the air pollutants can worsen positive trade outcomes.
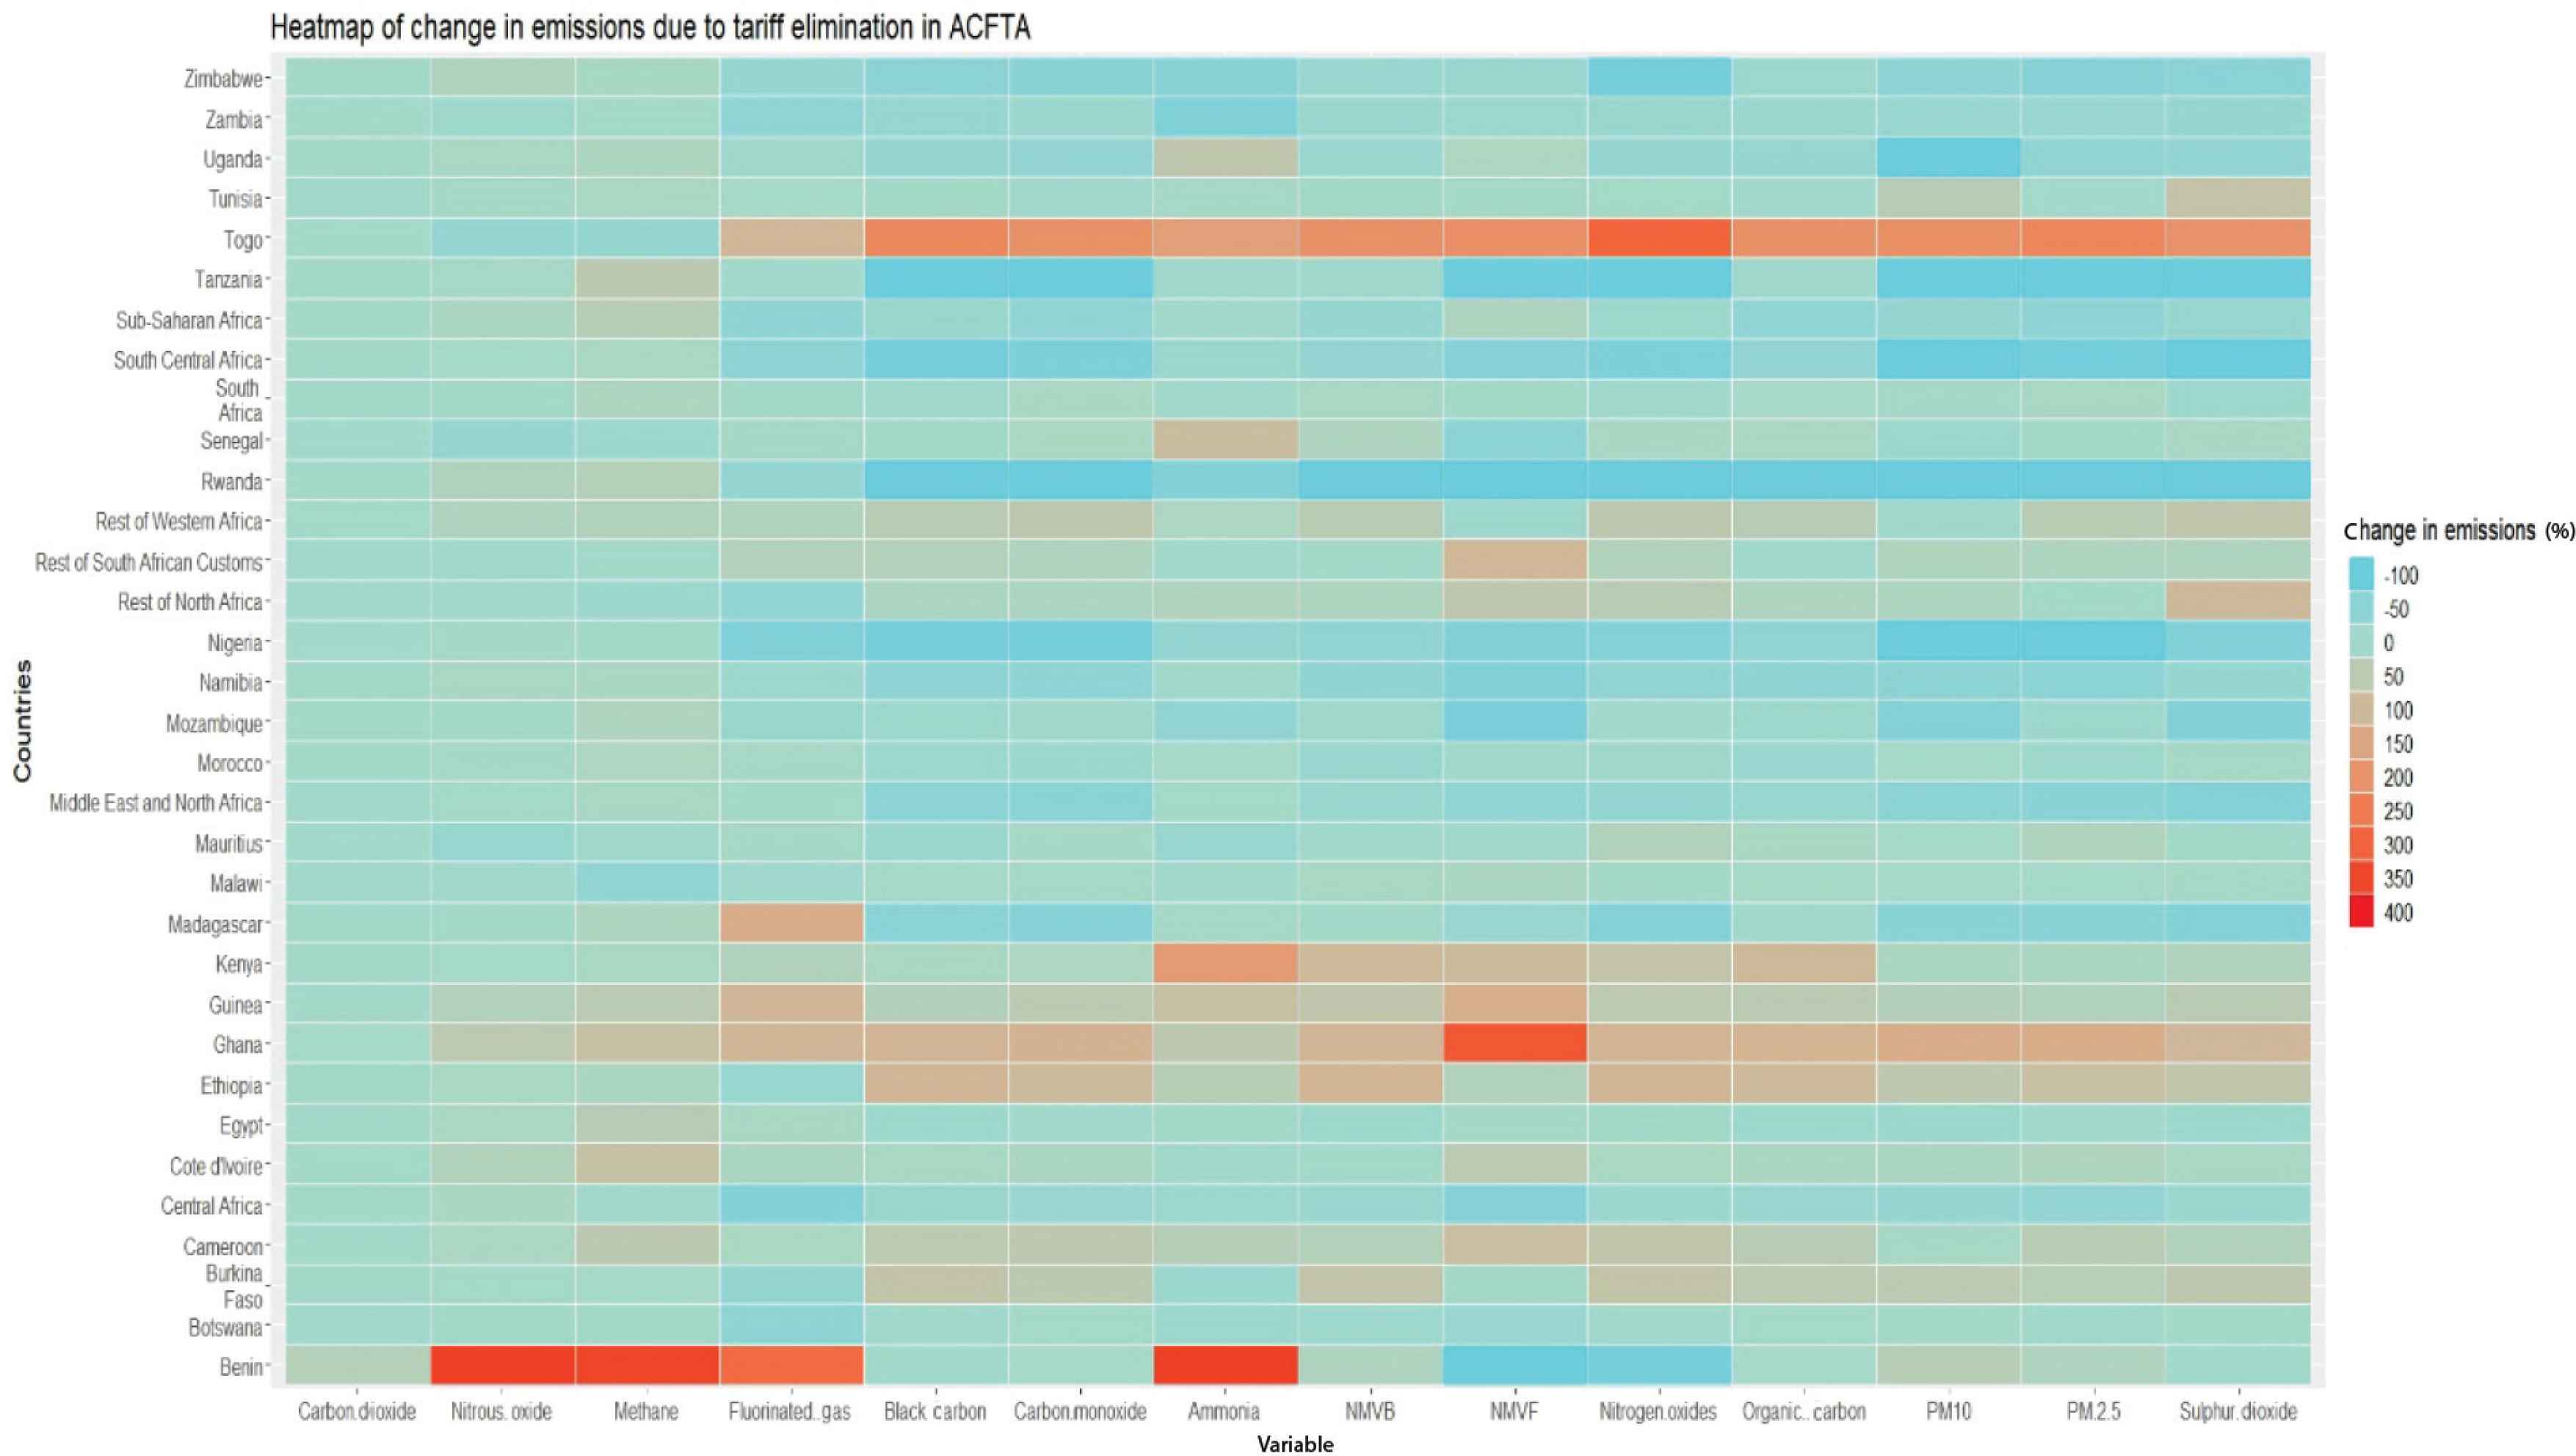
Heatmap 1. Source: Model results from the authors’ analysis.
Trade liberalization is estimated to lead to increased emissions in Ethiopia, Cameroon, and Burkina Faso. Furthermore, emissions in Togo and Benin are expected to increase manifold due to these countries’ geographical positions as transit countries, connected to big ports. The estimated increase in trade will lead to an increase in the movements of vehicles in these countries, causing emission levels to rise as well. Similarly, many South-Central African Nations, like Congo, Democratic Republic of Congo, Angola, and Gabon, experience a reduction in emissions. About 29% of total imports in Kenya are attributable to intermediate products, which will become cheaper as tariffs are removed, which will increase production activity. The increase in economic activity leads to a rise in emissions. By contrast, Rwanda is a small landlocked country that imports food products, machinery and equipment, construction materials, petroleum products, and fertilizers. Here, the reduction of tariffs results in lower prices of imports and induces substitutions in production, which then has the potential effect of reducing emissions. In the same manner, the AfCFTA is expected to cut the emissions of air pollutants by half in Zimbabwe due to the availability of cheaper imports of mineral fuels and oils, machinery, pharmaceuticals, fertilizers, electrical machinery, and chemical goods. In Guinea, there is an increase in CH4 and FAGS, and other air pollutants, which stems from an increase in the production of mining products such as Bauxite, iron ore, and crude oil.
Heatmap 2 (Figure 4) provides details of sector-wise CO2 emissions post-implementation of AfCFTA. On the aggregate level, the agreement’s implementation is expected to incur a marginal increase in CO2 emissions in Africa (0.3%). As previously discussed, Benin’s increase in CO2 emissions is shown to be the highest (38.7%). Also, there is an increase in CO2 emissions due to the expansion in the meat sector in Morocco, Ghana, Guinea, and Cote d’Ivoire. In Ethiopia, the (32.7%) increase is attributable to the growth of gas production. Meanwhile, the expected increase in CO2 emissions in Morocco, Tanzania, and Uganda (44.6%, 41.1%, and 49.9%, respectively) stems from the expansion of the production of paddy rice. Nigeria experiences a reduction in emissions due to tariff elimination. Meanwhile, CO2 emissions decrease (by –0.5%), with significant reductions in the sectors of coal and manufacturing of metal products.
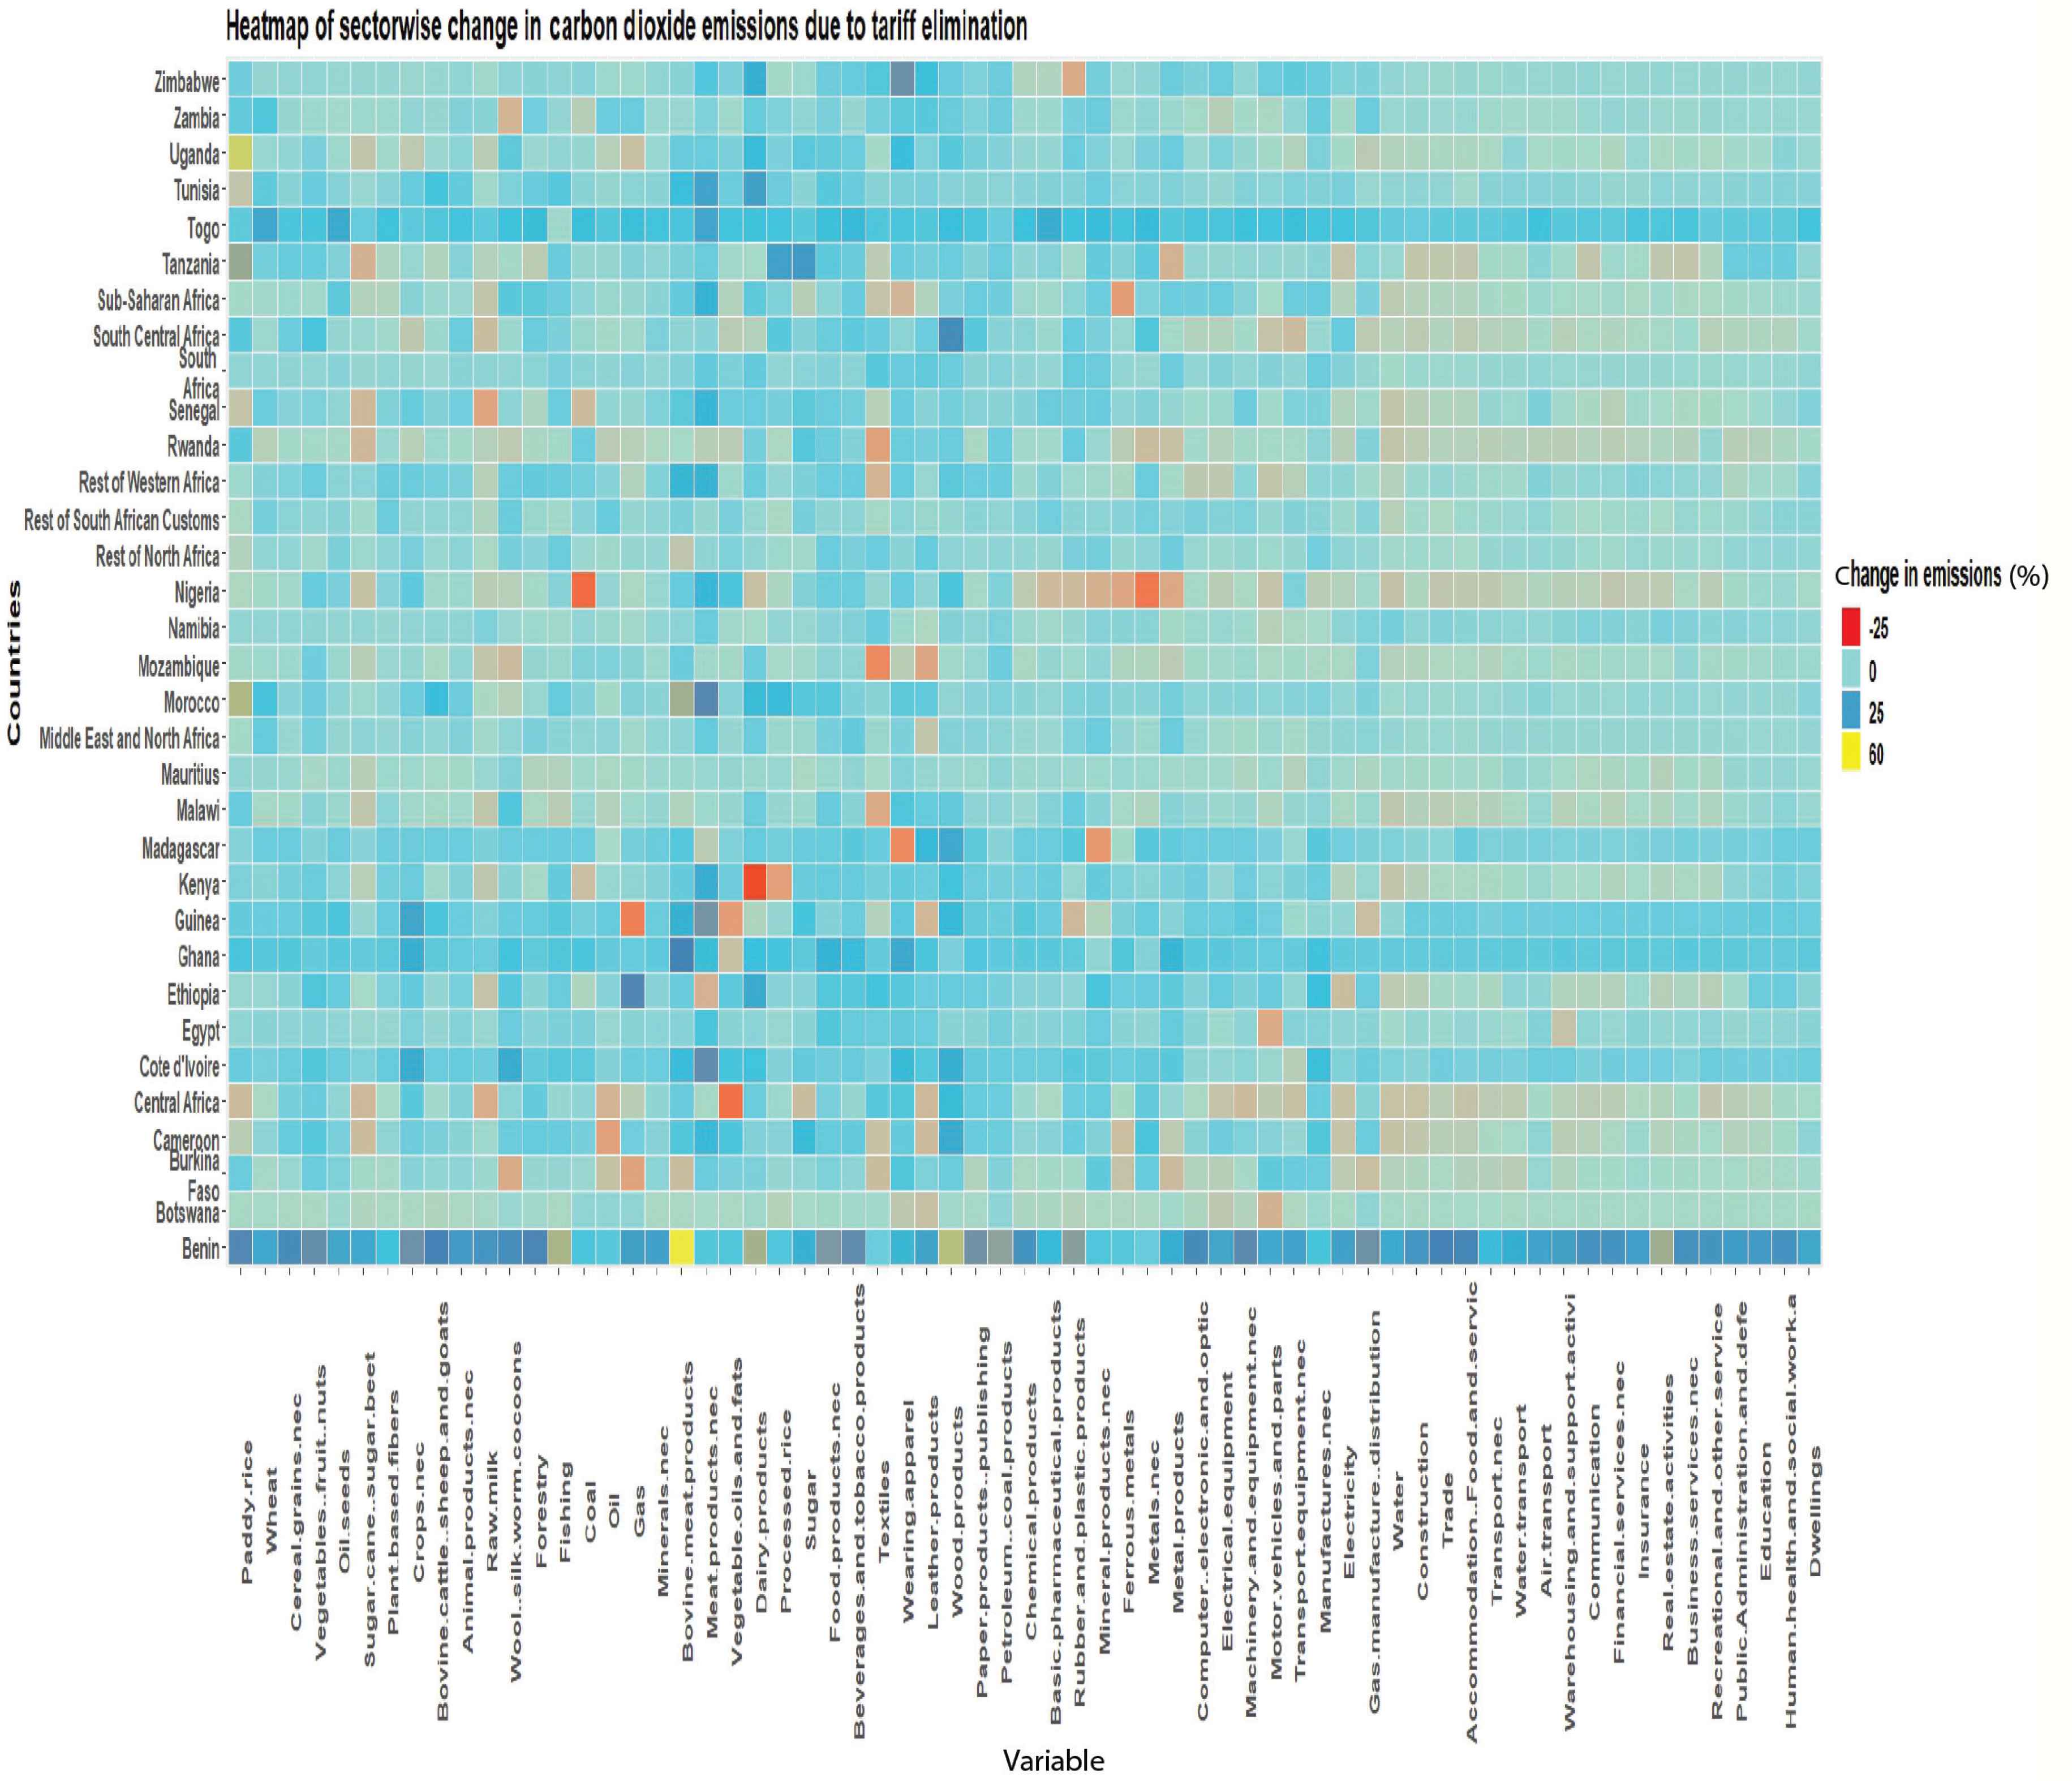
Heatmap 2. Source: Model results from the authors’ analysis.
Heatmap 3 (Figure 5) shows the sector-specific changes in non-CO2 emissions.13 Here, we note that Benin and Togo are outliers since they are the smallest economies, implying that the greatest relative changes are expected to occur there. The biggest increase in non-CO2 emissions is shown to occur in Ghana. The emissions in the wool and silkworm sectors are estimated to increase by 1428.3%. Increased export and production leads to higher CH4 emissions. Many countries, such as Namibia (458.2%), Ghana (318.2%), and Western Africa (310.4%), experience a significant increase in non-CO2 emissions in the transportation sectors, which stems from an induced increase in trading activity. Other sectors that drive the expansion of non-CO2 emissions are metals, construction, electrical equipment, chemical products, and the wool sector. Meanwhile, reductions in non-CO2 emissions are estimated to occur in sectors such as meat, vegetable oils, dairy, processed rice, sugar, textiles, apparel, leather, rubber, metal products, computer and electrical equipment, and motor vehicles parts sectors. Both Rwanda and Tanzania are sugar-deficit countries. Lowering tariffs leads to lower costs of imports and higher imports of sugar, hence reducing national sugar production and reducing their non-CO2 emissions by 100%. Textiles is a well-established industry in Botswana, although it is small compared to the other countries in the region. With cheaper imports, the textile industry’s production is impacted, resulting in a 100% reduction of non-CO2.
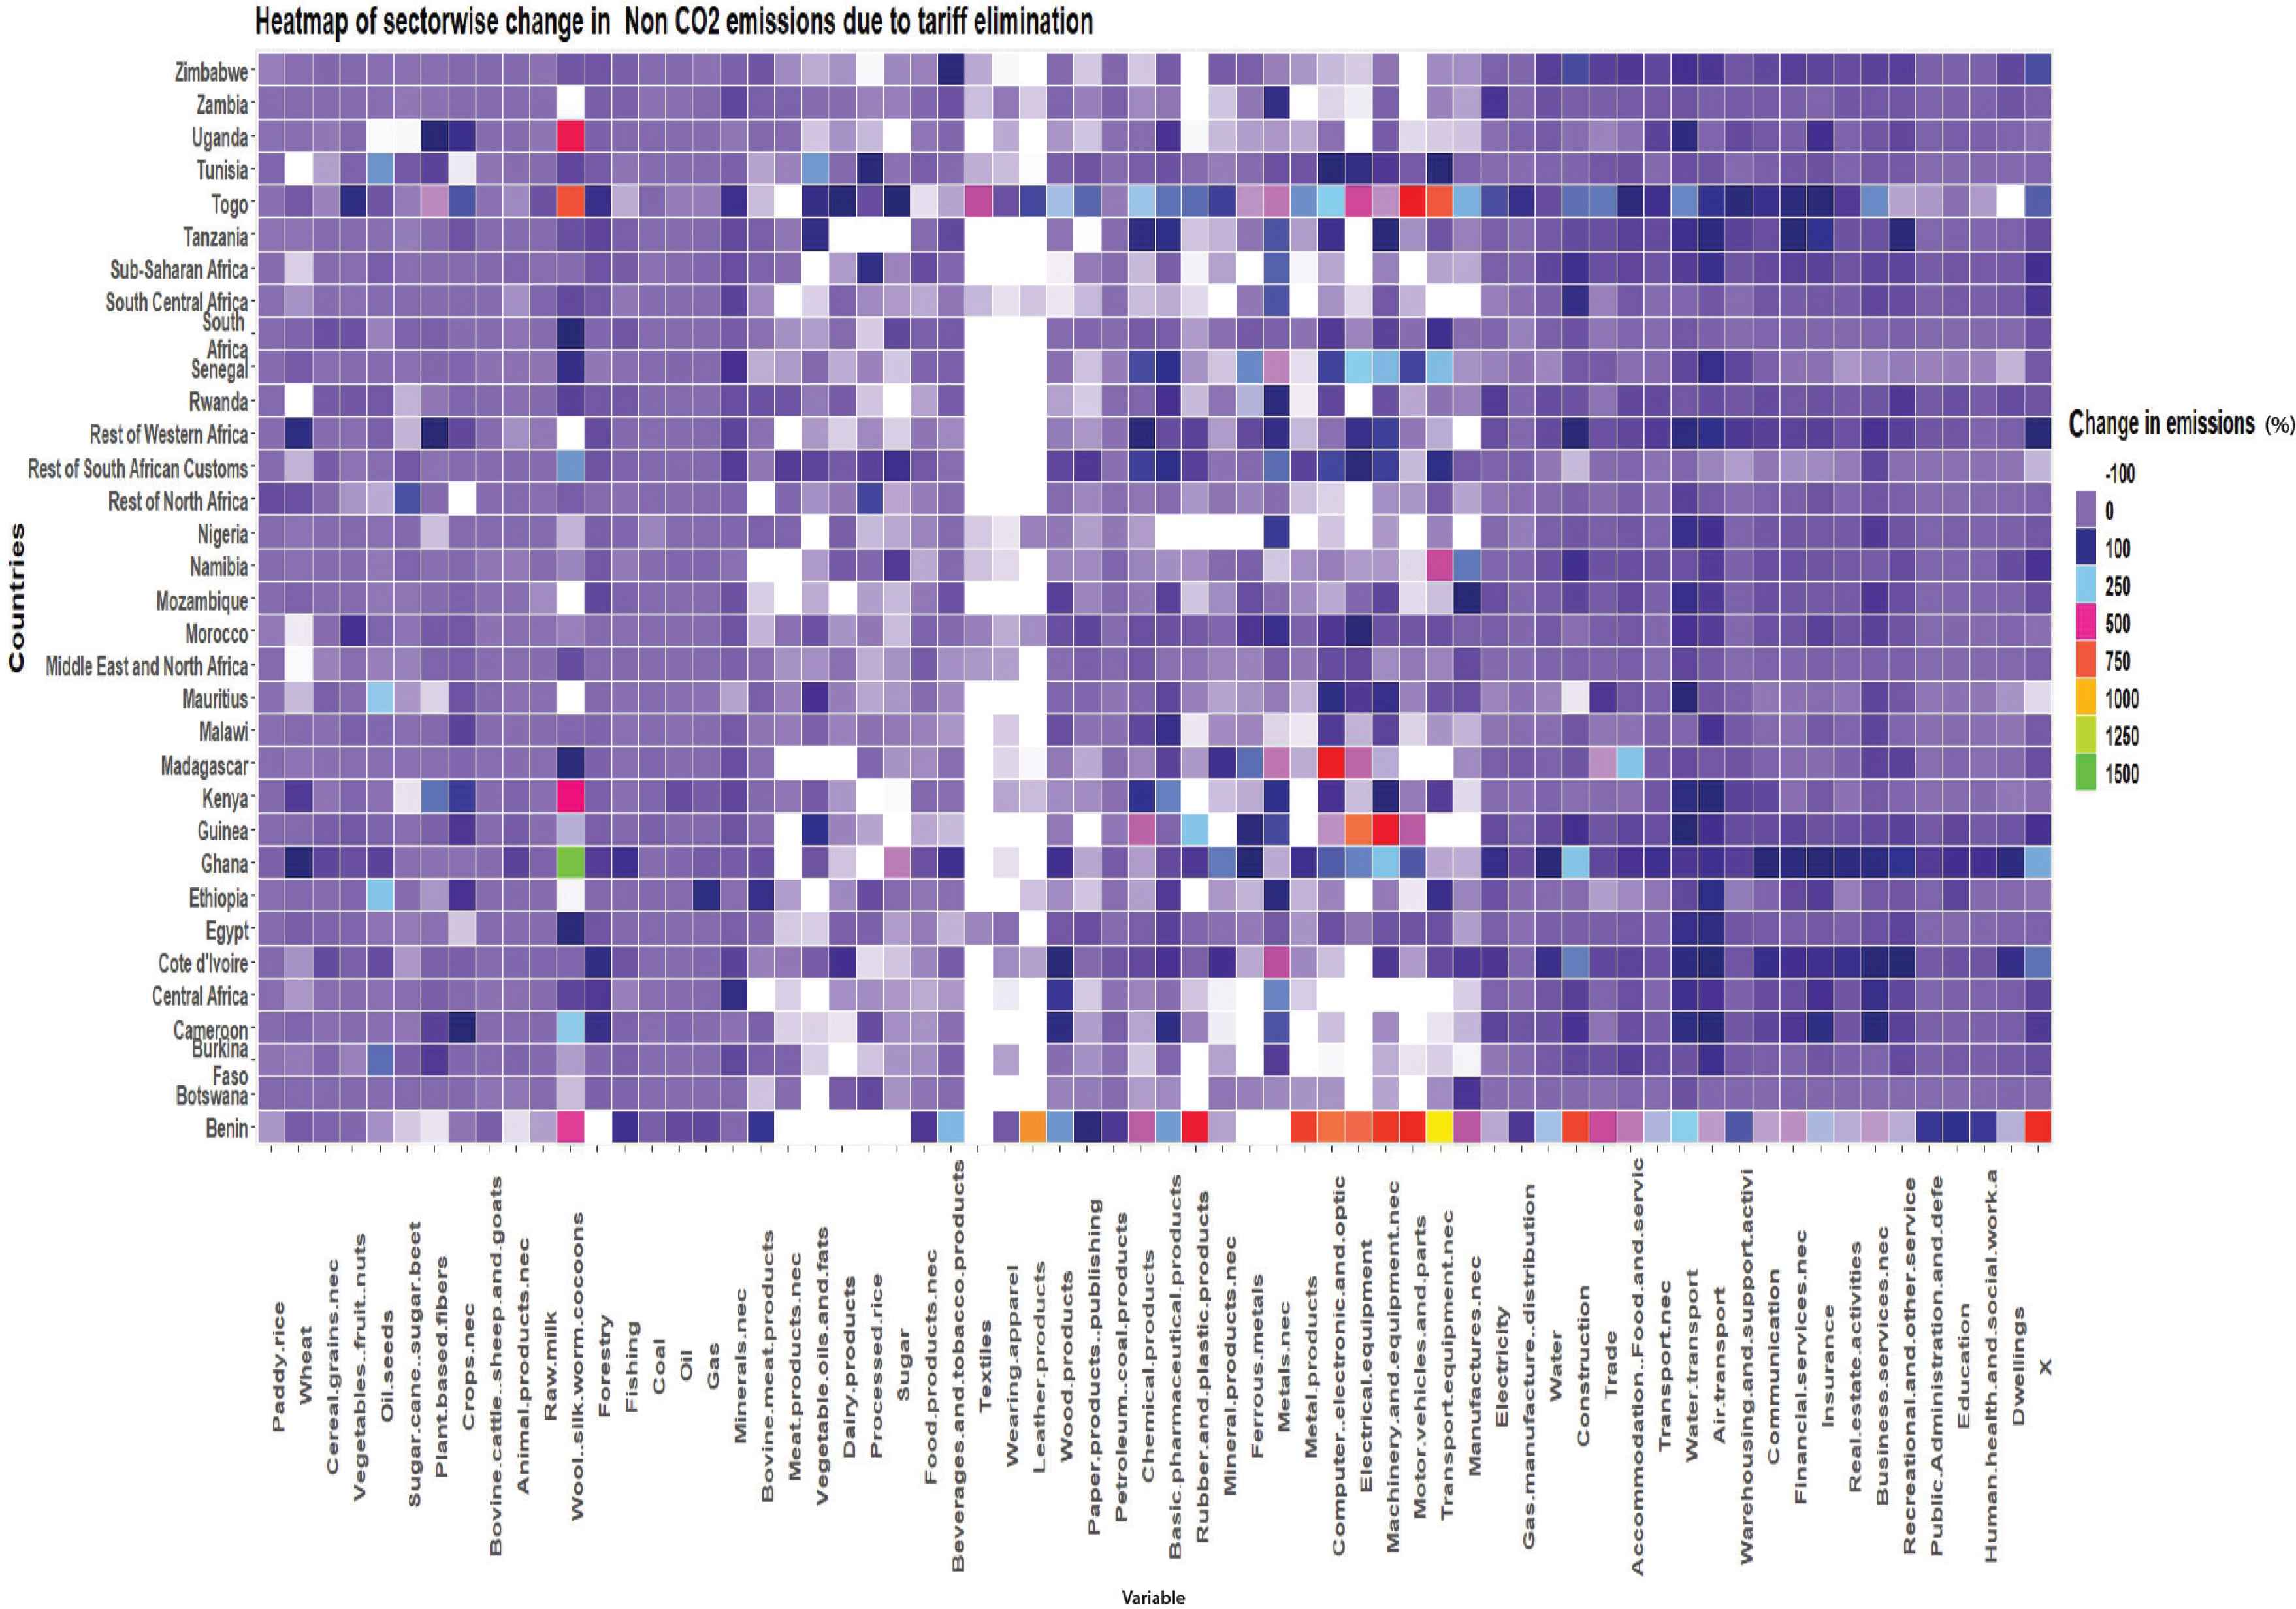
Heatmap 3. Source: Model results from the authors’ analysis.
Heatmap 4 (Figure 6) summarizes the effects on the results for one of the air pollutants, CO gas. Here, we observe that CO increases in areas with heavy traffic congestion, for example, in Namibia (403.1%,) Egypt (127.4%), and Ghana (81.1%). However, in sectors like electrical equipment, textiles, apparel, leather industries, and meat processing, the AfCFTA is expected to reduce CO gas emissions significantly. Our results for the rest of the air pollutants show a sharp decline for the continent, which on average, is estimated to decrease by 21.5%.14
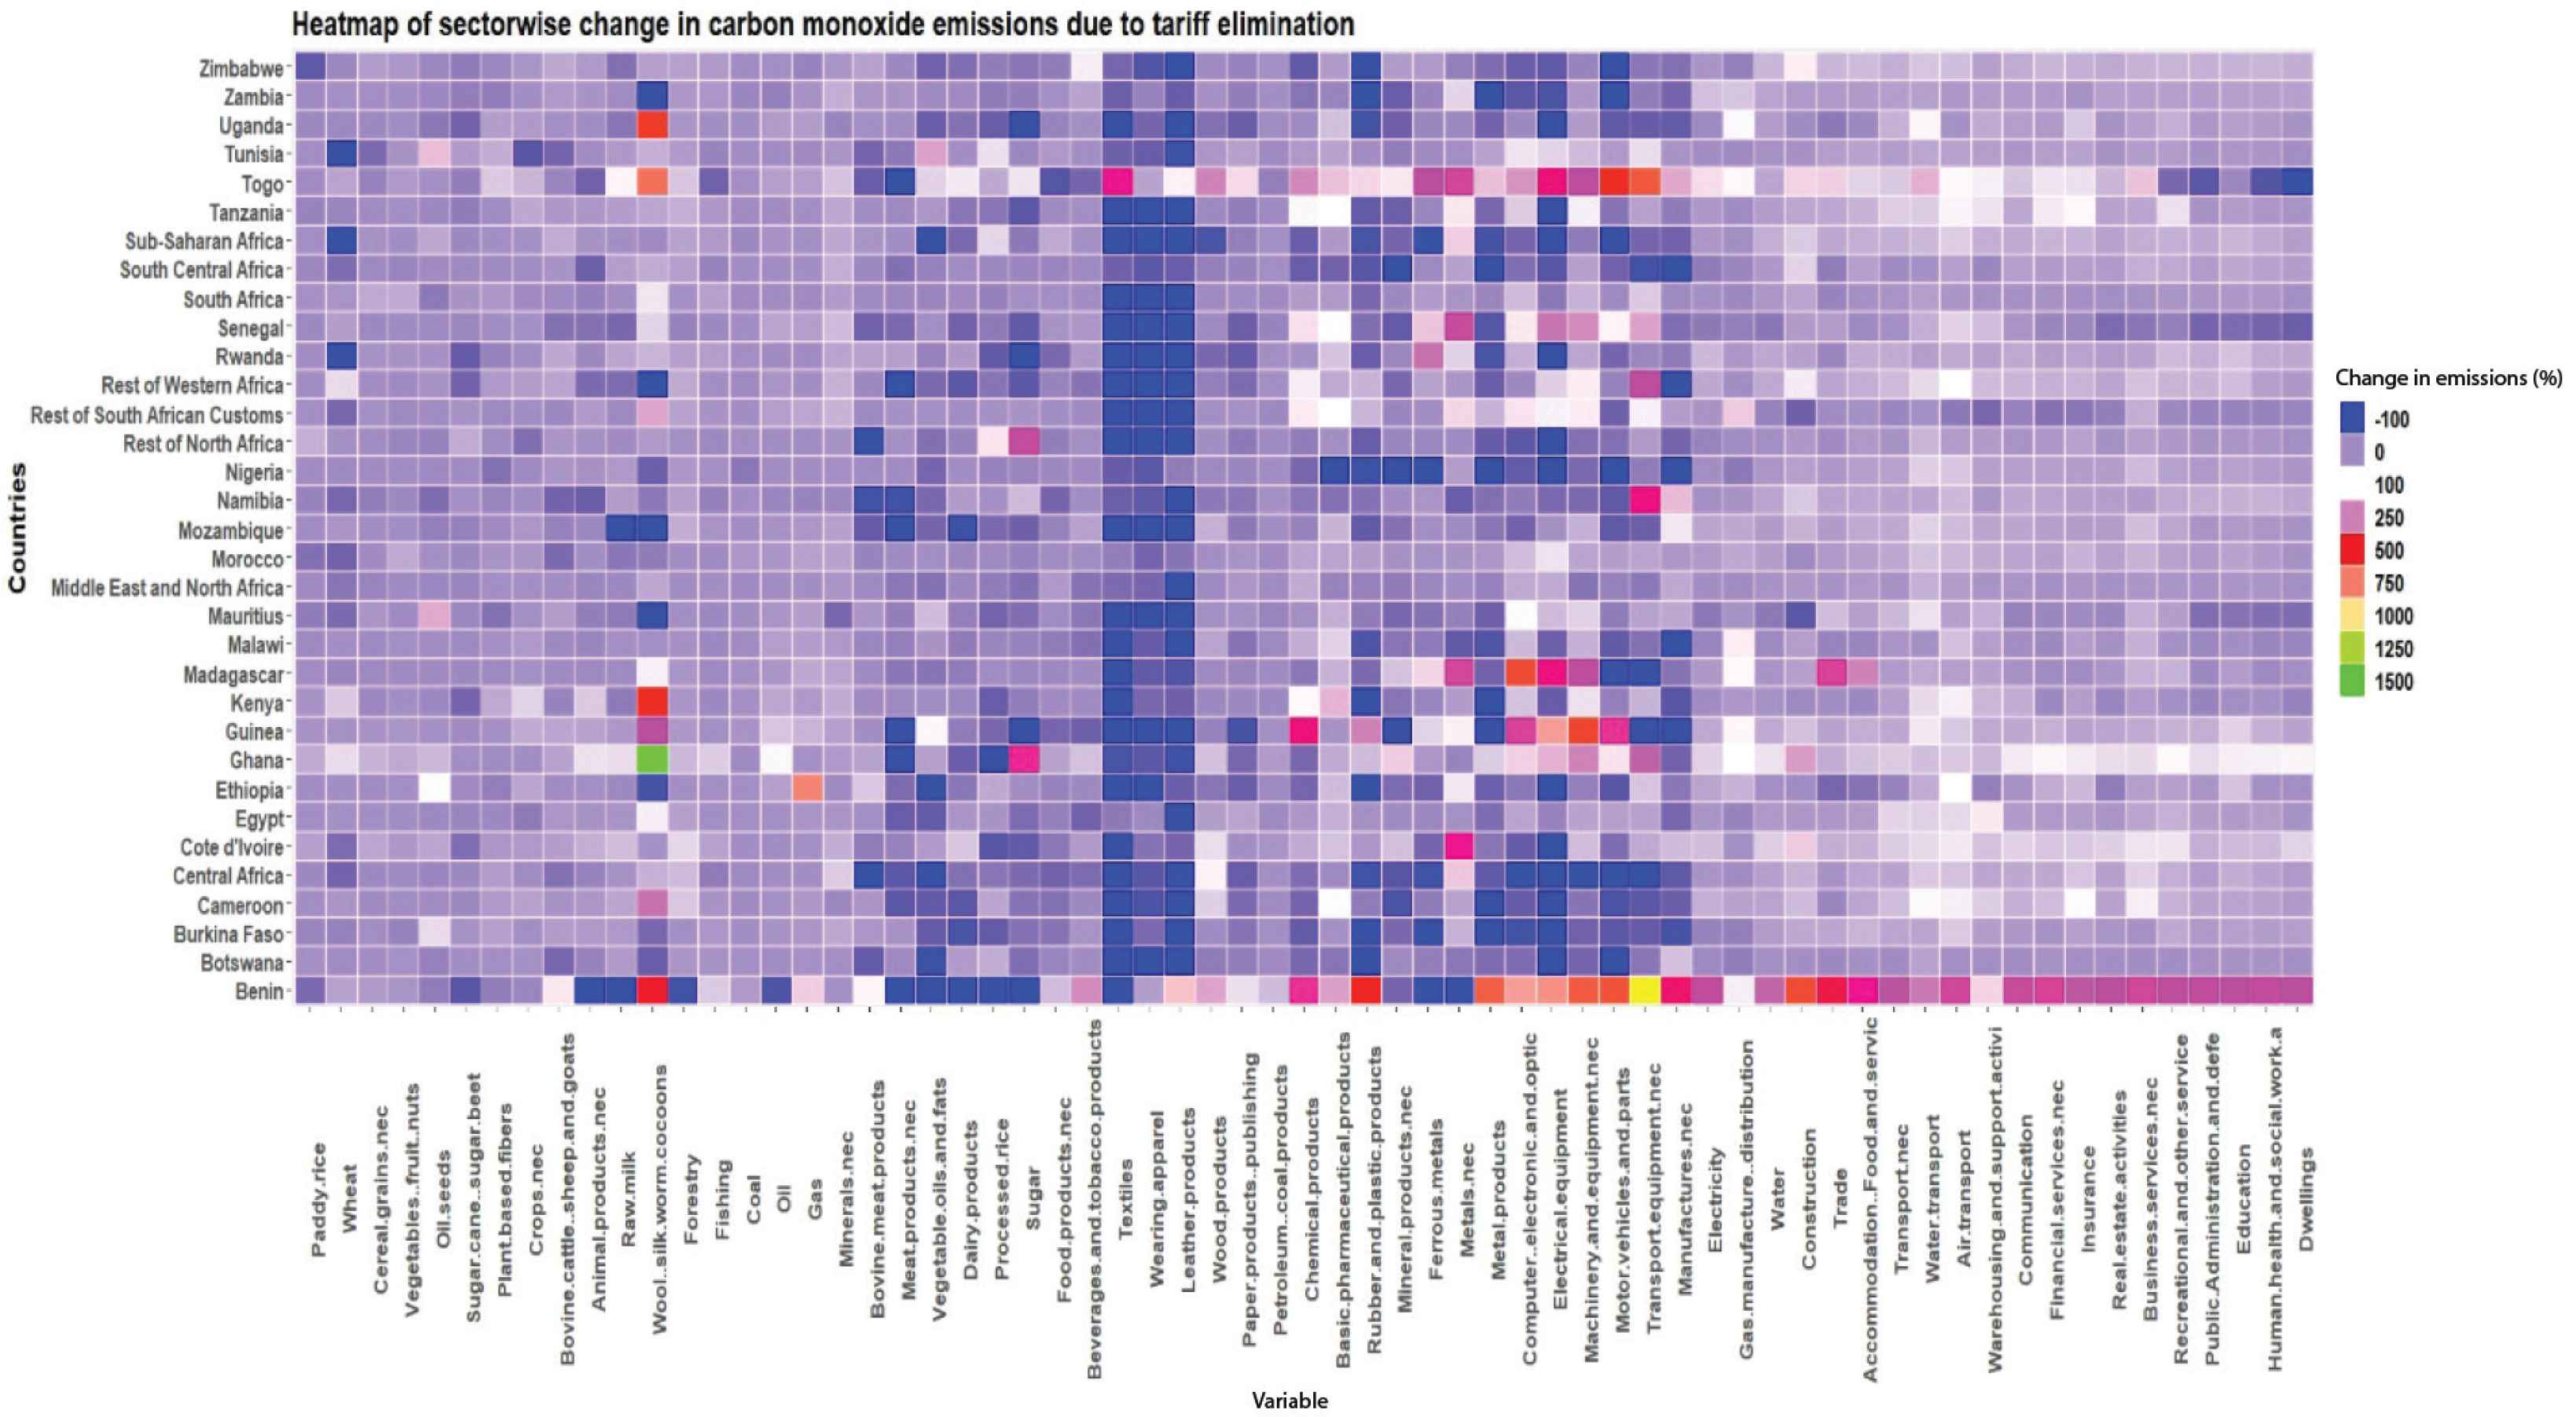
Heatmap 4. Source: Model results from the authors’ analysis.
5. CONCLUSION
In this study, we use the CGE model and a GTAP-based database for the 55 countries that are members of AfCFTA to estimate the macroeconomic and environmental impact of the trade agreement. From a macroeconomic – as well as from an environmental – perspective, the implementation of the agreement is estimated to induce mixed effects. Furthermore, the estimated impact of the agreement is shown to be heterogeneous across the continent. The analysis indicates that most African nations experience an increase in trade and GDP (except for Senegal and Mauritius) and significant employment creation effects. With respect to the environmental impacts, CO2 emissions are expected to increase marginally, while non-CO2 greenhouse gas (GHG) emissions increase significantly. By contrast, the implementation of the agreement is estimated to lead to a positive effect on air quality, stemming from decreased emissions of air pollutants.
From the analysis, we arrive at the following policy inferences. First, the findings of our study highlight the importance of conducting comprehensive environmental impact assessments of FTAs in general and AfCFTA in particular. Second, in AfCFTA, we find that the resulting increase in CO2 emissions is small, whereas the corresponding one for non-CO2 emissions is significant. These findings suggest that trade integration enhances production reallocation across sectors. In other words, the same trade policies that may lead to a large increase in non-CO2 emissions may result in marginal changes in CO2 emissions. Therefore, the overall impact of trade on GHGs is not obvious. This implies that, in addition to the trade integration, AfCFTA member countries should support each other in their efforts to reduce GHG emissions by investing in renewable energy infrastructure and work on environmentally sustainable practices and incentives, such as increasing trade in renewable energy equipment. Finally, the estimated reduction in air pollution indicates a potential trade-off among emissions, that is, activities that can increase GHG emissions may also decrease air pollutants. Reducing GHGs emissions is a desirable outcome of great significance in the context of global warming. The local impact of a reduction in air pollutants will have significant beneficial effects in the medium- to long-term in the majority of African countries. In that regard, policymakers can be satisfied with the potential positive impact on air quality resulting from this agreement.
CONFLICTS OF INTEREST
The authors declare they have no conflicts of interest.
AUTHORS’ CONTRIBUTION
MB and HN wrote the introduction, literature review, results and conclusions. SM analysed the results, wrote the methodology section and developed tables and charts. BN developed the model and ran the model simulations. All co-authors contributed to writing the whole paper.
FUNDING
There has been no funding for this study. The authors worked on their own schedule voluntarily.
ACKNOWLEDGMENT
We sincerely thank the anonymous reviewers and the editor for their comments.
APPENDIX
| No. | Endowment codes | Description |
|---|---|---|
| 1 | Land | Land |
| 2 | clerks | Clerks |
| 3 | service_shop | Service Shop |
| 4 | tech_aspros | Technicians and Associate Professionals |
| 5 | off_mgr_pros | Office Managers and Professionals |
| 6 | ag_othlowsk | Agricultural and Unskilled Workers |
| 7 | Capital | Capital |
| 8 | NatRes | Natural Resources |
Source: Own elaboration using GTAP Database.
Endowments as part of the model
| S.No. | Sector code | Description | S.No. | Sector code | Description |
|---|---|---|---|---|---|
| 1 | pdr | Paddy rice | 34 | bph | Basic pharmaceutical products |
| 2 | wht | Wheat | 35 | rpp | Rubber and plastic products |
| 3 | gro | Cereal grains NEC | 36 | nmm | Mineral products NEC1 |
| 4 | v_f | Vegetables, fruit, nuts | 37 | i_s | Ferrous metals |
| 5 | osd | Oil seeds | 38 | nfm | Metals NEC |
| 6 | c_b | Sugar cane, sugar beet | 39 | fmp | Metal products |
| 7 | pfb | Plant-based fibers | 40 | ele | Computer, electronic and optic |
| 8 | ocr | Crops NEC | 41 | eeq | Electrical equipment |
| 9 | ctl | Bovine cattle, sheep and goats | 42 | ome | Machinery and equipment NEC |
| 10 | oap | Animal products NEC | 43 | mvh | Motor vehicles and parts |
| 11 | rmk | Raw milk | 44 | otn | Transport equipment NEC |
| 12 | wol | Wool, silk-worm cocoons | 45 | omf | Manufactures NEC |
| 13 | frs | Forestry | 46 | ely | Electricity |
| 14 | fsh | Fishing | 47 | gdt | Gas manufacture, distribution |
| 15 | coa | Coal | 48 | wtr | Water |
| 16 | oil | Oil | 49 | cns | Construction |
| 17 | gas | Gas | 50 | trd | Trade |
| 18 | oxt | Minerals NEC | 51 | afs | Accommodation, Food and services |
| 19 | cmt | Bovine meat products | 52 | otp | Transport NEC |
| 20 | omt | Meat products NEC | 53 | wtp | Water transport |
| 21 | vol | Vegetable oils and fats | 54 | atp | Air transport |
| 22 | mil | Dairy products | 55 | whs | Warehousing and support activities |
| 23 | pcr | Processed rice | 56 | cmn | Communication |
| 24 | sgr | Sugar | 57 | ofi | Financial services NEC |
| 25 | ofd | Food products NEC | 58 | ins | Insurance |
| 26 | b_t | Beverages and tobacco products | 59 | rsa | Real estate activities |
| 27 | tex | Textiles | 60 | obs | Business services NEC |
| 28 | wap | Wearing apparel | 61 | ros | Recreational and other service |
| 29 | lea | Leather products | 62 | osg | Public Administration and defe |
| 30 | lum | Wood products | 63 | edu | Education |
| 31 | ppp | Paper products, publishing | 64 | hht | Human health and social work a |
| 32 | p_c | Petroleum, coal products | 65 | dwe | Dwellings |
| 33 | chm | Chemical products |
Source: Own elaboration using GTAP Database.
Sectors
| S. No. | Regions | S. No. | Regions |
|---|---|---|---|
| 1 | Australia, New Zealand | 22 | Uganda |
| 2 | East Asia | 23 | Zimbabwe |
| 3 | Southeast Asia | 24 | South Africa |
| 4 | South Asia | 25 | Senegal |
| 5 | North America | 26 | Guinea |
| 6 | Latin America | 27 | Benin |
| 7 | European Union 28 | 28 | Burkina Faso |
| 8 | Rest of North Africa | 29 | Cameroon |
| 9 | Morocco | 30 | Cote d’Ivoire |
| 10 | Tunisia | 31 | Togo |
| 11 | Egypt | 32 | Ethiopia |
| 12 | Middle East and North Africa | 33 | Madagascar |
| 13 | Ghana | 34 | Malawi |
| 14 | Nigeria | 35 | Mauritius |
| 15 | Rest of Western Africa | 36 | Zambia |
| 16 | Central Africa | 37 | Botswana |
| 17 | South Central Africa | 38 | Namibia |
| 18 | Kenya | 39 | Rest of South African Customs |
| 19 | Mozambique | 40 | Sub-Saharan Africa |
| 20 | Rwanda | 41 | Rest of World |
| 21 | Tanzania |
Source: Own elaboration using GTAP Database.
Countries that have signed and ratified ACFTA. Region/Countries included in the GTAP model
Footnotes
For a list of countries that have ratified the AfCFTA agreement and updates, check https://www.africancfta.org/.
The AfCFTA is set to be implemented in phases, some of which are still under negotiation. Both the implementation and negotiation schedules for the agreement have been delayed due to the COVID-19 pandemic.
Countries can implement tariff reductions over a longer period for 7% of tariff lines. They can maintain existing tariffs for the remaining 3% of tariff lines if the value of trade under the remaining 3% does not exceed 10% of the total trade within Africa.
For an overview of overall set ups and outcome of the AfCFTA CGE modelling simulations, see Abrego et al. (2019).
In the static set up, changes in demand will lead to changes in prices, that is, wages and return to investments, which in turn causes production factors to move between sectors within the economy – from less to more profitable – stemming from policy induced changes.
Our estimation results are in line to those obtained by Chauvin et al. (2016) and Saygili et al. (2018). However, in our study neither the underlying data nor the underlying assumptions or model structures are identical to previous analysis, which helps to explain the nuance in results.
Fine PM ≤2.5 μm in diameter.
This study is based on the Asia-Pacific Integrated Model/CGE country model, simulating the period between 1997 and 2020.
The EKC depicts a hypothesized relationship between various indicators of environmental degradation and income per capita, based on the hypothesis that economic development first leads to a deterioration of the environment and subsequently to an improvement.
Burkina Faso is one of the poorest nations in the world. Its exports mainly consist of primary goods like cotton and metals. Trade liberalization in the African continent would lead to the exports of Burkina Faso being uncompetitive and lead to a significant.
Togo is estimated to experience an 8.2% increase in GDP. Its geographic position places it as an important country for transit trade through the Autonomous Port of Lome and two international airports.
In relative terms, the increase is larger than the absolute figures for Benin, as this economy functions as a transit country for the transport of goods to and from Niger, Burkina Faso, Mali, Chad, and Nigeria through the Port of Cotonou.
The term non-CO2 emissions comprise CH4, N2O, and FAGS. CH4 is emitted during the production and transport of coal, natural gas, and oil. CH4 emissions also result from livestock and other agricultural practices and by the decay of organic waste in municipal solid waste landfills. N2O is emitted during agricultural and industrial activities, combustion of fossil fuels, and solid waste, as well as during the treatment of wastewater.
The simulations done for additional air pollutants, such as ammonia emissions, non-CH4 volatile organic compounds (short cycle), non-CH4 volatile organic compounds (long cycle), nitrogen oxide gases, and PM of 10 and 2.5 µm are available under request.
Data availability statement: The data that support the findings of this study are available from the corresponding author [BN], upon reasonable request.
NEC (Not Elsewhere Classified)
REFERENCES
Cite this article
TY  - JOUR
AU  - Marta Bengoa
AU  - Somya Mathur
AU  - Badri Narayanan
AU  - Hanna C. Norberg
PY  - 2021
DA  - 2021/07/30
TI  - Environmental Effects of the African Continental Free Trade Agreement: A Computable General Equilibrium Model Approach
JO  - Journal of African Trade
SP  - 36
EP  - 48
VL  - 8
IS  - 2 (Special Issue)
SN  - 2214-8523
UR  - https://doi.org/10.2991/jat.k.210719.001
DO  - 10.2991/jat.k.210719.001
ID  - Bengoa2021
ER  -