
Association between the Human Development Index and Millennium Development Goals 6 Indicators in Sub-Saharan Africa from 2000 to 2014: Implications for the New Sustainable Development Goals
- DOI
- 10.2991/j.jegh.2018.09.001How to use a DOI?
- Keywords
- MDGs; HDI; HIV/AIDS; TB; malaria
- Abstract
It is important to assess whether regional progress toward achieving the millennium development goals (MDGs) has contributed to human development and whether this has had an effect on the triple burden of disease in the continent. This analysis investigates the association between the human development index (HDI) and co-occurrence of HIV/AIDS, tuberculosis (TB), and malaria as measured by MDG 6 indicators in 35 selected sub-Saharan African countries from 2000 to 2014. The analysis used secondary data from the United Nations Development Programme data repository for HDI and disease data from WHO Global Health observatory data repository. Generalized Linear Regression Models were used to analyze relationships between HDI and MDG 6 indicators. HDI was observed to improve from 2001 to 2014, and this varied across the selected sub-regions. There was a significant positive relationship between HDI and HIV prevalence in East Africa (β = 0.048 [95% CI: 0.040–0.056], p < 0.001) and Southern Africa (β = 0.032 [95% CI: 0.002–0.062], p = 0.034). A significant positive relationship was observed with TB incidence (β = 0.009 [95% CI: 0.003–0.015], p = 0.002) and a significant negative relationship was observed with malaria incidence (β = −0.020 (95% CI: −0.029 to −0.010, p < 0.001) in East Africa. Observed improvements in HDI from the year 2000 to 2014 did not translate into commensurate progress in MDG 6 goals.
- Copyright
- © 2018 Atlantis Press International B.V.
- Open Access
- This is an open access article under the CC BY-NC license (http://creativecommons.org/licences/by-nc/4.0/).
1. INTRODUCTION
Globally, HIV/AIDS, tuberculosis (TB), and malaria (the three together termed as ATM) are three major public health challenges that undermine development in low- and middle-income countries [1]. Sub-Saharan Africa (SSA) is the region most affected by ATM. In 2013, SSA had an estimated 1.5 million new infections and remains the region most affected by HIV/AIDS [1]. Africa also carries a large burden TB with 28% of the approximately 9.6 million new TB cases and the highest rates of deaths reported in 2014 [2]. Of about 214 million malaria cases and 438,000 deaths reported globally in 2014, an estimated 88% of these occurred in Africa [3].
The coincident distribution of ATM is recognized as most pervasive and deadly in the context of substantial social and economic challenges and poses a threat to the development of African households, communities, and nations [4]. Likewise, poor economic growth or development is also an underlying driver of poor health and increased disease risk [5]. Alleviating poverty, halting the spread of HIV/AIDS, and promoting sustainable development are some of the aspects that formed the core focus of the 2000 United Nations Millennium declaration, which saw 189 countries signing the declaration as a means to better the lives of people living in low- and middle-income countries [6].
Of the eight millennium development goals (MDGs), MDG 6 focused on reducing the triple burden of disease closely linked to human well-being and development [6,7]. The 2015 target date for MDGs has been reached, and even though most countries in the continent did not meet the MDG targets, progress made since the inception of the MDGs has laid the foundation for the implementation of the post-2015 agenda, the new period of sustainable development goals (SDGs). It is important therefore to assess whether regional progress toward achieving the MDGs has contributed to human development and whether this has had an effect on the triple burden of ATM in sub-Saharan Africa.
The human development index (HDI) is a summary measure of the major dimensions of human development including mean achievement or progress in three basic indices including (health) a long and healthy life, (education) access to knowledge, and (income) decent standard of living [8]. Since its launch in 1990, the HDI has been an important marker in attempts to measure human progress at the local, national, and regional levels [9]. Increase or improvement in the HDI has been shown to be associated with a decrease or lower disease incidence in HIV [10], TB [11], and malaria [12].
This analysis investigated the association between the development status as measured by the HDI and co-occurrence of ATM as measured by MDG 6 indicators in four SSA sub-regions (made up of Central, Eastern, Western, and Southern Africa) from the year 2000 to 2014.
2. METHODS
2.1. Data and Selected Countries
Only secondary data has been used in the study. All data used were at 5 year intervals from 2000 to 2014 and were based on the availability of HDIs. The selection of countries was based on the completeness of data based on the HDI and ATM data. A total of 35 countries selected were grouped into four sub-regions: Western Africa (Benin, Burkina Faso, Cameroon, Cote d’Ivoire, Gambia, Ghana, Guinea, Guinea Bissau, Liberia, Mali, Mauritania, Nigeria, Senegal, Sierra Leone, and Togo), Central Africa (Burundi, Central African Republic, Chad, Congo DRC, Republic of the Congo, and Rwanda), Eastern Africa (Eritrea, Ethiopia, Kenya, Tanzania, and Uganda), and Southern Africa (Angola, Botswana, Lesotho, Namibia, Malawi, Mozambique, South Africa, Swaziland, Zambia, and Zimbabwe).
2.2. Human Development Index
The three dimensions of HDI, namely, a long and healthy life, knowledge, and decent standard of living are computed on some basic parameters such as life expectancy, adult literacy rate, and gross enrolment ratios and income dimension measured in terms of per capita income [8]. The geometric mean of the three indices is the value of HDI. The methodology of computing HDI is described in detail by the United Nations Development Programme (UNDP) (http://hdr.undp.org/en/content/human-development-index-hdi).
Globally, according to the HDI, countries are divided into four categories: very high HDI (≥0.80), high HDI (0.80 > HDI > 0.710), medium HDI (0.710 ≥ HD ≥ 0.535), and low HDI (<0.535), and countries in sub-Saharan Africa fall within the medium to low HDI category [8]. All HDI data were collated from The UNDP data repository (http://hdr.undp.org/en/data).
2.3. ATM and Population Estimates
HIV prevalence (all ages) was estimated from the number of people living with HIV in the population expressed as a percentage. The TB cases used were the estimated number of recent and relapse TB cases reported within the specified year, given as the rate per 100,000 population collated from national surveillance systems. Malaria cases included both unconfirmed cases as well as cases confirmed by microscopy. Malaria case data used were gathered from the national surveillance data, and in high transmission areas with limited health service data, but with good data the number of cases was estimated from parasite prevalence. Malaria incidence was calculated as the number of new cases per 100,000 person years. The total population was estimated from census reports and other statistical publications. All data were obtained from the WHO Global Health observatory data repository (http://apps.who.int/gho/data/node.main).
2.4. Statistical Analysis
Descriptive statistics were used to summarize the data by year and sub-region. For each sub-region (Central, East, Southern, and West Africa), the mean HDI, HIV prevalence and TB and malaria incidence rates for each year were calculated. The mean differences between years 2000 and 2014 were then calculated for each of the above. Generalized Linear Regression Models with year as a covariate and robust standard errors were used to analyze the association between dependent variable HDI and independent variables of the MDG 6 indicators (HIV prevalence, TB, and malaria incidence). The models use random effects as surrogates for unmeasured factors influencing HDI, and coefficient plots of the regression models are presented (http://econpapers.repec.org/paper/bsswpaper/1.htm). Statistically significant results are reported with 95% confidence intervals and a p-value <0.05. Data were analyzed using STATA 13.0 software (Stata Corp, College Station, TX, USA).
3. RESULTS
All the sub-regions depicted a steady increase in HDI overtime with Southern Africa having the highest rating followed by East, West, and Central Africa (Figure 1). HIV prevalence was relatively stable across the study period with Southern Africa having the highest prevalence whereas other sub-regions displayed a slight decline in HIV prevalence over time. Overall, there was a decline in TB incidence over time, but the incidence was higher in Southern Africa and West Africa and lower in Central and East Africa. Conversely, there was an exponential increase in malaria incidence over time in Central Africa, followed by West, Southern and East Africa.
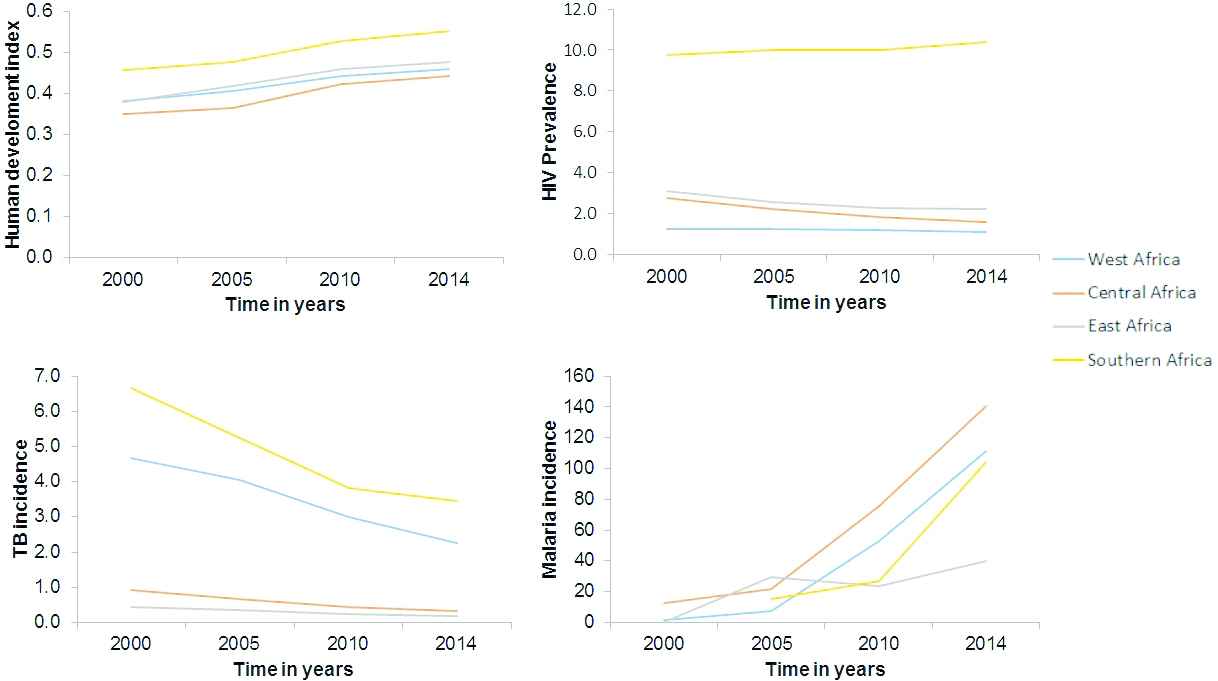
Distribution of the human development index (HDI), HIV prevalence, TB per 100,000 population and malaria incidence per 1000 person years at 5 years interval from 2000 to 2014 by sub-region in sub-Saharan Africa
Table 1 presents the summary statistics for all variables included in the analysis. In agreement with the observed trend, there was a positive change in HDI between 2000 and 2014 across all sub-regions. Between 2000 and 2014, HIV prevalence declined by −0.14 in West Africa, −1.18 in Central Africa, −0.90 in East Africa, and rose by 0.60 in Southern Africa. TB incidence declined by −2.39 in West Africa, −0.62 in Central Africa, −0.24 in East Africa, and −3.20 in Southern Africa; whereas, malaria incidence increased by 109.13 in West Africa, 127.54 in Central Africa, 39.43 in East Africa, and 97.80 in Southern Africa.
| 2000 | 2005 | 2010 | 2014 | Mean difference (2000–2014) | |||||
|---|---|---|---|---|---|---|---|---|---|
| Mean | SD | Mean | SD | Mean | SD | Mean | SD | ||
| Western Africa | |||||||||
| Human development index | 0.38 | 0.06 | 0.41 | 0.06 | 0.44 | 0.05 | 0.46 | 0.05 | 0.08 |
| HIV prevalence | 1.23 | 0.72 | 1.27 | 0.67 | 1.19 | 0.67 | 1.09 | 0.63 | −0.14 |
| Tuberculosis incidence | 4.66 | 9.31 | 4.04 | 8.97 | 3.01 | 6.42 | 2.27 | 4.30 | −2.39 |
| Malaria incidence | 1.89 | 1.82 | 7.24 | 9.96 | 52.64 | 69.16 | 111.03 | 91.07 | 109.13 |
| Central Africa | |||||||||
| Human development index | 0.35 | 0.07 | 0.36 | 0.09 | 0.42 | 0.07 | 0.44 | 0.09 | 0.09 |
| HIV prevalence | 2.76 | 1.67 | 2.24 | 1.15 | 1.84 | 0.94 | 1.58 | 0.84 | −1.18 |
| Tuberculosis incidence | 0.93 | 0.90 | 0.67 | 0.61 | 0.43 | 0.38 | 0.31 | 0.26 | −0.62 |
| Malaria incidence | 12.88 | 18.53 | 21.96 | 30.70 | 75.49 | 76.21 | 140.41 | 146.84 | 127.54 |
| East Africa | |||||||||
| Human development index | 0.38 | 0.07 | 0.42 | 0.06 | 0.46 | 0.06 | 0.48 | 0.06 | 0.10 |
| HIV prevalence | 3.11 | 1.91 | 2.59 | 1.61 | 2.27 | 1.53 | 2.21 | 1.59 | −0.90 |
| Tuberculosis incidence | 0.43 | 0.54 | 0.35 | 0.49 | 0.23 | 0.29 | 0.19 | 0.22 | −0.24 |
| Malaria incidence | 0.52 | – | 29.83 | 31.89 | 23.78 | 15.52 | 39.95 | 38.30 | 39.43 |
| Southern Africa | |||||||||
| Human development index | 0.46 | 0.10 | 0.48 | 0.09 | 0.53 | 0.09 | 0.55 | 0.09 | 0.09 |
| HIV prevalence | 9.77 | 4.96 | 10.02 | 4.81 | 10.02 | 5.07 | 10.37 | 5.19 | 0.60 |
| Tuberculosis incidence | 6.66 | 11.46 | 5.23 | 8.19 | 3.82 | 5.69 | 3.45 | 4.58 | −3.20 |
| Malaria incidence | – | – | 15.40 | 23.46 | 26.73 | 35.33 | 104.00 | 113.20 | 97.80 |
Summary statistics of the human development index, HIV prevalence, TB incidence per 100,000 population and malaria incidence per 1000 person years in four sub-Saharan African sub-regions from the year 2000 to 2014
Figure 2 shows coefficient plot of the best fitting Generalized Linear Regression Models (p < 0.001) for the association of HIV prevalence, TB incidence, and malaria incidence with HDI in four sub-Saharan African sub-regions from year the 2000 to 2014. The models show that in West Africa there was a significant positive trend in HDI only in 2010 (β = 0.076 [95% CI: 0.031–0.121], p = 0.001) and 2014 (β = 0.103 [95% CI: 0.054–0.151], p < 0.001), and this showed a partially significant negative relationship only with malaria incidence (β = −0.009 [95% CI: −0.019–0.001], p = 0.074]. In Central Africa, the observed positive trend in HDI was not statistically significant nor was its relationship with the three diseases. In East Africa, there was a significant positive trend in HDI in 2005 (β = 0.090 [95% CI: 0.054–0.126], p < 0.0001), 2010 (β = 0.176 [95% CI: 0.132–0.220], p < 0.001) and 2014 (β = 0.207 [95% CI: 0.157–0.256], p < 0.0001). This trend had a significant positive relationship with HIV prevalence (β = 0.048 [95% CI: 0.040–0.056] p < 0.001) and TB incidence (β = 0.009 [95% CI: 0.003–0.015], p = 0.002], and a significant negative relationship with malaria incidence (β = −0.020 [95% CI: −0.029 to −0.010, p < 0.001). In Southern Africa, a significant positive trend in HDI was only observed in 2014 (β = 0.110 [95% CI: 0.014–0.205], p = 0.024), and this showed a significant positive relationship only with HIV prevalence (β = 0.032 [95% CI: 0.002–0.062], p = 0.034).
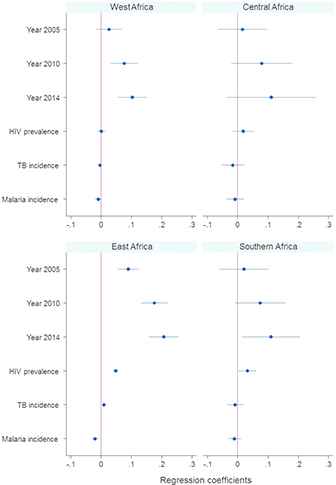
Generalized Linear Regression Models for the association of HIV prevalence, TB incidence per 100,000 population and malaria incidence per 1000 person years with the HDI in four sub-Saharan African sub-regions from the year 2000 to 2014
4. DISCUSSION
The increasing trend in HDI from 2001 to 2014 varied across different sub-regions with different levels of development as measured by HDI. The observed trend coincided with the period characterized by MDG investment in the continent and other developing regions. The analysis of the relationship between HDI and the selected MDG 6 indicators varied considerably across the sub-regions. This probably reflects different government spending priorities for ATM, which varies considerably in the SSA region [13,14].
The positive relationship between HDI and HIV prevalence in East Africa and Southern Africa may be due to the increased investment on antiretroviral treatment, reduced number of deaths, and rise in HIV prevalence in countries in these sub-regions [15]. However, of great concern is the continued high number of new HIV infections [15]. Contrarily, HIV has been less of a problem in West and Central Africa. In these sub-regions, a lot of the MDG 6 investment focused on combating malaria, which is a major public health problem [3]. Elsewhere, evidence shows that low HDI countries have higher HIV/AIDS mortality, prevalence, and incidence rates than medium-, high-, and very high-HDI countries [16].
However, the observed relationship between HDI and TB incidence in East Africa may be due the genuine rise in TB regardless of the noted improvement in HDI. This may be due to poor access, delivery, and coverage of TB health services [13]. In addition, the poor state of health systems in most countries in Africa also prevents effective interventions from reaching those in greatest need, even where resources are available [13,17,18]. In other developing regions, socioeconomic conditions and health system development have also been shown to have a significant effect on the control of TB [19].
Furthermore, the only significant inverse relationship between HDI and malaria incidence was observed mainly in East Africa. Evidence shows that the probability of dying from malaria in sub-Saharan countries is inversely related to the HDI [12]. This means that in the absence of socioeconomic development, failure to maintain the insecticide and drug pressure against the vector and the parasite would lead to the goals not being met and the disease resurging with dire consequences [20].
5. LIMITATIONS
The current analysis has limitations that require careful consideration in the interpretation of the results. Given the fact that the global disease databases are drawn from collating data from various sources, data may be of uneven quality. For example, many African countries simply have no adequate TB surveillance and control system in place. Similarly, malaria cases are less reliable especially in large parts of Africa, where malaria is either hyperendemic or holoendemic and cases are often asymptomatic even with parasitemia due to acquired partial immunity. Under such conditions fevers are often diagnosed (if at all) as malaria by default due to lack of appropriate diagnostic facilities.
Furthermore, pooled sub-regional analysis masks the between and within individual countries differences. In addition, there are many potential sources of uncertainty associated with unobserved or unmeasured variables that can bias the results. Inequality in healthcare has been regarded as a major cause of variation in the effectiveness of interventions [13], including differences in governance, financing, and spending on health priorities and delivery of quality health services [13,14]. The HDI measures average well-being in a country, but not the disparities between different regions or groups within a country, which are sometimes vast [8,9].
6. CONCLUSION
The findings revealed that although there was a steady rise in HDI from 2001 to 2011, this did not translate into a commensurate progress in MDG 6 across the selected sub-regions. This indicates that progress on MDG 6 in the fight against the triple disease burden is more than a consequence of development as measured by HDI. Socioeconomic inequalities in healthcare have been suggested as a major cause of variation in the effectiveness of interventions, which may have had implications for measuring and monitoring progress of MDGs in SSA [13]. Given the varying levels of socioeconomic development between and within the sub-regions, causes of health inequalities would vary depending on the level of development. There is a need for studies of multidimensional approaches that measure human development and capture sub-regional disparities in socioeconomic inequalities to effectively monitor the progress of the new SDGs across the continent.
COMPETING INTERESTS
The authors declare that they have no competing interest.
AUTHOR CONTRIBUTIONS
MLHM conceived, designed, and analyzed the data. MLHM and ZTP drafted the manuscript. MS, SG, ZLMK, and ML made significant intellectual input and provided critical feedback on several drafts. All authors read and approved the final manuscript.
REFERENCES
Cite this article
TY  - JOUR
AU  - MLH Mabaso
AU  - TP Zama
AU  - L Mlangeni
AU  - S Mbiza
AU  - ZL Mkhize-Kwitshana
PY  - 2018
DA  - 2018/12/31
TI  - Association between the Human Development Index and Millennium Development Goals 6 Indicators in Sub-Saharan Africa from 2000 to 2014: Implications for the New Sustainable Development Goals
JO  - Journal of Epidemiology and Global Health
SP  - 77
EP  - 81
VL  - 8
IS  - 1-2
SN  - 2210-6014
UR  - https://doi.org/10.2991/j.jegh.2018.09.001
DO  - 10.2991/j.jegh.2018.09.001
ID  - Mabaso2018
ER  -