
Magnitude and determinants of adverse treatment outcomes among tuberculosis patients registered under Revised National Tuberculosis Control Program in a Tuberculosis Unit, Wardha, Central India: A record-based cohort study
- DOI
- 10.1016/j.jegh.2017.02.002How to use a DOI?
- Keywords
- DOTS; Survival probability; Treatment adherence; Treatment outcomes
- Abstract
Introduction: Deaths, defaults, relapses, and treatment failures have made the control of TB difficult across the globe.
Methodology: This study is a record-based follow-up of a cohort of patients registered under Revised National Tuberculosis Control Program in the year 2014 in Wardha Tuberculosis Unit, India. Data was collected from the records available at the District Tuberculosis Office.
Results: Data of 510 patients was analyzed. The sputum conversion rate was 88%. The overall treatment success rate was 81.9%, and rates of any adverse outcome, deaths, defaults, failure, and shift to Category IV regimen were 32.60/100 person years at risk (PYAR), 16.88/100 PYAR, 11.12/100 PYAR, 3.45/100 PYAR, and 1.15/100 PYAR, respectively. The median times for the above outcomes were 81 days, 110 days, 66 days, 118 days, and 237 days, respectively. The cumulative probability of occurrence at 6 months of any adverse outcome, deaths, default, failure, and shift to Category IV regimen was 0.145, 0.056, 0.088, 0.002, and 0.004, respectively. On multivariate analysis, the determinant of any adverse outcome was age >45 years, whereas extrapulmonary disease was protective. The hazard of defaulting was also significantly higher in male patients and those aged >45 years.
Conclusion: Appropriate interventions and program implementation to reduce the adverse treatment outcomes and interruptions will help in improving program performance.
- Copyright
- © 2017 Ministry of Health, Saudi Arabia. Published by Elsevier Ltd.
- Open Access
- This is an open access article under the CC BY-NC-ND license (http://creativecommons.org/licenses/by-nc-nd/4.0/).
1. Introduction
The number of tuberculosis (TB)-related deaths is unacceptably large in India as most of them are preventable only if access to health care is improved for diagnosis and appropriate treatment is provided [1]. In India, approximately 5–8% of TB patients die every year [2]. The Revised National Tuberculosis Control Program (RNTCP) was launched nationwide in 1997 to bring the disease under control by means of reliable diagnosis and free uninterrupted drug supply. The National Strategic Plan 2012–17 aims to achieve a 90% success rate in new cases and 85% in re-treatment cases [3].
The death rates are higher among re-treatment cases of TB. The failure rate is also high among re-treatment cases [2]. New cases have a higher survival rate than re-treatment cases by the time of treatment completion [4]. Defaulting from treatment is associated with drug resistance [5] which in turn is associated with lower treatment success rates (TSRs), higher adverse treatment outcomes [6], and higher mortality [7].
Despite the efforts of RNTCP, TSR still lags in the targets of National Strategic Plan. Thus, it becomes imperative to understand the magnitude and the determinants of adverse treatment outcomes so that appropriate corrective measures can be planned based on local epidemiology. Therefore, the present study was conducted to study the magnitude and determinants of adverse treatment outcome in TB patients treated under RNTCP in Wardha Tuberculosis Unit (TU), Central India.
2. Methodology
2.1. Study setting
The present study was a record-based follow-up of a cohort of all the patients registered under RNTCP in 2014. The study was conducted in Wardha TU. Wardha is a district in Central India, with a population of about 1.3 million and 32% of its population residing in urban areas. It has a sex ratio of 946 females per 1000 males. The district has three TUs spanning across eight administrative blocks [8].
2.2. Data collection
We extracted the data of all the patients registered under RNTCP in 2014 from the District TB office. Along with Nikshay software, the TB register was also checked to fill any missing data. The data for each patient was recorded at the time of registration routinely under the program by the program staff. For patients who were registered more than once in the year for treatment due to default (n = 3), relapse (n = 2), or treatment failure (n = 1), only the first instance was considered, and the rest were excluded from the study to rule out the possibility of bias due to duplication of some of the baseline characteristics (Fig. 1). The treatment outcomes of patients and the time of treatment outcome were determined according to RNTCP definitions [9]. We classified the area of residence using census definitions [8].
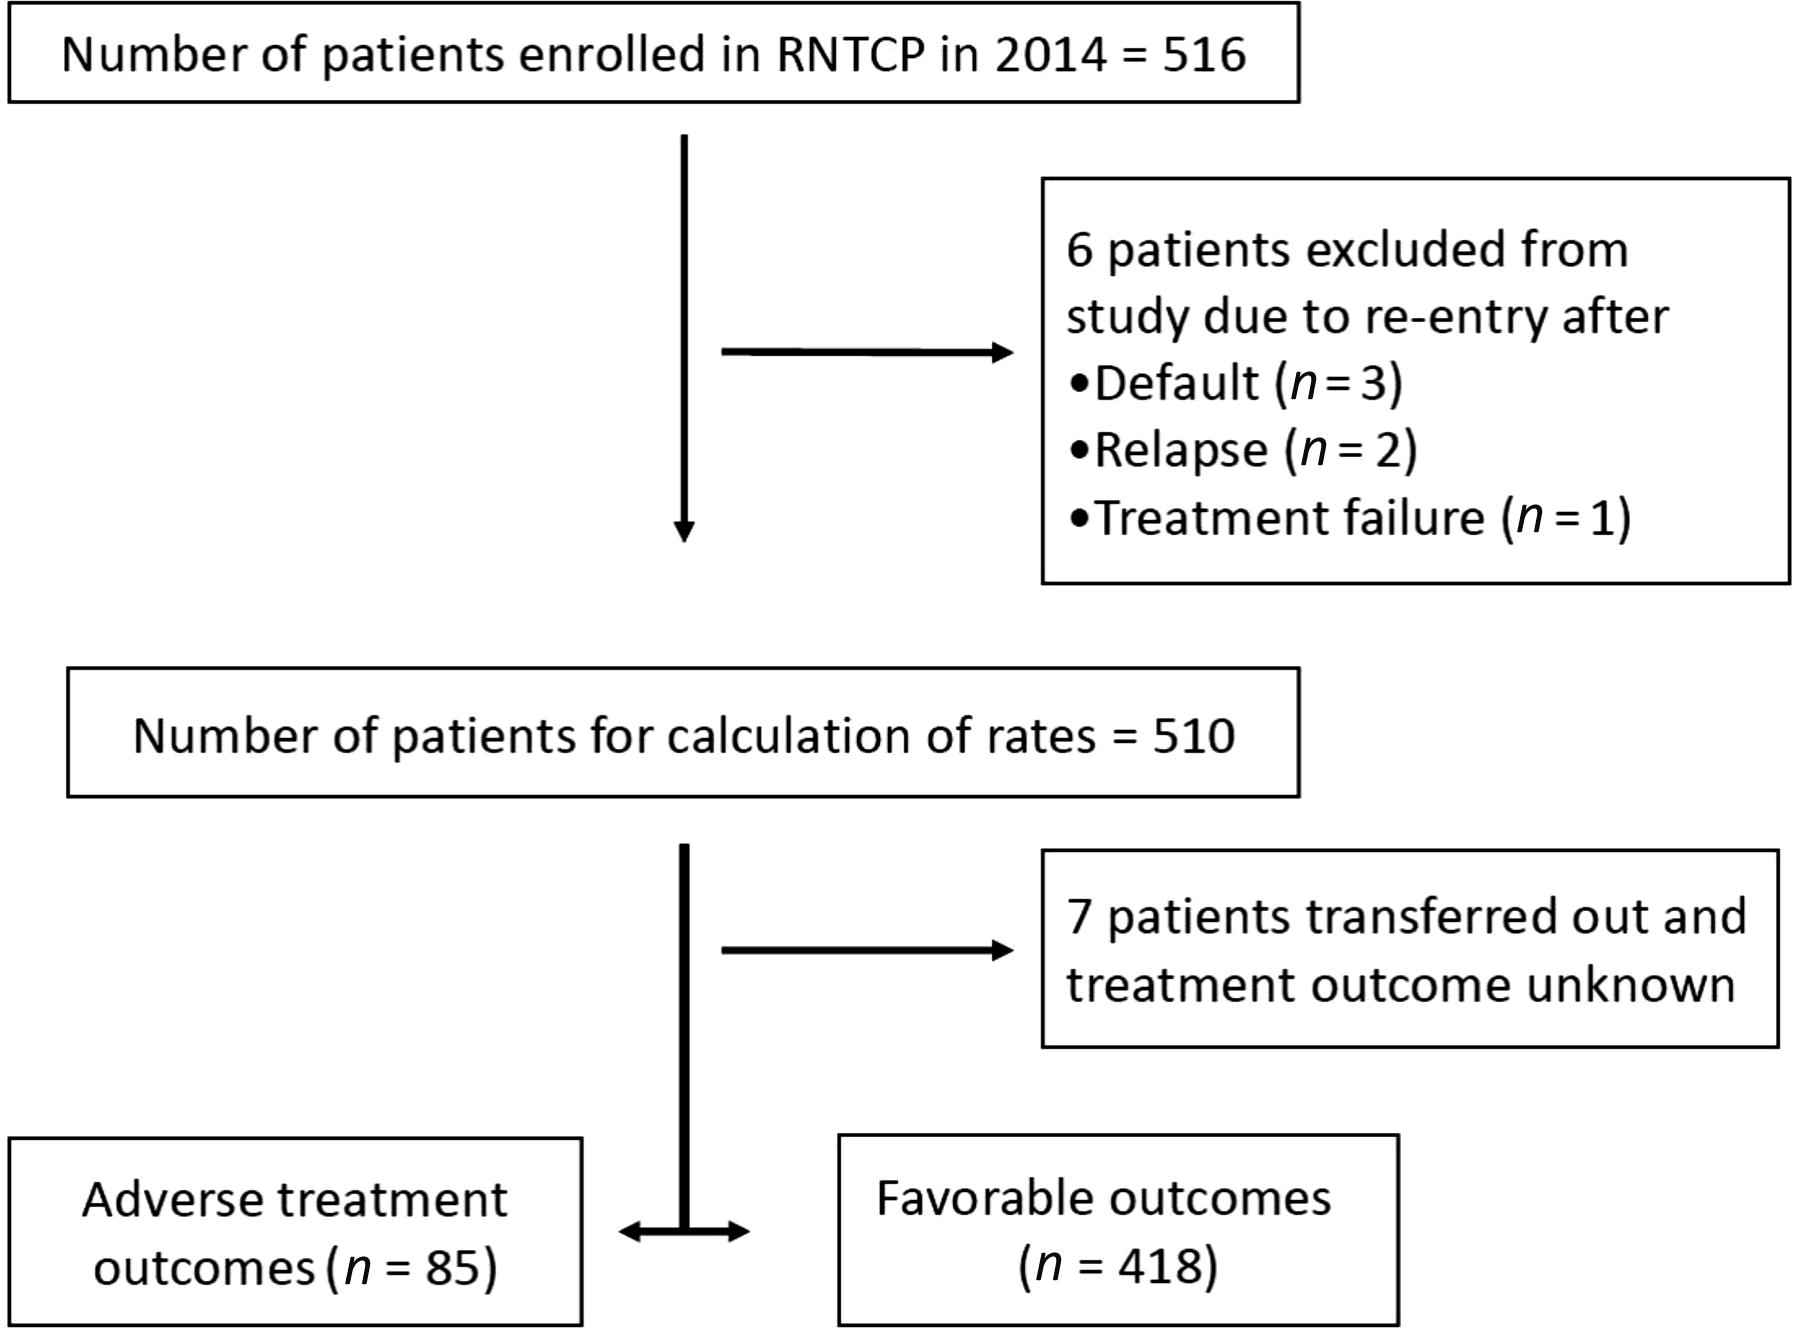
A flowchart of study patients. RNTCP = Revised National Tuberculosis Control Program.
2.3. Data management and analysis
Data was analyzed using SPSS version 12.0 (IBM SPSS Inc., Chicago, IL, USA). The characteristics of patients were expressed as frequencies (%) and median [95% confidence interval (CI)]. Kaplan–Meier survival analysis was performed to estimate the survival probabilities of the patients. The end point studied was the adverse treatment outcomes (defaults, deaths, treatment failures, shift to Category IV) recorded under the RNTCP. Incidence rates, rate ratios, and their 95% CIs were calculated individually using OpenEPI version 3.01 (The OpenEpi project, Atlanta, Georgia) to evaluate the risk factors (age, sex, site of illness, category of treatment initiation, HIV, diabetes and area of residence). Multivariate analysis using the Cox proportional hazard regression models was performed to calculate hazard ratios (HRs) and their 95% CIs. All the variables were included in the model. Proportional hazards assumption was tested using log minus log plot, and the assumption of proportionality was met.
Ethical approval was obtained from the Institutional Ethics Committee, MGIMS, Sewagram before conducting the study (Approval No. MGIMS/IEC/COMMED/68/2014).
3. Results
A total of 516 patients were registered under RNTCP in 2014 in the TU. Six patients were excluded as they were registered twice in the program. Finally, 510 patients were included for analysis.
3.1. Study patients
The baseline characteristics of the patients are described in Table 1. About 37% patients were aged <30 years, and about 18% patients were aged ≥60 years. Also, 63% of the patients were men. Patients were approximately distributed equally across urban and rural areas. Furthermore, 77% patients had experienced TB for the first time. Of the remaining patients who had TB more than once, relapse and re-treatment others cases comprised about 10% each of the total patients, followed by a small proportion of treatment after default cases (2.4%) and treatment failure cases (0.2%). About 75% patients had pulmonary TB of which 233 (45.7%) patients were sputum positive. Additionally, 6.9% and 2.4% patients were known to be suffering from HIV and diabetes, respectively. Of the successfully treated patients, after excluding those whose regimens were prolonged due to smear positivity at the end of intensive phase (IP), we found that none of the patients completed their treatment on the expected date. In Category I, about 72.5%, 16.8%, and 10.7% patients completed their treatment between 24–28 weeks, 28–32 weeks, and after 32 weeks, respectively. Among Category II patients, all the patients completed their treatment after 32 weeks.
| Characteristics of patients (n = 510) | Frequency (%) |
|---|---|
| Median age (interquartile range) | 35 (25–50) |
| Age groups, y | |
| 0–29 | 190 (37.3) |
| 30–44 | 148 (29.0) |
| 45–59 | 83 (16.3) |
| ≥60 | 89 (17.5) |
| Sex | |
| Male | 321 (62.9) |
| Female | 189 (37.1) |
| Area of residence | |
| Urban | 248 (48.6) |
| Rural | 262 (51.4) |
| Type of illness | |
| New cases (Category I) | 395 (77.5) |
| Re-treatment cases (Category II) | 115 (22.5) |
| Relapse | 49 (9.6) |
| Treatment failure | 1 (0.2) |
| Treatment after default | 12 (2.4) |
| Retreatment others | 53 (10.4) |
| Site of disease | |
| Pulmonary | 383 (75.1) |
| Sputum positive | 233 (45.7) |
| Sputum negative | 150 (29.4) |
| Extrapulmonary | 127 (24.9) |
| HIV status | |
| Negative | 446 (87.5) |
| Positive | 35 (6.9) |
| On ART | 24 (4.7) |
| Not on ART | 11 (2.2) |
| Unknown | 29 (5.7) |
| Diabetic status | |
| Diabetic | 12 (2.4) |
| Non-diabetic | 187 (36.7) |
| Unknown | 311 (61.0) |
| Treatment interruption leading to prolonged treatment duration | |
| Category I patients (n = 327) | |
| 24–28 wks | 237 (72.5) |
| 28–32 wks | 55 (16.8) |
| >32 wks | 35 (10.7) |
| Category II patients (n = 76) | |
| >32 wks | 76 (100) |
ART = antiretroviral therapy.
Baseline characteristics of patients.
The smear conversion rate at the end of IP was 88%. Out of the 233 sputum positive cases, there were deaths (n = 10), defaults (n = 11), shift to Category IV (n = 1), and transfer out (n = 2) during the IP; thus, the sputum status was available for only 209 patients at the end of IP.
3.2. Magnitude of adverse treatment outcomes
The overall TSR was 81.9%, and 85 patients (16.7%) had adverse treatment outcomes. Seven patients (1.4%) were transferred out of the TU and were not evaluated. The total follow-up time till all treatment outcomes were recorded was 260.72 person years. The rate of occurrence of any adverse treatment outcome was 32.60/100 person years at risk (PYAR). Defaults had the highest rate of 16.88/100 PYAR, followed by death rate of 11.12/100 PYAR, treatment failure rate of 3.45/100 PYAR, and shift of treatment regimen to Category IV rate of 1.15/100 PYAR (Table 2).
| Treatment outcome* | No. of events (%) | Median time of outcome, d (95% CI) | Rate of adverse outcomes per 100 person years at risk (95% CI) |
|---|---|---|---|
| Favorable outcome | 418 (81.9) | Cat I = 186 (184.4–187.6) | – |
| Cat II = 244 (240.1–247.9) | |||
| Cured | 178 (34.9) | Cat I = 193 (184.6–201.4) | – |
| Cat II = 252 (242.5–261.5) | |||
| Treatment completed | 240 (47.0) | Cat I = 184 (182.4–185.6) | – |
| Cat II = 241 (236.8–245.2) | |||
| Adverse treatment outcome | 85 (16.7) | 81 (56.4–105.6) | 32.60 (26.20–40.11) |
| Death | 29 (5.7) | 59 (41.4–76.6) | 16.88 (12.41–22.45) |
| Default | 44 (8.6) | 66 (55.2–76.8) | 11.12 (7.59–15.77) |
| Failure | 9 (1.8) | 237 (216.5–257.5) | 3.45 (1.68–6.34) |
| Shift to Category IV | 3 (0.6) | 118 (0–271.6) | 1.15 (0.29–3.13) |
Cat = category; CI = confidence interval.
Cured: Initially sputum smear-positive patient who has completed treatment and had negative sputum smears on two occasions, one of which was at the end of the treatment.
Treatment completed: Initially sputum smear-positive patient who has completed treatment with negative smears at end of the intensive phase/2 months in the continuation phase, but none at the end of the treatment is declared as treatment completed. Or extrapulmonary/initially sputum-negative patient who has received the full course of treatment and has not become smear positive at the end of the treatment.
Died: A patient who died during the course of the treatment, regardless of any cause.
Default: A patient after treatment initiation has interrupted treatment consecutively for >2 months.
Treatment failure: Any TB patient who is smear-positive at 5 months or more after initiation of the treatment and not put on multidrug resistance (MDR)-TB treatment.
Shift to Category IV: A patient who has been diagnosed as having MDR-TB by an RNTCP accredited laboratory, prior to being declared as “Failure”, and is placed on the RNTCP MDR-TB treatment regimen.
Relapse: A TB patient who was declared cured or treatment completed by a physician and who reports back to the health facility and is now found to be sputum smear positive.
Transferred out: A patient who has been transferred to another TU/district/state and whose treatment outcome is not available is considered as “Transferred Out” [1].
Treatment outcomes, median time, and rates of adverse treatment outcomes.
3.3. Median times and survival probabilities of adverse treatment outcomes
Median times for adverse treatment outcomes have been shown in Table 2. Kaplan–Meier survival curves were used to estimate the survival functions and probabilities of adverse treatment outcomes among the patients (Fig. 2).
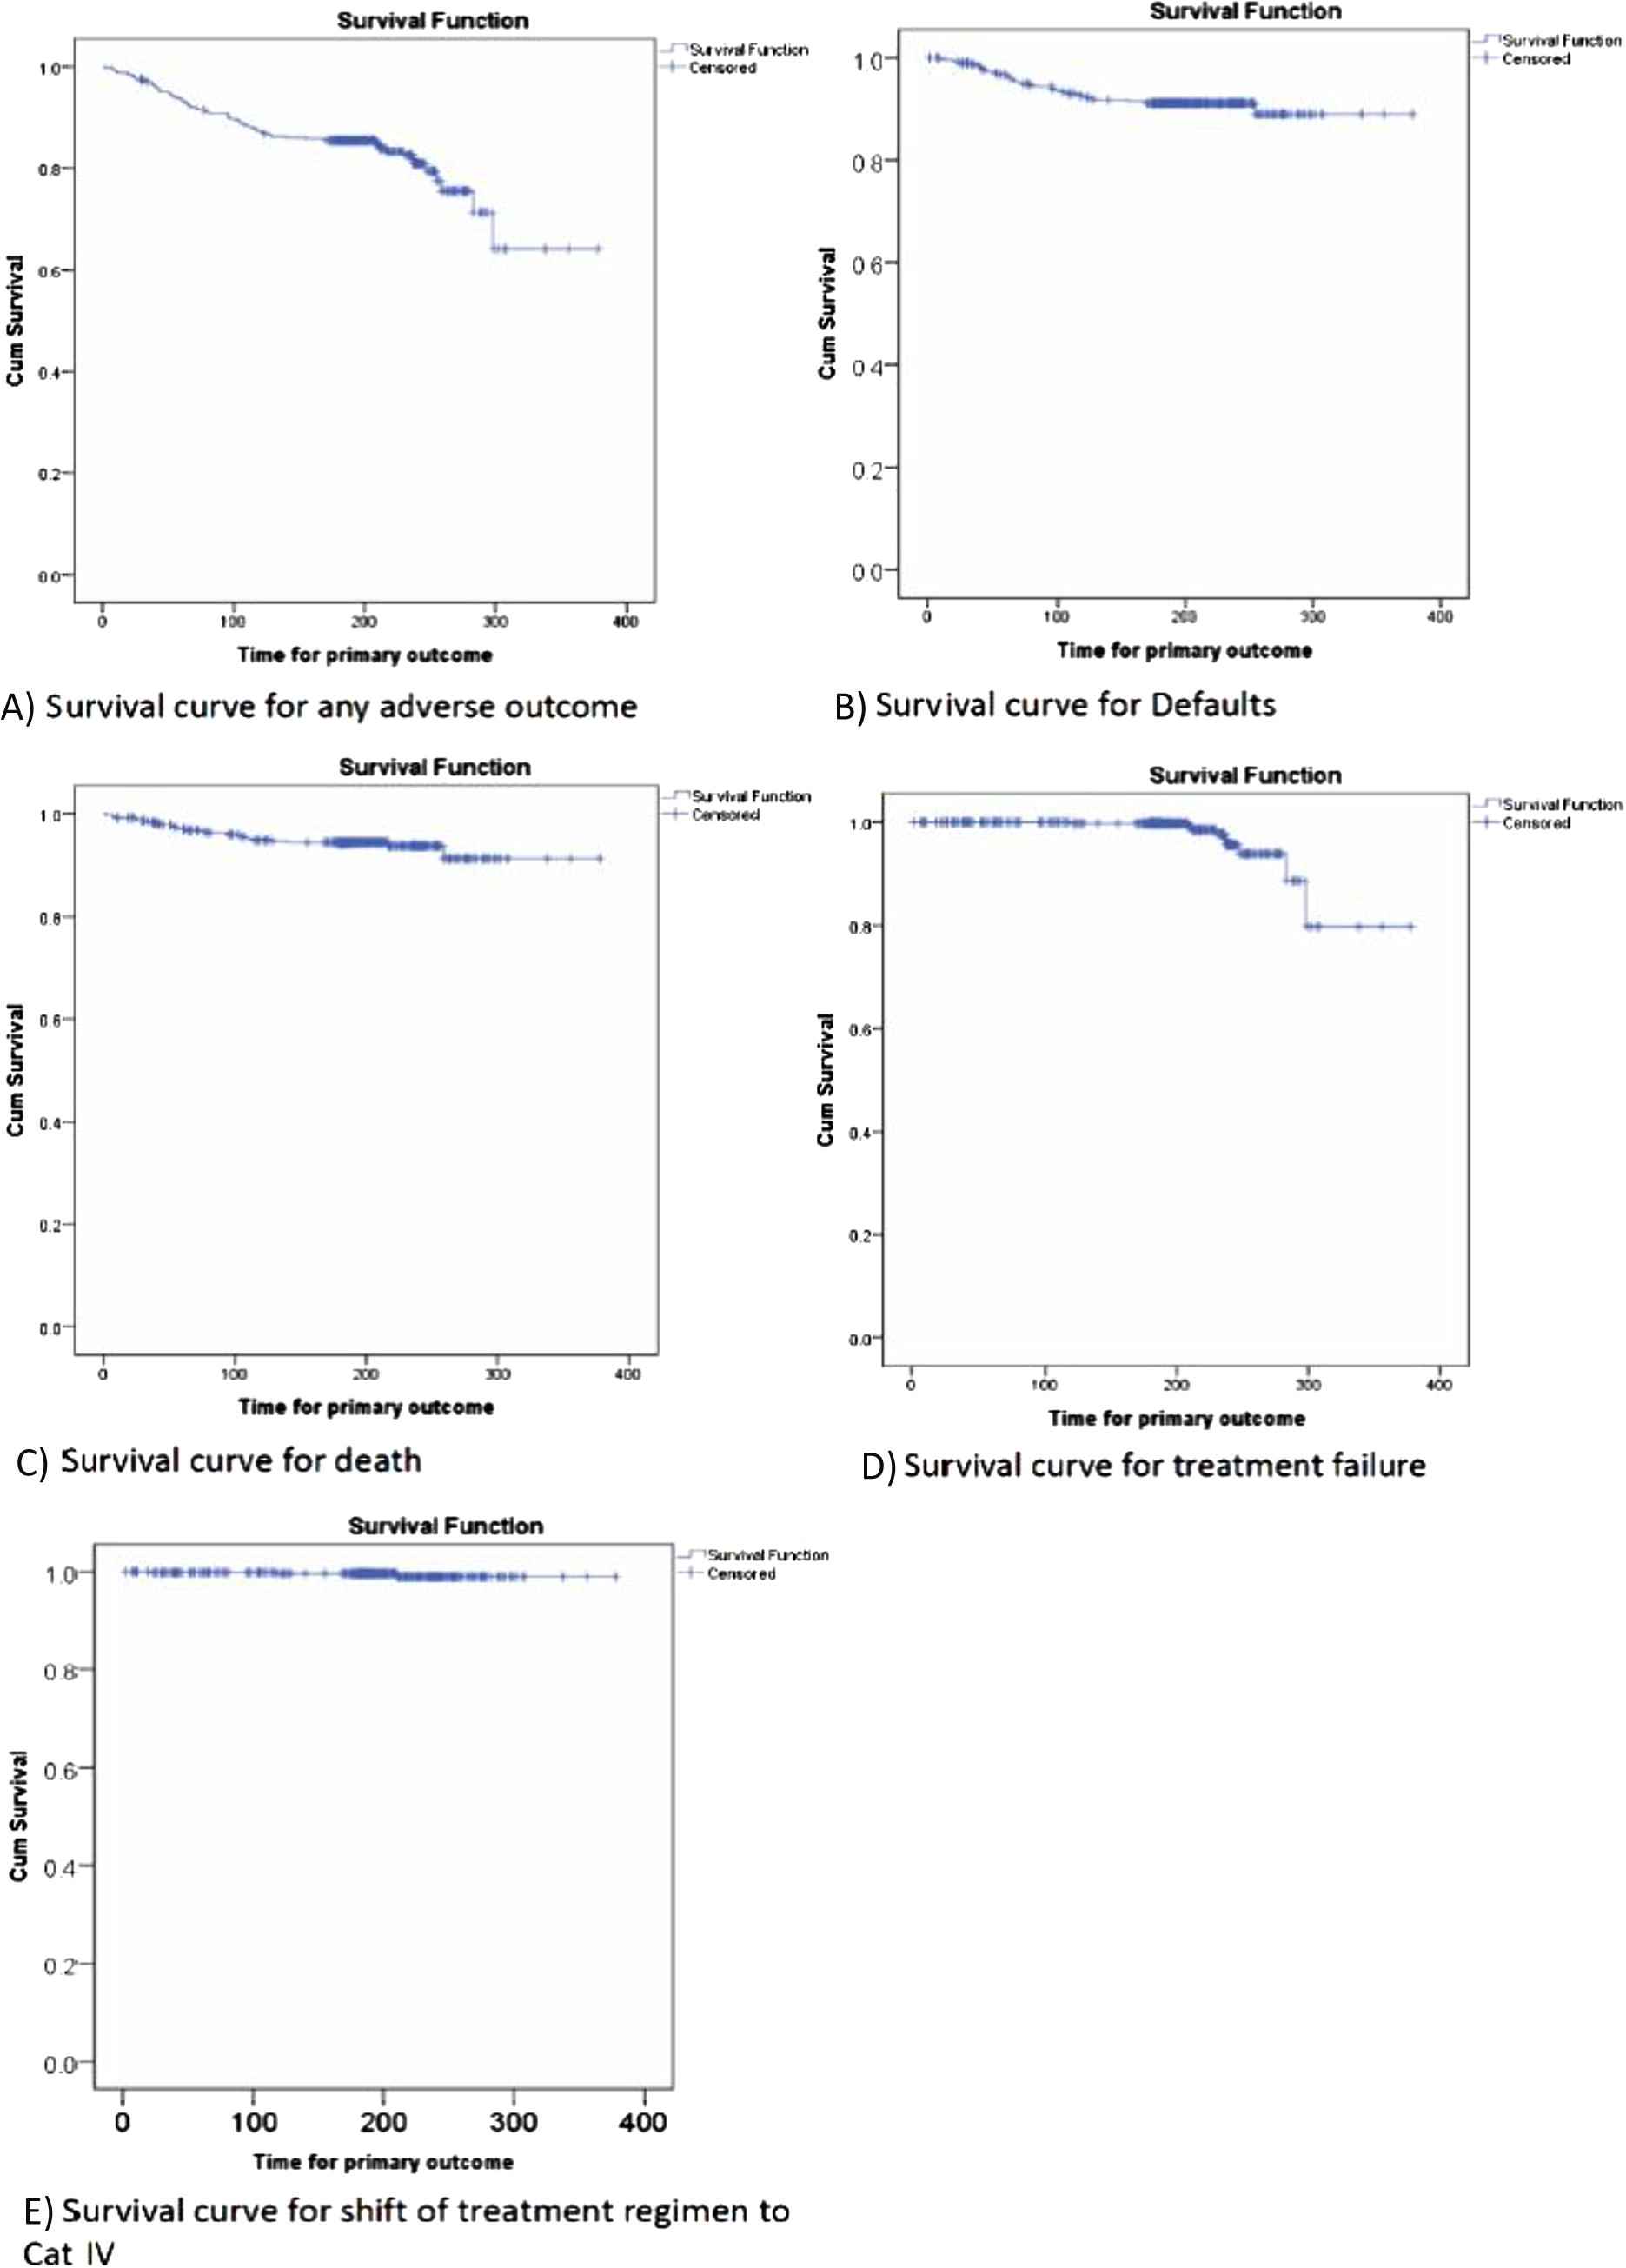
Survival curves for various adverse treatment outcomes. (A) Any adverse outcome; (B) defaults; (C) deaths; (D) treatment failure; and (E) shift of regimen to Category IV.
3.3.1. Any adverse treatment outcome
The probability of any adverse treatment outcome was high in the first 4 months with 2nd and 4th months being the highest (0.038 and 0.039, respectively). At 6 months and 8 months, the cumulative probability of adverse treatment outcomes increased to 0.145 and 0.191, respectively. The probability was also very high after 8 months of treatment initiation (0.068). At the end of the follow-up i.e., 378 days, the cumulative probability of adverse treatment outcomes was 0.358 (Fig. 2A). The median time (95% CI) for the occurrence of any adverse treatment outcome was 81 (56.4–105.6) days.
3.3.2. Defaults
After 2 months of treatment initiation, the cumulative probability of defaulting from treatment was 0.032. It increased to 0.073 at the end of 4 months. At 6 months and 8 months, it was 0.088 with no defaults between 6 months and 8 months after treatment initiation. Defaults were highest in the 3rd month, the probability being 0.023, followed by 2nd and 4th month, the default probability being 0.022 and 0.019, respectively. At 378 days, the cumulative probability of default was 0.110 (Fig. 2B). The median time (95% CI) for default was 66 (55.2–76.8) days.
3.3.3. Deaths
After 2 months of treatment initiation, the cumulative probability of death was 0.030. After 4 months, the cumulative probability increased to 0.051. After 6 months and 8 months of treatment initiation, the cumulative probabilities of death were 0.056 and 0.062, respectively. The probability of deaths was highest in the 2nd month (0.016), followed by the 4th month (0.015) and 1st month (0.014). At 378 days, the cumulative probability of death was 0.087 (Fig. 2C). The median time (95% CI) for death was 59 (41.4–76.6) days.
3.3.4. Treatment failures
The first treatment failure was recorded at 119 days, and the probability was 0.002. There were no more treatment failures till 6 months. At 8 months, the cumulative probability of treatment failure was 0.044, and at 378 days, it was 0.202 (Fig. 2D). The median time (95% CI) for treatment failure was 237 (216.5–257.5) days.
3.3.5. Shift of treatment regimen to Category IV
The probability of shift of treatment regimen to Category IV was 0.002, 0.004, and 0.011 at 1, 4, and 8 months, respectively, and remained 0.011 till the end of the follow-up (Fig. 2E). The median time (95% CI) for the shift to Category IV was 118 (0–271.6) days.
3.4. Risk factors: univariate analysis
3.4.1. Any adverse treatment outcome
The rates of any adverse treatment outcome were significantly higher in those aged ≥45 [45–59 years: rate ratio (RR) = 3.20 (1.71–6.05), ≥60 years: RR = 2.84 (1.51–5.36)], males [RR = 1.78 (1.10–2.97)], re-treatment cases [RR = 1.96 (1.26–3.02)] than in their counterparts as shown in Table 3. Extrapulmonary TB cases had lower risk of adverse treatment outcomes as compared to sputum-positive patients [RR = 0.26 (0.11–0.56)]. The rate of adverse treatment outcome was almost similar in urban and rural areas. Although the rates of adverse treatment outcome were lower in HIV-positive patients and those who were not screened for HIV than in HIV-negative patients, the difference between the rates was not significant. Similar was the case with diabetes.
| Rates of adverse outcomes per 100 PYAR* | Any adverse outcome | Default | Death | Treatment failure | Shift to Category IV | |||||
|---|---|---|---|---|---|---|---|---|---|---|
| Rate per 100 PYAR (95% CI) | Rate ratio (95% CI) | Rate per 100 PYAR (95% CI) | Rate ratio (95% CI) | Rate per 100 PYAR (95% CI) | Rate ratio (95% CI) | Rate per 100 PYAR (95% CI) | Rate ratio (95% CI) | Rate per 100 PYAR (95% CI) | Rate ratio (95% CI) | |
| Age group, y | ||||||||||
| 0–29+ (100.87 PYǂ) | 17.84 (10.57–28.20) | 1 | 5.95 (2.17–12.95) | 1 | 7.93 (3.42–15.63) | 1 | 1.98 (0.22–7.16) | 1 | 1.98 (0.22–7.16) | 1 |
| 30–44 (77.83 PY) | 29.55 (18.73–44.34) | 1.66 (0.89–3.11) | 14.13 (7.05–25.29) | 2.38 (0.88–6.94) | 10.28 (4.42–20.25) | 1.30 (0.47–3.58) | 3.85 (0.77–11.26) | 1.94 (0.29–16.35) | 1.29 (0.02–7.15) | 0.65 (0.02–8.52) |
| 45–59 (38.54 PY) | 57.08 (35.76–86.43) | 3.20 (1.71–6.05) | 36.33 (19.84–60.95) | 6.11 (2.39–17.27) | 15.57 (5.69–33.89) | 1.96 (0.64–5.79) | 5.19 (0.58–18.74) | 2.62 (0.27–25.14) | 0 | 0 (0–9.09) |
| ≥60 (43.48 PY) | 50.60 (31.70–76.61) | 2.84 (1.51–5.36) | 29.90 (15.91–51.13) | 5.03 (1.94–14.35) | 16.10 (6.45–33.17) | 2.03 (0.70–5.77) | 4.60 (0.52–16.61) | 2.32 (0.24–22.28) | 0 | 0 (0–8.06) |
| Sex | ||||||||||
| Female (95.99 PY+) | 21.88 (13.54–33.44) | 1 | 6.25 (2.28–13.61) | 1 | 11.46 (5.71–20.51) | 1 | 2.08 (0.23–7.52) | 1 | 2.08 (0.23–7.52) | 1 |
| Male (164.73 PY) | 38.85 (29.92–49.61) | 1.78 (1.10–2.97) | 23.07 (16.32–31.66) | 3.69 (1.64–9.61) | 10.93 (6.47–17.27) | 0.95 (0.45–2.08) | 4.25 (1.70–8.76) | 2.04 (0.45–14.33) | 0.61 (0.08–3.37) | 0.29 (0.01–3.83) |
| Area of residence | ||||||||||
| Rural (132.53 PY)+ | 33.20 (24.42–44.17) | 1 | 16.60 (10.67–24.72) | 1 | 11.32 (6.58–18.25) | 1 | 3.77 (1.38–8.36) | 1 | 1.51 (0.25–4.99) | 1 |
| Urban (128.19 PY) | 31.98 (23.26–42.97) | 0.96 (0.63–1.48) | 17.16 (11.03–25.56) | 1.03 (0.57–1.88) | 10.92 (6.22–17.89) | 0.97 (0.46–2.02) | 3.12 (0.99–7.53) | 0.83 (0.20–3.27) | 0.78 (0.04–3.84) | 0.52 (0.02–6.80) |
| Type of illness | ||||||||||
| New (194.56 PY)+ | 26.21 (19.52–34.47) | 1 | 14.39 (9.56–20.80) | 1 | 9.25 (5.48–14.62) | 1 | 2.05 (0.55–5.26) | 1 | 0.51 (0.01–2.86) | 1 |
| Re-treatment (66.16 PY) | 51.39 (35.58–71.81) | 1.96 (1.26–3.02) | 24.18 (13.81–39.27) | 1.68 (0.89–3.09) | 16.63 (8.29–29.75) | 1.80 (0.82–3.80) | 7.56 (2.44–17.63) | 3.68 (0.93–15.38) | 3.02 (0.34–10.91) | 5.88 (0.45–173.5) |
| Site of illness | ||||||||||
| Pulmonary-sputum positive (72.12 PY)+ | 39.93 (2954–52.79) | 1 | 17.93 (11.23–27.14) | 1 | 13.04 (7.45–21.17) | 1 | 7.33 (3.35–13.92) | 1 | 1.63 (0.18–5.88) | 1 |
| Pulmonary-sputum negative (122.71 PY) | 40.21 (26.92–57.75) | 1.01 (0.63–1.59) | 24.96 (14.78–39.45) | 1.39 (0.74–2.61) | 13.87 (6.64–25.50) | 1.06 (0.46–2.34) | 0 | 0 (0–0.67) | 1.39 (0.02–7.71) | 0.85 (0.03–11.18) |
| Extrapulmonary (65.89 PY) | 10.62 (4.26–21.89) | 0.26 (0.11–0.56) | 6.07 (1.63–15.54) | 0.34 (0.10–0.92) | 4.55 (0.92–13.30) | 0.35 (0.08–1.10) | 0 | 0 (0–0.74) | 0 | 0 (0–6.47) |
| HIV status | ||||||||||
| Negative (227.52 PY)+ | 33.84 (26.71–42.30) | 1 | 16.70 (11.82–22.93) | 1 | 11.87 (7.82–17.27) | 1 | 3.96 (1.81–7.51) | 1 | 1.32 (0.27–3.85) | 1 |
| Positive (17.95 PY) | 16.71 (3.36–48.84) | 0.49 (0.12–1.39) | 11.14 (1.25–40.23) | 0.67 (0.11–2.33) | 5.57 (0.07–31.0) | 0.47 (0.02–2.48) | 0 | 0 (0–5.01) | 0 | 0 (0–21.73) |
| Unknown (15.26 PY) | 32.77 (10.56–76.47) | 0.97 (0.35–2.23) | 26.22 (7.05–67.11) | 1.57 (0.48–4.06) | 6.55 (0.01–36.46) | 0.55 (0.03–2.92) | 0 | 0 (0–5.89) | 0 | 0 (0–25.56) |
| Diabetic status | ||||||||||
| Non-diabetic (96.41 PY)+ | 34.23 (23.56–48.07) | 1 | 18.67 (11.06–29.51) | 1 | 10.37 (4.96–19.07) | 1 | 2.07 (0.23–7.49) | 1 | 3.11 (0.63–9.09) | 1 |
| Diabetic (5.90 PY) | 16.95 (0.22–94.31) | 0.50 (0.02–2.59) | 0 | 0 (0–2.96) | 16.95 (0.22–94.31) | 1.63 (0.07–9.74) | 0 | 0 (0–56.75) | 0 | 0 (0–28.02) |
| Unknown (158.41 PY) | 32.20 (23.97–42.33) | 0.94 (0.61–14.72) | 16.41 (10.72–24.05) | 0.88 (0.48–1.63) | 11.36 (6.73–17.96) | 1.10 (0.51–2.47) | 4.42 (1.77–9.11) | 2.13 (0.47–14.96) | 0 | 0 (0–1.04) |
CI = confidence interval; PY = person years; PYAR = person years at risk.
Reference group.
Risk factors for adverse treatment outcomes: univariate analysis.
3.4.2. Defaults
Defaults were significantly higher in patients aged ≥45 years [45–59 years: RR = 6.11 (2.39–17.27), ≥60 years: RR = 5.03 (1.94–14.35)] than in those <30 years and in males than in females [RR = 3.69 (1.64–9.61)]. Extrapulmonary TB patients were only at 34% risk of defaulting compared with sputum-positive patients. The relation between defaults and HIV, diabetes and residence of patients was insignificant.
3.4.3. Deaths
The rate of deaths also increased with age, the rate ratio being 1.3, 1.9, and 2.0 in patients aged 30–44 years, 45–59 years, and ≥60 years, respectively. The death rates were similar in both male and female patients, urban and rural residents, sputum-positive and negative patients, and about one-third in extrapulmonary TB patients compared with sputum-positive patients, 1.8 times in re-treatment cases compared with new cases, and about half in HIV-positive and unscreened patients compared with their counterparts. It was slightly higher in diabetics and those who were not screened for diabetes, but none of these differences were significant.
3.4.4. Treatment failure
Treatment failure had more than twice the rate in those aged >45 years compared with those aged <30 years and in males compared with females. It was 3.6 times higher in re-treatment cases, but these differences were insignificant (Table 3).
3.4.5. Shift of treatment regimen to Category IV
Although advancing age, male sex, urban residents, re-treatment cases, sputum-negative and extrapulmonary TB patients, HIV-positive patients, and diabetic patients appeared to have lower rates than their counterparts, the differences were insignificant.
3.5. Risk factors: multivariate analysis
On multivariate analysis using cox proportional hazard method, having any adverse treatment outcome was higher in patients aged 45–59 years [HR = 2.99 (1.58–5.68); p < 0.05] and ≥60 years [HR = 2.43 (1.28–4.61); p < 0.05] and lower in extrapulmonary TB patients than in sputum-positive patients [HR = 0.33 (0.15–0.75); p < 0.05]. Defaults were significantly higher in patients aged 45–59 years [HR = 5.18 (1.95–13.79); p < 0.05] and ≥60 years [HR = 3.97 (1.47–10.70); p < 0.05] and among males [HR = 3.03 (1.26–7.31); p < 0.05]. Deaths, treatment failures, and shifting of treatment regimen to Category IV were not associated significantly with age, sex, residence, site of illness, or category of treatment initiation (Table 4).
| Adverse treatment outcome | Any adverse outcome HR (95% CI) | Default HR (95% CI) | Death HR (95% CI) | Treatment failure HR (95% CI) | Shift to Category IV HR (95% CI) |
|---|---|---|---|---|---|
| Age group, y | |||||
| 0–29 | 1 | 1 | 1 | 1 | 1 |
| 30–44 | 1.55 (0.82–2.90) | 2.21 (0.81–6.05) | 1.21 (0.44–3.30) | 1.59 (0.25–10.05) | 0.11 (0.004–3.34) |
| 45–59 | 2.99 (1.58–5.68) | 5.18 (1.95–13.79) | 1.76 (0.59–5.25) | 3.18 (0.35–29.12) | 0 |
| ≥60 | 2.43 (1.28–4.61) | 3.97 (1.47–10.70) | 1.74 (0.60–4.99) | 2.98 (0.41–21.82) | 0 |
| Sex | |||||
| Female | 1 | 1 | 1 | 1 | 1 |
| Male | 1.35 (0.82–2.24) | 3.03 (1.26–7.31) | 0.74 (0.34–1.60) | 1.03 (0.17–6.34) | 0.06 (0.002–1.92) |
| Area of residence | |||||
| Rural | 1 | 1 | 1 | 1 | 1 |
| Urban | 0.99 (0.64–1.54) | 1.08 (0.58–2.03) | 0.97 (0.46–2.05) | 1.26 (0.31–5.08) | 0.62 (0.04–9.54) |
| Site of illness | |||||
| Pulmonary: sputum positive | 1 | 1 | 1 | 1 | 1 |
| Pulmonary: sputum negative | 0.91 (0.56–1.47) | 1.10 (0.58–2.12) | 0.97 (0.43–2.22) | 0 | 0.81 (0.04–15.54) |
| Extrapulmonary | 0.33 (0.15–0.75) | 0.44 (0.15–1.33) | 0.37 (0.10–1.31) | 0 | 0 |
| Treatment category | |||||
| Category I (New) | 1 | 1 | 1 | 1 | 1 |
| Category II (re-treatment) | 1.46 (0.91–2.33) | 1.36 (0.70–2.63) | 1.63 (0.73–3.66) | 0.40 (0.07–2.24) | 23.01 (0.87–609.68) |
| HIV status | |||||
| Negative | 1 | 1 | 1 | 1 | 1 |
| Positive | 0.49 (0.15–1.58) | 0.60 (0.14–2.55) | 0.51 (0.07–3.95) | 0 | 0 |
| Unknown | 0.97 (0.39–2.43) | 1.78 (0.62–5.10) | 0.53 (0.07–3.97) | 0 | 0 |
| Diabetes status | |||||
| Non-diabetic | 1 | 1 | 1 | 1 | 1 |
| Diabetic | 0.35 (0.05–2.56) | 0 | 1.30 (0.16–10.49) | 0 | 0 |
| Unknown | 1.06 (0.68–1.66) | 1.01 (0.54–1.89) | 1.18 (0.53–2.59) | 4.01 (0.67–23.93) | 0 |
Risk factors for adverse treatment outcomes: multivariate analysis using cox proportional hazards model.
4. Discussion
In our study, 16.7% patients experienced adverse treatment outcomes. The proportion of defaults, deaths, treatment failures, and shift of treatment regimen were 8.6%, 5.7%, 1.8%, and 0.6%, respectively. Half of the adverse treatment outcomes occurred within the first 3 months of treatment initiation, and among those, half of the deaths and defaults occurred in the first 2 months of treatment initiation. Age of ≥45 years and pulmonary disease were independent predictors of having any adverse treatment outcome. Age of ≥45 years and male sex were independent predictors of defaulting from treatment.
The rate of defaults (8.6%) was higher in our study than in other studies [10–12]. The defaulters were less than those reported by Pardeshi [13] in a neighboring district. The better default proportion may be due to the improved services over the years under RNTCP. About half of the defaults occurred in the initial 2 months. Similar findings were reported by other studies [10,13]; however, we did not find any relation between defaults and re-treatment cases as reported by them. It is known that after DOTS initiation, it takes a few weeks for the sputum conversion and patients start feeling better, after which some patients may default from treatment owing to the improvement in symptoms [11]. Defaults were associated independently with male sex and those aged >45 years. Similar findings were also reported in other studies [14]. Males have a higher incidence of substance use than females, which is a risk factor for default [14,15]. In our setup, males were primary bread earners in the family. Any feeling of DOTS interfering with the routine work or fear of losing wages may also be a reason for males being at a higher risk of defaulting than females [16,17]. The risk of adverse treatment outcome was higher in those >45 years. Similar findings were observed in another study [18]. The association of age with adverse treatment outcomes may be due to age-related comorbidities.
Deaths were similar to other studies [4,12]. Studies have reported higher death rates in re-treatment cases [4], advancing age [4,12,19,20], male sex, and HIV coinfection [19,20]. We did not find any association between deaths during treatment and any of the aforementioned factors. Some studies have also found association between poor nutritional status (low body mass index or pre-treatment weight) and deaths [14,21]. However, we were not able to analyze this relation as pre-treatment body weights for most of the patients were not available.
There were few cases of treatment failure (1.8%) and shift of treatment regimen to Category IV (0.6%). Out of the nine failures, three occurred in patients whose sputum smear was positive at the end of IP and the remaining six in those whose smear converted to negative after IP. Like deaths, we did not find any independent predictors for failures and shift of treatment regimen in our study. The shift of treatment regimen to Category IV was due to drug resistance. Culture reports consume some time before the suspects receive the appropriate treatment if found resistant. Introduction of cartridge-based nucleic acid amplification test under the program at district TB centers will help in minimizing the time needed to detect resistance to rifampicin at least [22].
One of the reasons for the higher rates of adverse treatment outcomes may be understaffing of the program. Lack of required health care providers leads to work overload among the staff and less patient–provider interaction, counseling, support, and information exchange. These factors are associated with defaulting from treatment [16,23,24]. The population norms of each TU has been changed from 1 per 0.5 million population to 1 per administrative block (and 1 per 0.15–0.25 million population in urban areas) as a part of change in the strategy of the program for better performance by increasing the health workforce, thereby leading to better implementation and monitoring of the program [22]. However, till date, Wardha district has only three TUs instead of eight, according to the new strategy. Therefore, there is an urgent need to increase the number of TUs in the district for a better program performance.
Half of the deaths and defaults occurring in the first 2 months is concerning. Early suspicion and prediction will help us in minimizing these events; for instance, initiating early retrieval action and frequent follow-up visits for reducing defaults and necessary services for preventing deaths may be tailored according to the specific case. Death audits have been proposed to be conducted for the death of TB patients for elucidating the responsible factors [22]. Proper implementation of the necessary system needs to be ensured to understand the local modifiable factors with an aim to tackle these factors.
Like in other health-related events, there may be several types of delays in TB cases also, such as delay in care seeking, diagnosis, and treatment initiation. Lack of awareness, poverty, loss of income, domestic or occupational priority over health, alcohol consumption, and distance from health center are the some of the reasons for such delays. Delays in care may also lead to multiple visits of a patient to facilities and consequently a delayed diagnosis after care seeking. It may also lead to loss to follow-up of patients [25]. Stigma is also associated with delay and defaulting [26]. Awareness-generating activities in the community may help in improving the knowledge and attitude regarding the disease and in bringing a positive behavior change and reduce the associated stigma. Other interventions like financial support, deaddiction programs, and improving access of diagnostic facilities in the periphery are some of the steps that may be undertaken to improve the program performance [27].
In our study, all successfully treated patients took more than the expected time for the same. This may have been due to treatment interruptions and irregular compliance by patients, which favors development of drug resistance [28]. Financial incentives to improve compliance aimed at covering travel costs and reducing financial burden have been proposed [29]. Traveling for treatment has been reduced by involvement of community-based DOTS provider under RNTCP, but they are not trained for giving streptomycin injections to patients. This adds to the hardship of traveling long distances during IP for re-treatment patients, especially in rural areas where there are limited health facilities. With the daily drug regimen being introduced under RNTCP, this traveling is bound to increase. Partnership and involvement of private practitioners wherever available in the village itself or training of ASHA worker in giving injectable drugs may reduce the time and money spent in traveling.
Diabetes and HIV statuses of 5.7% and 61% patients, respectively, were not known. This can be seen as a lost opportunity to screen these patients placing them at a disadvantage. Every effort should be made to screen all patients of TB for diabetes and HIV as these have been associated with adverse treatment outcomes, especially deaths, so that timely treatment can be initiated and these deaths can be prevented [19–21].
There has been an increasing call for retrieval activities for patients defaulting from treatment, which is also being conducted in the district; however, it has not been able to reduce the number of defaults to an acceptable level [30]. Other studies have reported that many defaults are associated with provider level factors and can be changed with appropriate interventions [23]. The reason of defaults may differ for early and late defaults, and appropriate interventions are needed to maximize the dividends.
The program has also proposed long-term follow-up of patients every 6 monthly to detect the cases of relapses early. If implemented properly, this can effectively reduce the delay and related morbidity and mortality due to TB. It has also been proposed that family members may be the DOTS providers. This appears as a good strategy especially for those who default due to travel, occupation, or education-related factors [22].
In our study, the treatment outcomes of all the patients, except those who transferred out, were known; therefore, we assume the estimates of the rates were quite accurate. Also, the use of person-time measures enables to estimate the rates more accurately, but very few studies have used it. Our study findings should be viewed with certain limitations. Sub group analysis according to the type, such as new, treatment after defaults, relapse, failure or others, was not performed due to the limited number of events. As it was a record-based study, we were unable to study other modifiable determinants of adverse treatment outcomes. We did not analyze relapse cases as it was beyond the scope of our study. The association between HIV, diabetes, and adverse treatment outcomes may be subject to bias as they were unknown for a considerable number of patients.
5. Conclusion
High rates of adverse treatment outcomes, especially deaths and defaults, are a constant hurdle in achieving the targets of RNTCP. Our study shows the need for searching for the factors in this setting and implementing appropriate interventions to reduce the adverse treatment outcomes. Proper implementation of the program along with mechanisms to reduce the treatment interruptions will help in improving the program performance.
Conflicts of interest
None declared.
Contribution of authors
AM, PRD were involved in the conception, design, data analysis/interpretation, drafting of paper and revising the draft critically for substantial intellectual content. AM and AD were involved in data collection. AD was involved in drafting and critical analysis of the paper. All the authors have approved the final version of the article submitted.
Funding
None declared.
Acknowledgement
We would like to acknowledge the contribution of Staff from the District Tuberculosis Office for their cooperation and invaluable inputs.
References
Cite this article
TY  - JOUR
AU  - Anuj Mundra
AU  - Pradeep R. Deshmukh
AU  - Ajay Dawale
PY  - 2017
DA  - 2017/03/18
TI  - Magnitude and determinants of adverse treatment outcomes among tuberculosis patients registered under Revised National Tuberculosis Control Program in a Tuberculosis Unit, Wardha, Central India: A record-based cohort study
JO  - Journal of Epidemiology and Global Health
SP  - 111
EP  - 118
VL  - 7
IS  - 2
SN  - 2210-6014
UR  - https://doi.org/10.1016/j.jegh.2017.02.002
DO  - 10.1016/j.jegh.2017.02.002
ID  - Mundra2017
ER  -