
Investigation of OMNIgene·SPUTUM performance in delayed tuberculosis testing by smear, culture, and Xpert MTB/RIF assays in Uganda
C.D. Kelly-Cirino and E. Musisi are equally contributing co-first authors.
- DOI
- 10.1016/j.jegh.2017.04.001How to use a DOI?
- Keywords
- MGIT; Molecular detection; Mycobacterium tuberculosis; Preservation; Solid culture; Specimen transport medium
- Abstract
OMNIgene·SPUTUM (OM-S) is a sample transport reagent designed to work with all tuberculosis diagnostics while eliminating the need for cold chain. OM-S-treated sputum samples were assayed in several tests after multiday holds. Raw sputa from 100 patients underwent direct smear microscopy, were manually split and assigned to the OM-S group [OM-S added at collection (no other processing required) and tested after 0- to 5-day holds at room temperature] or standard-of-care (SOC) group (NaOH/N-acetyl
l -cysteine decontamination, all tested on day of collection). Concentrated smear microscopy, Lowenstein Jensen (LJ) culture, and mycobacteria growth indicator tube (MGIT) culture were performed. For patients with negative direct smear, a second sample was split, with SOC (raw sputum) and OM-S portions (sediment) tested in the Xpert MTB/RIF (Xpert) assay. OM-S group and SOC group results were strongly concordant on all four tests [range, 89% (MGIT)–97% (Xpert)]. OM-S MGIT, LJ, and Xpert tests were in statistical agreement with SOC MGIT as reference. OM-S specimens had lower culture contamination rates (3% vs. 10% LJ; 2% vs. 5% MGIT) but required, on average, 5.6 additional days to become MGIT-positive. The findings suggest that samples held/transported in OM-S are compatible with smear microscopy, LJ or MGIT culture, and Xpert, and perform comparably to fresh sputum samples. Larger feasibility studies are warranted.- Copyright
- © 2017 Ministry of Health, Saudi Arabia. Published by Elsevier Ltd.
- Open Access
- This is an open access article under the CC BY-NC-ND license (http://creativecommons.org/licenses/by-nc-nd/4.0/).
1. Introduction
Uganda is one of the World Health Organization’s 30 high-burden countries facing a combined tuberculosis (TB)/human immunodeficiency virus public health crisis [1]. The global plan to end TB, a 5-year strategy, aims to successfully treat 90% of people infected with TB by 2020 [2]. To reach this goal, high-priority, resource-constrained countries such as Uganda must be able to expand their TB programs. Greater patient access to testing is needed and new, flexible pre-analytical technologies can help achieve this. Laboratories must be able to successfully collect and ship sputum specimens to reference facilities where they can potentially be tested with all diagnostics, including gold standard culture. Currently, some countries can only collect and test one sample per patient, and losses to contamination during transport only intensify challenges for TB programs. Cold-chain infrastructure helps maintain sample quality, but this is costly and is not logistically feasible for programs in many high-TB-burden areas.
The ability to reliably collect and ship one quality sputum sample per patient that is testable across all methods [i.e., by preserving viable Mycobacterium tuberculosis (MTb) as opposed to nucleic acids alone] would assist programs significantly. OMNIgene·SPUTUM (OM-S; DNA Genotek Inc., Ottawa, ON, Canada) is a transport reagent that liquefies and decontaminates sputum, and that maintains live MTb for 8 days at temperatures up to 40 °C [3]. When OM-S is added, cold chain is not required for shipping and samples are directly compatible with molecular assays and gold standard TB tests, such as smear microscopy, solid and liquid culture, and the Cepheid Xpert MTB/RIF assay (Cepheid, Sunnyvale, CA, USA) [3–6]. The aim of this study was to evaluate the performance of OM-S-treated clinical samples in multiple TB tests, including culture, after various hold times.
2. Material and methods
The study was conducted at Mulago Hospital in Kampala, Uganda from October 2015 to April 2016. It was nested within the International HIV-associated Opportunistic Pneumonias-Inflammation, Aging, Microbes and Obstructive Lung Disease study, which was approved by the Makerere University School of Medicine Research Ethics Committee, the Mulago Hospital Institutional Review Board, the University of California San Francisco Committee on Human Research, and the Uganda National Council for Science and Technology. Participants provided informed consent.
Fig. 1 outlines the study design. Raw sputum was collected from 100 clinical patients with TB symptoms. The inclusion criteria were ≥18 years of age; cough with/without fever, night sweats, weight loss, chest pain; presentation with/without signs of extrapulmonary involvement; and no TB treatment within the past 2 years. The exclusion criteria were inability to provide spontaneously expectorated or induced sputum ≥2 mL, symptoms of extrapulmonary TB exclusively, and/or TB treatment.
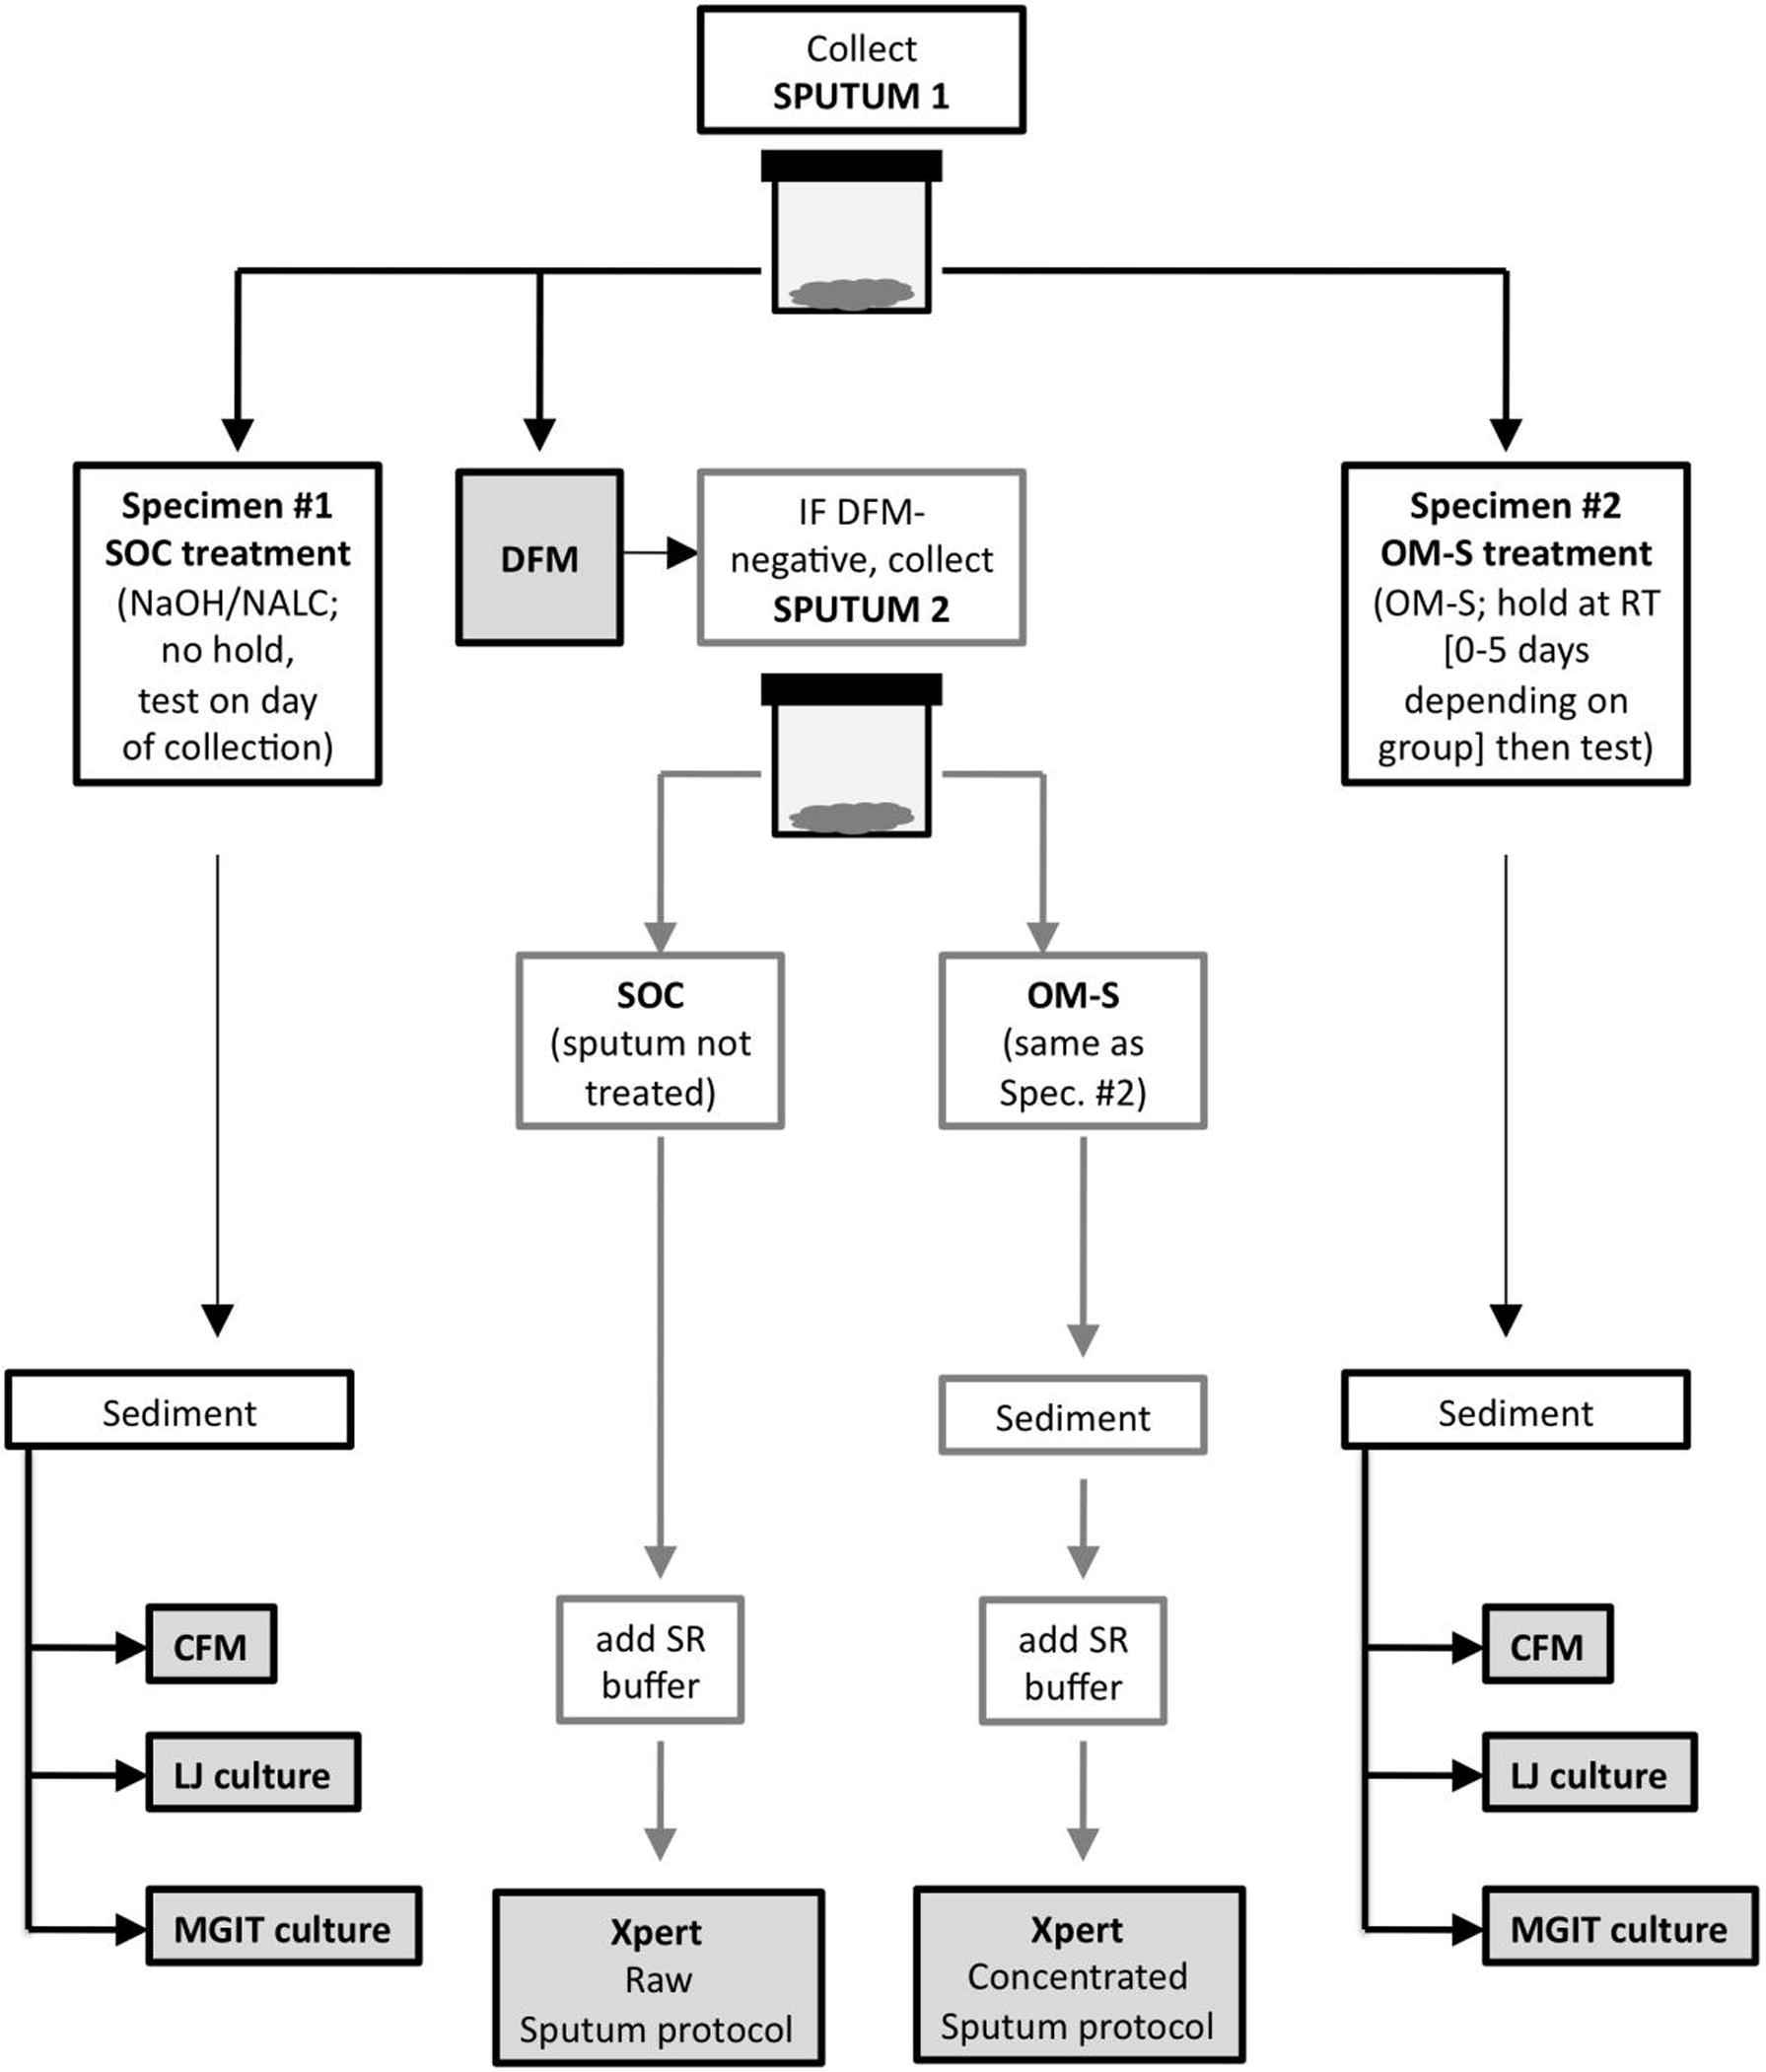
Schematic of the study protocol for sample collection, treatments, and testing. Each patient’s initial sputum sample (Sputum 1) was split manually, the two specimens received either standard-of-care (SOC) or OMNIgene·SPUTUM (OM-S) treatment, and each specimen was then tested by concentrated fluorescent microscopy and solid and liquid culture. If the direct smear from Sputum 1 was negative, the patient also provided a second sputum sample (Sputum 2), which was divided and treated identically to Sputum 1. The SOC specimen was then Xpert-tested using Cepheid’s Raw Sputum protocol. The OM-S specimen was centrifuged to produce a sediment following manufacturer instructions, and was tested using Cepheid’s Concentrated Sputum protocol. CFM = concentrated fluorescent microscopy; DFM = direct fluorescent microscopy; LJ = Lowenstein Jensen; MGIT = mycobacteria growth indicator tube; OM-S = OMNIgene·SPUTUM; SR = Sample Reagent.
2.1. Treatment groups
Initially, a spontaneous sputum sample was collected and manually split into two equivalent portions that were randomly labeled Specimen #1 and Specimen #2, and assigned to receive standard-of-care (SOC) treatment or OM-S treatment (Fig. 1).
2.1.1. SOC (control) group
Each Specimen #1 was initially examined by direct fluorescent microscopy (DFM). The remaining raw sputum was treated for 20 min with an equal (1:1) volume of NaOH/N-acetyl
2.1.2. OM-S group
Each Specimen #2 had an equal (1:1) volume of OM-S reagent added and was inverted 10–20 times to mix; no other processing was required. Groups of samples were either tested on Day 0 (collection day; n = 20) or stored at room temperature (25–30 °C) and tested after 2-, 3-, 4- or 5-day holds (each group n = 20). Immediately prior to testing, each specimen was centrifuged at 3000g for 20 min. The supernatant was discarded and the sediment was resuspended in 2.0 mL sterile PBS. Tests were as listed above.
2.2. Testing
2.2.1. Smear microscopy
Sputum smears (1–2 cm) were dried and then stained for 15 min using a 0.5% solution of auramine-O (Merck, Darmstadt, Germany), decolorized for 2 min in 3% acid alcohol, and counterstained for 1 min in 0.5% potassium permanganate solution. They were air-dried and examined within 1 h under a light microscope with fluorescent illumination (200× magnification for CFM, 400× for DFM). Smear results were designated negative, scanty (number of acid-fast bacilli noted), or 1+, 2+, or 3+ based on Clinical and Laboratory Standards Institute grading standards.
2.2.2. Liquid and solid culture
Liquid media (BACTEC MGIT 960 System; Becton Dickinson, Franklin Lakes, NJ, USA) and Lowenstein Jensen (LJ) solid media were inoculated (Sputum 1; Fig. 1). For MGIT, maximum incubation time was 42 days and positive or negative status was instrument-determined. All positive MGIT tubes were cultured on blood agar to assess for MTb and/or contaminating bacteria. When the latter were found, the MGIT sample was recorded as contaminated. The LJ slants were incubated at 37 °C for a maximum of 56 days, and MTb colony growth was graded 1+, 2+ or 3+. An LJ culture with visible contaminants was recorded as contaminated. For MGIT and LJ, “rescue” was recorded when the culture for one treatment (e.g., OM-S or SOC) was positive, whereas the culture for the other treatment was contaminated. Time-to-culture-positive (TTP in days + hours) was noted for MGIT cultures. TTP values were rounded to the whole day based on the hours recorded; if >12 h the value was rounded to the next day, otherwise it was rounded down to the noted day (e.g., “4;13” was TTP 5 days).
2.2.3. Xpert MTB/RIF (Xpert) assay
Patients with negative DFM provided a second spontaneous sputum sample for Xpert testing (Sputum 2, Fig. 1). Each raw sample was split and assigned to the SOC or OM-S group. The SOC portions were untreated and were tested immediately. The OM-S portions had OM-S added as described above and were stored at room temperature for their designated hold times. For each SOC Xpert assay, the raw sputum was not concentrated; one volume of sputum was mixed with two volumes of the manufacturer’s Sample Reagent buffer and tested per the Raw Sputum procedure in the Xpert package insert [7] (Fig. 1). For each OM-S Xpert assay, the OM-S-treated sputum was concentrated to produce sediment by centrifuging at 3800g; one volume of the resuspended sediment was mixed with two volumes of Sample Reagent buffer and tested per the Concentrated Sputum procedure in the package insert [7] (Fig. 1). All sample preparations were loaded into individual Xpert cartridges and tested in the same instrument. Results were categorized as negative, very low, low, medium or high positive [7].
2.3. Analysis
Treatment group results were compared overall and by hold time. Intertest agreement was examined statistically, with each test except smear microscopy analyzed relative to SOC MGIT as the reference standard. The dataset comprised only samples that were not contaminated in SOC MGIT (i.e., n = 95 for culture, n = 65 for Xpert; Table S1). An EpiTools calculator [8] was used to perform Cohen’s kappa coefficient (κ) analysis and percent-agreement calculations. The κ values were assigned a “strength of agreement” [9]: 0.01–0.20 poor; 0.21–0.40 fair; 0.41–0.60 moderate; 0.61–0.80 substantial; and 0.81–1.00 good. Tests were also compared by Chi-square analysis, with p < 0.05 considered significant.
3. Results
3.1. Comparisons for all tests
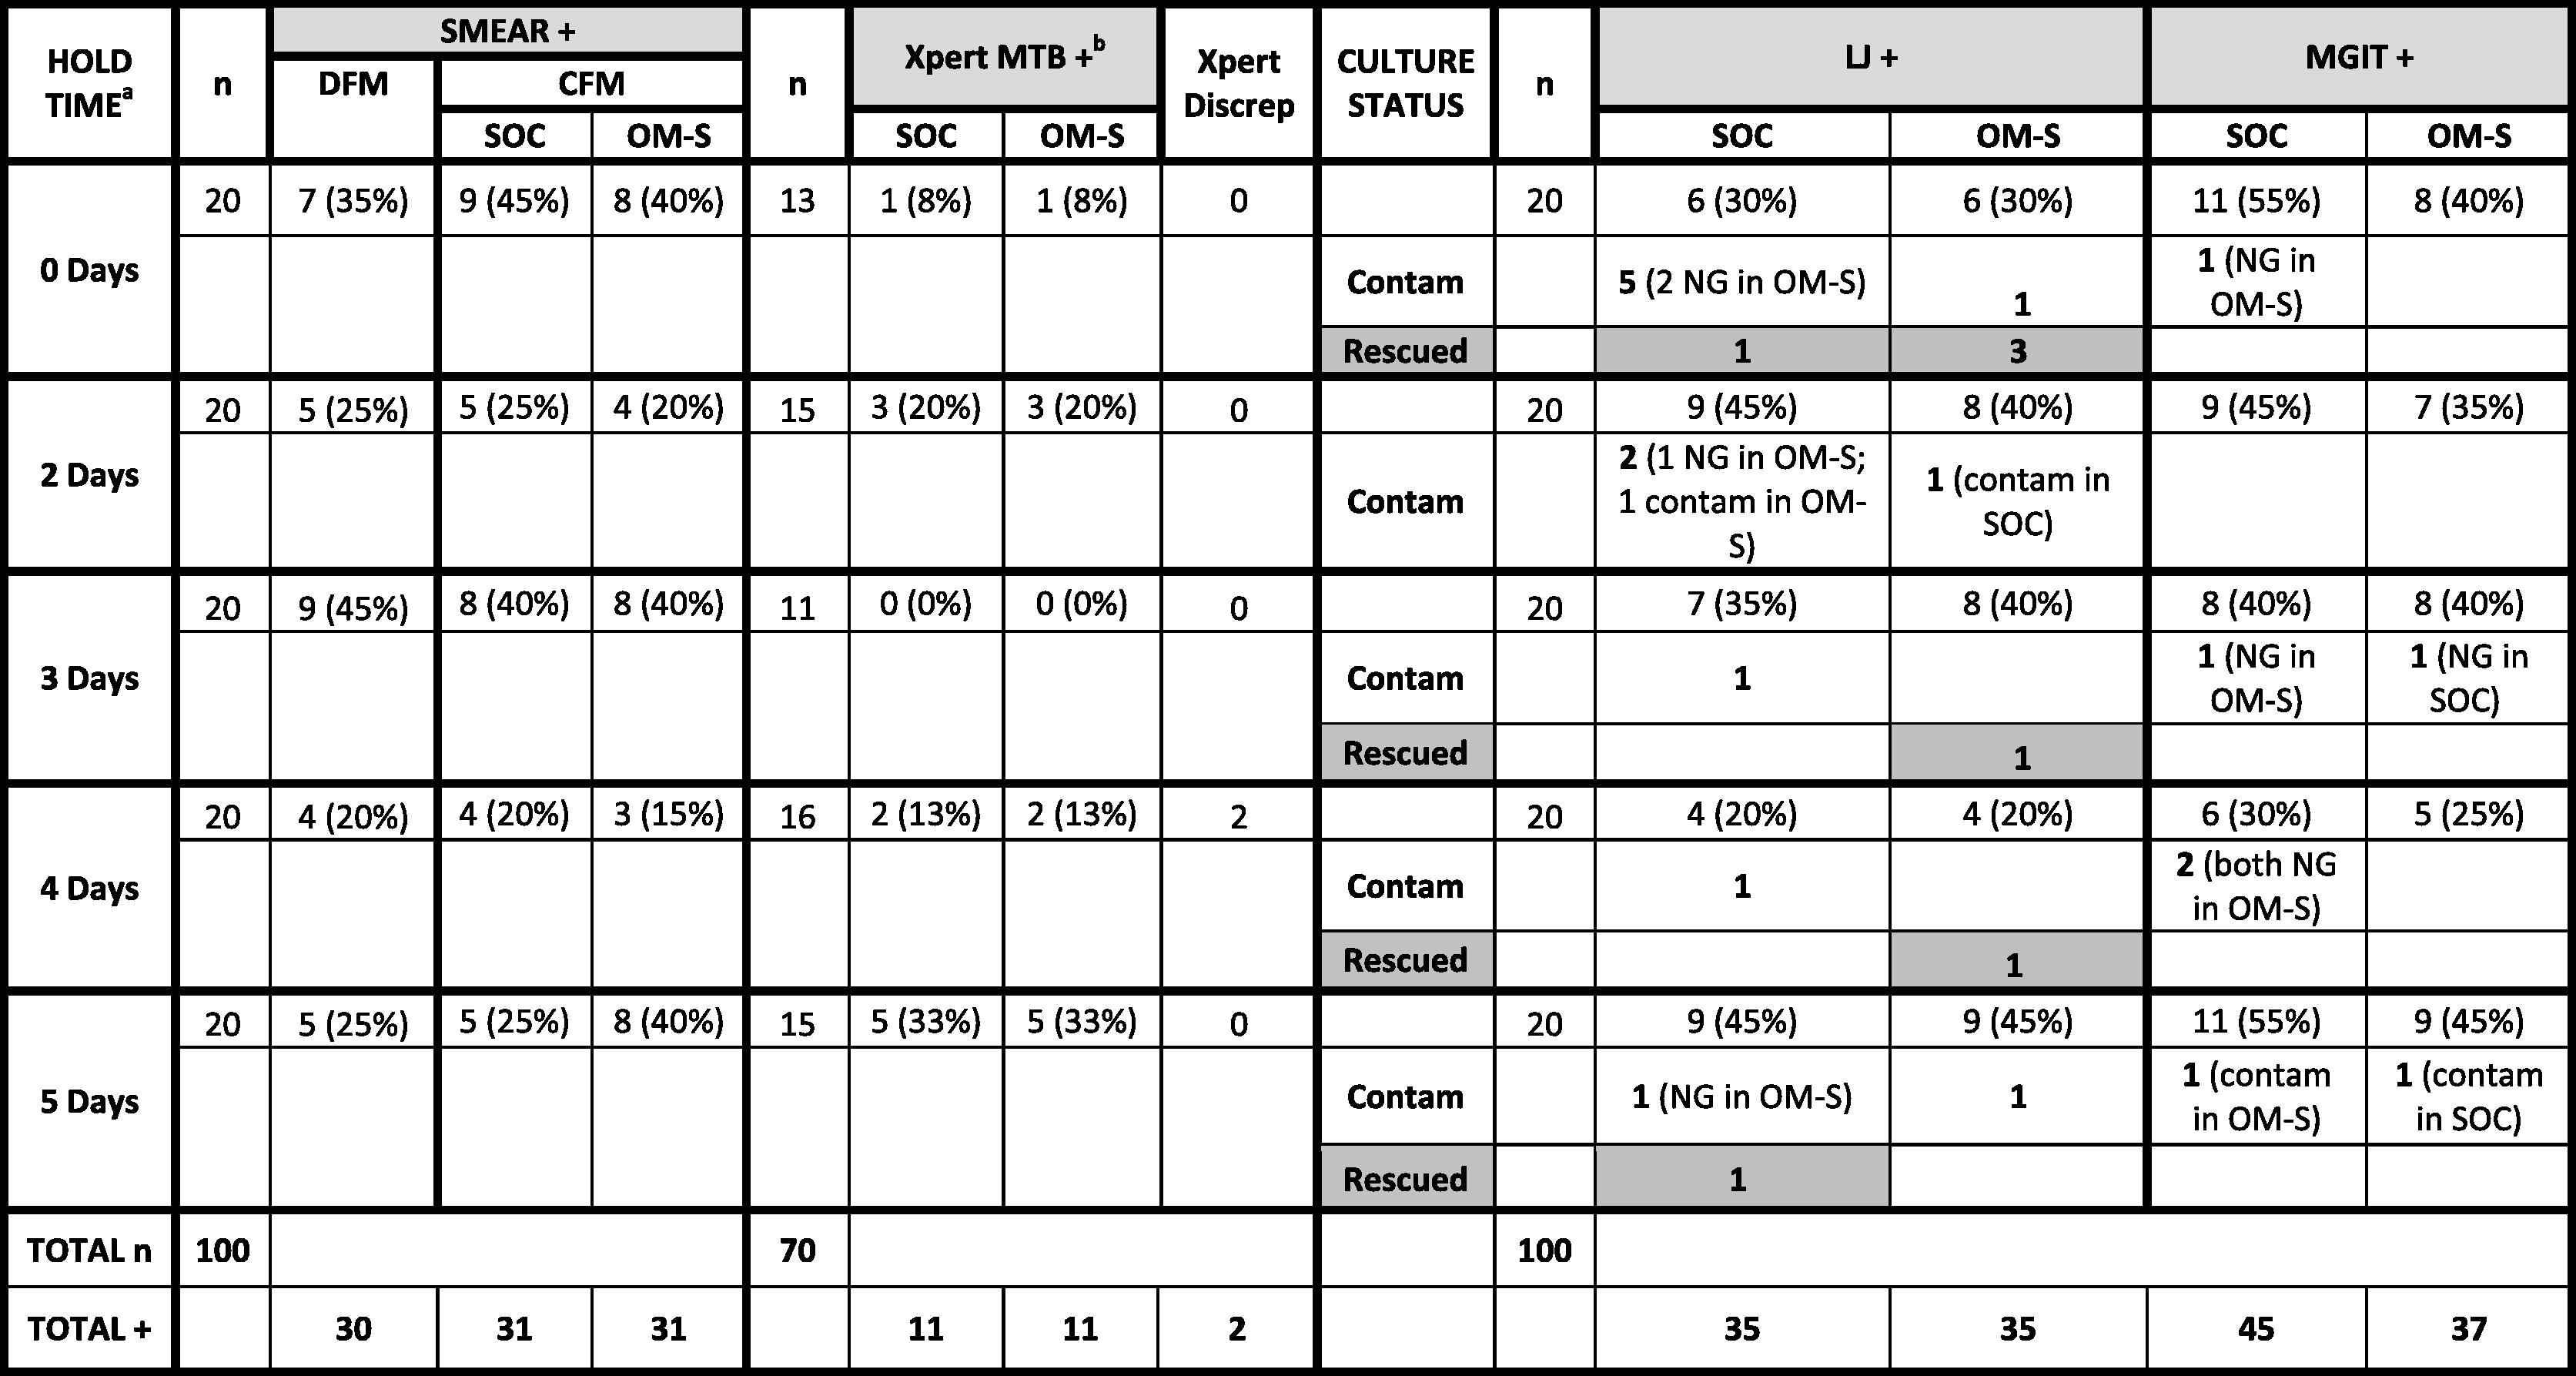
One hundred sputum samples were tested by DFM, CFM, and culture, and 70 samples by Xpert. Individual sample data are provided in Table S1, and Table 1 lists data according to OM-S hold time. As noted, the OM-S specimens (0–5-day holds at room temperature prior to testing) were all compared to SOC specimens tested “fresh” (no hold) (see Section 4.3).
 |
CFM = concentrated fluorescent microscopy; Contam = contaminated culture; DFM: direct fluorescent microscopy; Discrep = number of sample pairs with discrepant (mismatched) pos/neg results; LJ = Lowenstein Jensen; MGIT = mycobacteria growth indicator tube; MTB = Mycobacterium tuberculosis; NG = no growth; OM-S = OMNIgene·SPUTUM; SOC = standard-of-care; Rescued = a positive result obtained with one treatment versus contaminated culture with the other treatment.
a Hold times are for OM-S specimens only (all SOC specimens were tested on day of collection).
b Xpert was run only on specimen pairs where the direct fluorescent smear result was negative.
Comparison of results for the OMNIgene·SPUTUM and Standard-of-Care treatments, with findings listed for each of the OMNIgene·SPUTUM specimen hold times applied. [Note that all Standard-of-Care specimens were tested on day of collection (no hold)].
Comparisons of the OM-S and SOC groups’ proportional results overall (i.e., all hold times combined) are shown in Table 2. The two groups had the same positivity rates in the CFM results (31% positive and 69% negative for both groups), Xpert results (16% MTB-positive and 84% MTB-negative for both groups), and LJ culture results (SOC: 35% positive and 55% negative; OM-S: 35% positive and 62% negative). For MGIT, the OM-S results were similar to the OM-S LJ proportions (OM-S: 37% MGIT-positive and 61% MGIT-negative), whereas the SOC group had more positives with MGIT compared to LJ (SOC: 45% MGIT-positive, 50% MGIT-negative).
| Result | n | Proportion of SOC (%) | Proportion of OM-S (%) |
|---|---|---|---|
| CFM smear + | 100 | 31 | 31 |
| CFM smear − | 69 | 69 | |
| Xpert MTB + | 70a | 16 | 16 |
| Xpert MTB − | 84 | 84 | |
| LJ + | 100 | 35 | 35 |
| LJ − | 55 | 62 | |
| Contaminated | 10 | 3 | |
| Rescued | 2 | 5 | |
| MGIT + | 100 | 45 | 37 |
| MGIT − | 50 | 61 | |
| Contaminated | 5 | 2 | |
| Rescued | 0 | 0 |
CFM = concentrated fluorescent microscopy; LJ = Lowenstein Jensen culture; MGIT = mycobacteria growth indicator tube; OM-S = OMNIgene·SPUTUM; Rescued = a positive result obtained with one treatment versus contaminated culture with other treatment; SOC = standard-of-care.
Xpert was run only on specimen pairs where the direct fluorescent smear result was negative.
Comparison of overall diagnostic results for the OMNIgene®·SPUTUM and Standard-of-Care groups in each test.
Table 3 lists the findings for agreement between the two treatment methods for the four tests. The calculations for culture were derived from specimen pairs without contamination (i.e., n = 88 for LJ, n = 94 for MGIT; Table S1). Overall agreement between OM-S and SOC results (all hold times combined) for the tests ranged from 89% (MGIT) to 97% (Xpert). For the respective tests, concordance between treatment methods across the hold times ranged from 85% to 100% for CFM, 88% to 100% for Xpert, 83% (4-day hold) to 100% for MGIT, and 72% (5-day hold) to 100% for LJ. For all four tests, there was 100% agreement between the treatment methods in the 3-day hold category. Five specimen pairs had identical positive/negative mismatches in liquid and solid culture, respectively: one sample in each of the 0-, 2- and 4-day hold groups, and two samples in the 5-day group (Table S1).
| Hold time (days)a | CFM Smear | Xpert MTB | LJ | MGIT | ||||
|---|---|---|---|---|---|---|---|---|
| n | Agreement n (%) | n | Agreement n (%) | n | Agreement n (%)b | n | Agreement n (%) b | |
| 0 | 20 | 19 (95) | 13 | 13 (100) | 14 | 12 (86) | 19 | 16 (84) |
| 2 | 20 | 17 (85) | 15 | 15 (100) | 18 | 17 (94) | 20 | 18 (90) |
| 3 | 20 | 20 (100) | 11 | 11 (100) | 19 | 19 (100) | 18 | 18 (100) |
| 4 | 20 | 19 (95) | 16 | 14 (88) | 19 | 18 (95) | 18 | 15 (83) |
| 5 | 20 | 17 (85) | 15 | 15 (100) | 18 | 13 (72) | 19 | 17 (89) |
| Overall | 100 | 98 (92) | 70 | 68 (97) | 88 | 79 (90) | 94 | 84 (89) |
CFM = concentrated fluorescent microscopy; LJ = Lowenstein Jensen culture; MGIT = mycobacteria growth indicator tube; MTB = Mycobacterium tuberculosis.
Hold times are for OM-S specimens only (all SOC specimens were tested on day of collection).
Calculations for MGIT and LJ were based on only those specimen pairs that had no contamination (i.e., n = 94 for MGIT, n = 88 for LJ).
Agreement of diagnostic results for the OMNIgene·SPUTUM and standard-of-care (SOC) methods in each respective test, with values listed by OMNIgene·SPUTUM specimen hold time and overall.
Statistical analysis of intertest agreement (i.e., each respective culture or Xpert test compared with SOC MGIT as the reference; Table 4) revealed κ ranging from 0.68 (OM-S Xpert and SOC Xpert) to 0.77 (OM-S MGIT), and overall percent agreement values between 86% (SOC LJ culture) and 92% (SOC Xpert). For each test analyzed, the percent negative agreement relative to the standard [range, 88% (SOC LJ) to 95% (SOC Xpert)] was higher than the percent positive agreement [range, 74% (OM-S Xpert) to 87% (OM-S MGIT)]. OM-S LJ was the only test in which the proportional results differed significantly from the reference test results (p = 0.009).
| Comparisons to reference standard SOC MGIT a | |||||||
|---|---|---|---|---|---|---|---|
| Positive % agreement | Negative % agreement | Overall % agreement | kappa | Strength | 95% CI | p* | |
| OM-S MGIT | 87 | 90 | 88 | 0.766 | Substantial | 0.637–0.895 | 0.070 |
| OM-S LJ | 85 | 89 | 87 | 0.744 | Substantial | 0.612–0.876 | 0.009 |
| SOC LJ | 84 | 88 | 86 | 0.723 | Substantial | 0.585–0.862 | 0.096 |
| OM-S Xpert | 74 | 93 | 89 | 0.676 | Substantial | 0.457–0.894 | 0.131 |
| SOC Xpert | 81 | 95 | 92 | 0.678 | Substantial | 0.579–0.958 | 0.074 |
CI = confidence interval; LJ = Lowenstein-Jensen culture; MGIT = mycobacteria growth indicator tube; OM-S = OMNIgene·SPUTUM; SOC = standard-of-care.
Samples that were contaminated in SOC MGIT were excluded from the analysis (i.e., n = 95 for culture test comparisons, n = 65 for Xpert test comparisons).
Values for Chi-square testing; the only significant p value is bolded.
Results for statistical analysis of intertest agreement using Standard-of-Care MGIT as the reference test.
3.2. Culture contamination, rescues, and time-to-positive
The solid cultures had a higher contamination rate overall [13 (6.5%) of 200 LJ tubes contaminated versus 7 (3.5%) of 200 MGIT tubes; Table 2], with the largest number of contaminated LJ slants in the 0-days hold group (n = 5 SOC, n = 1 OM-S; Table 1). The OM-S-treated specimens (subjected to holds of 0–5 days) had a lower contamination rate than the SOC specimens (cultured on day of sputum collection; no hold time) in both culture types: 3% versus 10% for LJ, respectively, and 2% versus 5% for MGIT (Table 2). Rescues were only observed among LJ cultures (the culture type with greatest contamination): five rescues for OM-S-treated specimens (5% of all LJ culture pairs) versus two rescues for SOC specimens (2% of all LJ culture pairs) (Table 2).
Table 5 summarizes the MGIT TTP results. Overall, the average TTP for the SOC MGIT-positives was 7.6 days (n = 45; range across the hold categories, 5.5–8.8 days), whereas that for the OM-S MGIT-positives was 11.6 days (n = 37; range, 8.1–15.1 days). Regarding the 36 specimen pairs with both (OM-S and SOC) MGIT results positive, OM-S specimens became MGIT-positive an average of 5.6 days later than SOC specimens. For these 36 pairs, average ΔTTP ranged from 2.4 days (0 days hold time) to 7.7 days (5 days hold time).
| Hold time (days)a | SOC | OM-S | n | Average ΔTTP (days)b | ||
|---|---|---|---|---|---|---|
| n | Average MGIT TTP (days) | n | Average MGIT TTP (days) | |||
| 0 | 11 | 7.9 | 8 | 8.1 | 8 | 2.4 |
| 2 | 9 | 8.8 | 7 | 15.1 | 7 | 7 |
| 3 | 8 | 5.5 | 8 | 11.8 | 8 | 6.3 |
| 4 | 6 | 8.2 | 5 | 8.8 | 4 | 4.8 |
| 5 | 11 | 7.4 | 9 | 14.1 | 9 | 7.7 |
| Overall | 45 | 7.6 | 37 | 11.6 | 36 | 5.6 |
MGIT = mycobacteria growth indicator tube; OM-S: OMNIgene·SPUTUM; SOC = standard-of-care; TTP: time-to-culture-positive.
Hold times are for OM-S specimens only (all SOC specimens were tested on day of collection).
Values calculated only for the 36 specimen pairs with both MGIT results positive.
Results for time-to-culture-positive for the MGIT cultures, with values listed by OMNIgene·SPUTUM specimen hold time and overall.
3.3. Xpert results
Among the 70 Xpert-tested specimen pairs, 58 (83%) were MTB-negative in both treatment groups, 10 (12.5%) were MTB-positive in both groups, and two (3%; Samples 4197 and 4186 in the 4-day hold group) had discrepant results (Table S1, Table 6). All MTB-positive specimens were rifampicin-sensitive. For Sample 4197, the OM-S portion was low-positive while the SOC portion was MTB-negative. The corresponding CFM and culture results were all negative. For Sample 4186, the SOC specimen was low-positive while the OM-S specimen was MTB-negative. The corresponding CFM and LJ culture results were all negative, whereas the MGIT results aligned with the Xpert findings [SOC positive (TTP 15 days) and OM-S negative]. Table 6 lists the probe cycle threshold (Ct) values for all specimen pairs with an MTB-positive result.
| Hold time (days)a | ID | Treatment Method | CFM smear grade | Probe Ct values | |||||||
|---|---|---|---|---|---|---|---|---|---|---|---|
| A | B | C | D | E | SPC | QC-1 | QC-2 | ||||
| 0 | 4219 | SOC | Medium | 19.2 | 20.7 | 20 | 19.8 | 20.6 | 24.8 | 0 | 0 |
| OM-S | Medium | 20.7 | 22.2 | 21.4 | 21.7 | 21.9 | 23.6 | 0 | 0 | ||
| 2 | 4198 | SOC | Low | 25.9 | 27 | 26.4 | 27.7 | 27.4 | 25.1 | 0 | 0 |
| OM-S | Low | 25.4 | 26.3 | 25.6 | 26.9 | 26.8 | 24.5 | 0 | 0 | ||
| 4199 | SOC | Medium | 21.7 | 23.3 | 21.8 | 23.5 | 22.7 | 24.4 | 0 | 0 | |
| OM-S | V.Low | 29.7 | 29.4 | 29.7 | 30.3 | 30.9 | 24 | 0 | 0 | ||
| 4235 | SOC | Low | 22.9 | 24.2 | 23.1 | 24.3 | 24.1 | 24 | 0 | 0 | |
| OM-S | Low | 25.3 | 26.1 | 26 | 26.1 | 27.2 | 24.6 | 0 | 0 | ||
| 4 | 4197 | SOC | Neg | 0 | 0 | 0 | 0 | 0 | 25.3 | 0 | 0 |
| OM-S | Low | 25.4 | 26.6 | 25.9 | 26.5 | 26.6 | 25.6 | 0 | 0 | ||
| 4186 | SOC | Low | 32.5 | 31.2 | 32.4 | 32.4 | 34.1 | 24.7 | 0 | 0 | |
| OM-S | Neg | 0 | 0 | 0 | 0 | 0 | 26.3 | 0 | 0 | ||
| 4195 | SOC | Low | 27.1 | 28.5 | 28.3 | 29.2 | 29.3 | 26.8 | 0 | 0 | |
| OM-S | Low | 23.3 | 24.8 | 23.9 | 24.6 | 24.5 | 24.6 | 0 | 0 | ||
| 5 | 4178 | SOC | V.Low | 34.2 | 34.4 | 34 | 35 | 36.2 | 29.6 | 0 | 0 |
| OM-S | Low | 23.3 | 23.9 | 23.8 | 24 | 25 | 22.9 | 0 | 0 | ||
| 4179 | SOC | Low | 24.4 | 25.3 | 25 | 25.3 | 25.3 | 27.3 | 0 | 0 | |
| OM-S | Low | 22.5 | 23.4 | 23.2 | 23.5 | 24.4 | 29.7 | 0 | 0 | ||
| 4188 | SOC | V.Low | 34.2 | 34.1 | 34.2 | 35.9 | 37.3 | 30.3 | 0 | 0 | |
| OM-S | Low | 24.8 | 25.7 | 25.5 | 25.4 | 26.3 | 26.6 | 0 | 0 | ||
| 4232 | SOC | Medium | 18.9 | 20.3 | 19 | 20.3 | 20.3 | 23.2 | 0 | 0 | |
| OM-S | V.Low | 32.6 | 31 | 32.2 | 32.1 | 34 | 23.5 | 0 | 0 | ||
| 4236 | SOC | Medium | 21.5 | 23 | 22.4 | 22.5 | 23.3 | 24.5 | 0 | 0 | |
| OM-S | Medium | 19.8 | 21.3 | 20 | 21.3 | 21.4 | 23.2 | 0 | 0 | ||
CFM = concentrated fluorescent microscopy; Ct = cycle threshold; Neg = negative; OM-S = OMNIgene·SPUTUM (Xpert-tested using Concentrated Sputum protocol); SOC = standard-of-care (Xpert-tested using Raw Sputum protocol); V.Low = very low.
Hold times are for OM-S specimens only (all SOC specimens were tested on day of collection).
Summary of Xpert Ct values for all specimen pairs with at least one MTB-positive result.
4. Discussion
4.1. Smear microscopy and culture
The SOC and OM-S treatment groups had the same CFM positivity rate (31%) and high concordance (92%) (Tables 2 and 3). Of the eight pairs of CFM results that conflicted (i.e., negative/positive as opposed to a match), six had a positive result of scanty or 1+. The observed smear results discrepancies likely reflect biological variability between split portions of low-positive sputa. Investigations with larger sample sizes are warranted; however, it is noteworthy that OM-S samples performed comparably to SOC samples with respect to smear positivity, and splitting raw sputum would not be done during routine clinical testing.
Regarding MGIT testing, the SOC group had a higher overall culture positivity rate than the OM-S group (45% vs. 37%, respectively; Table 2). Overall agreement between the SOC MGIT and OM-S MGIT results was strong (≥88%; Tables 3 and 4), and agreement of these results across the respective OM-S hold times was also consistently high (≥83%; Tables 2 and 3). Analysis indicated substantial agreement (κ = 0.77) between the OM-S MGIT test and the reference test (SOC MGIT), and positive and negative percent agreement values were high as well (both ≥87%) (Table 4). This suggests that OM-S-treated sputum samples held/shipped without refrigeration for up to 5 days before MGIT testing perform comparably to NaOH/NALC-treated samples that are MGIT-cultured fresh (i.e., day of collection).
The 10 specimen pairs with MGIT results discrepancies were distributed across multiple hold times: three at 0 days, two at 2 days, three at 4 days, two at 5 days (Table S1). Among these, seven of the positives had TTP ≥ 10 days and the remaining positives were inconsistent with other test results, thus suggesting few bacilli present and/or variability due to sputum splitting. Even though all SOC specimens were MGIT-tested on day of collection, the OM-S specimens (tested after different hold times) had a lower overall MGIT contamination rate (5% vs. 2%, respectively). The two contaminated OM-S MGIT cultures were in the longer hold groups, and the corresponding SOC results were negative (3-day hold case) or contaminated (5-day hold case). Neither treatment mode (SOC or OM-S) was found to rescue the other group’s MGIT cultures. OM-S-treated specimens took, on average, 5.6 days longer to become MGIT-positive; this delay varied minimally (average, 4.8–7.7 days for 2- to 5-day holds) (Table 5). Although slightly longer TTP was observed, the overall MGIT positivity rate for the OM-S group was only 8% below the SOC group rate, and there was statistical agreement between the OM-S and SOC MGIT tests. The longer TTP had no effect on MGIT sensitivity; all positive samples were identified prior to the test cut-off of 42 days of incubation. This slightly prolonged TTP is worth noting, however, and additional studies might clarify the cause. Regardless, the extra days had no impact on final diagnoses.
Notably, Sample 4168 tested negative on all assays but grew nontuberculous mycobacteria in the OM-S MGIT tube only (Table S1). However, the corresponding Xpert Ct data (not shown) and smear-negative results suggest low bacillary load and sample splitting as the most probable explanation for nontuberculous mycobacteria detection in only one-half of the sample.
Regarding LJ testing, the OM-S and SOC groups had equal culture positivity rates (35%) and 90% results concordance (Tables 2 and 3). The OM-S LJ and SOC LJ tests were both in substantial agreement with the reference (κ = 0.74 and κ = 0.72, respectively), and the positive and negative percent agreement values were all ≥84% (Table 4). Statistics indicated possibly stronger agreement between OM-S LJ and the reference standard, as the 95% confidence interval (CI) for SOC LJ (0.585–0.862; Table 4) overlapped with the “moderate” agreement range (κ = 0.41–0.60), whereas the corresponding CI for OM-S LJ did not. In other words, the findings suggest that OM-S-treated sputum samples that are LJ-cultured after up to 5 days of no refrigeration (1) perform as well or better than NaOH/NALC-treated samples that are LJ-cultured fresh, and (2) perform comparably to NaOH/NALC-treated samples that are MGIT-cultured fresh.
Chi-square analysis identified OM-S LJ as the only proportional test results that were different from the reference test, SOC MGIT (p = 0.009). The intertest results for OM-S LJ (i.e., substantial strength of agreement with reference, and percent agreement values ≥84%) suggest that this statistical difference may not be clinically significant; however, the higher rate of positivity that was observed with SOC MGIT (45%) compared to the other tests (e.g., 31–37% positivity for OM-S MGIT, OM-S and SOC smear, and LJ) requires further investigation.
The nine specimen pairs with LJ results discrepancies between the treatment groups were distributed across multiple hold times: two at 0 days, one at 2 days, one at 4 days, five at 5 days (Table S1). Contamination issues were greater among solid cultures than among MGIT cultures, and the SOC group had a higher LJ culture contamination rate than the OM-S group (10% vs. 3%, respectively; Table 2). Further, OM-S treatment rescued more LJ cultures than SOC treatment did (5 vs. 2 rescues, respectively). The three contaminated OM-S LJ slants were in the 0-, 2- and 5-day hold groups; in one case, the SOC slant was also contaminated (Table S1).
4.2. Xpert MTB/RIF
Regarding Xpert testing (n = 70), the OM-S and SOC groups were tested with different Xpert protocols; however, no machine errors occurred among the 140 assays and Ct values for specimen pairs were concordant (e.g., Table 6), indicating no concerns of OM-S interference with the probes or test processes. The OM-S and SOC groups had equal MTB-positivity rates (16%) and also very strong overall agreement of diagnostic results (97%) (Tables 2 and 3).
The OM-S Xpert and SOC Xpert tests were both in substantial agreement with the reference test (κ = 0.68 for both); however, CIs overlapped with the moderate range (Table 4), suggesting possibly weaker agreement than was observed with OM-S MGIT and OM-S LJ culture. The positive percent agreement values for the OM-S Xpert and SOC Xpert tests (71% and 81%, respectively) were both lower than observed with the other tests analyzed (OM-S MGIT, OM-S LJ, and SOC LJ), whereas the negative percent agreement values (95% and 93%, respectively) were higher. Overall, the findings suggest that OM-S-treated sputum samples that are held/shipped without refrigeration for up to 5 days prior to Xpert testing (1) perform as well as NaOH/NALC-treated samples that are Xpert-tested fresh, and (2) perform comparably to NaOH/NALC-treated samples that are MGIT-cultured fresh. The percent agreement values suggest possible lower sensitivity and higher specificity for Xpert tests relative to the other tests analyzed; however, this applies equally to OM-S-treated samples that are held up to 5 days, and NaOH/NALC-treated samples that are tested fresh. Also, the sample size for intertest agreement analysis of the Xpert tests was considerably lower than that for the culture tests (n = 65 vs. n = 95, respectively) (see Section 4.3).
The two specimen pairs with conflicting Xpert results (Samples 4197 and 4186; Table S1 and Table 6) were both in the 4-day hold group. Considering that all other test results for Sample 4197 were negative, it is possible that the OM-S MTB-positive result was a false-positive; however, this Xpert result was low-positive and could reflect variability introduced by sample splitting. Studies with larger sample size could help distinguish between false-positive and false-negative findings in such instances. In the case of Sample 4186, the SOC low-positive Xpert result is unlikely to be a false-positive since this patient’s SOC MGIT culture was also positive; however, sample splitting could explain the missed OM-S result in this case because the all-negative results on CFM smear and LJ culture indicate that this patient’s sputum samples did not have a high bacillary load.
4.3. Study limitations
Given that this was an operational study, SOC specimens were treated per the normal clinical algorithm to ensure appropriate patient care; however, the lack of matched hold times for SOC samples was a limitation. Our design balanced clinical needs with experimental research, and we applied the most challenging reference point (i.e., comparison to fresh SOC samples) to measure OM-S performance.
Our sample size for Xpert was limited; however, it is important to report these data considering how Xpert testing is positioned in many programs’ diagnostic algorithms. The Uganda study sites specify Xpert testing for smear-negative specimens only; thus, a very small proportion of MTB-positives are expected. Confirmation of OM-S compatibility with the Xpert assay is relevant, especially given the anticipated low bacillary loads in these samples and the critical clinical results. In this study, up to 5-day holds in OM-S did not interfere with Xpert testing.
5. Conclusions
This study demonstrates that OM-S-treated samples transported multiple days without cold chain may perform as well as fresh NaOH-NALC-processed samples in smear, MGIT and LJ culture, and Xpert. While there was good MTb detection with OM-S MGIT, the cause of slightly prolonged TTP requires further investigation. OM-S may be a useful tool for TB programs that face delays between sputum collection and testing. These findings support larger feasibility studies.
Conflicts of interest
CD Kelly-Cirino was employed by DNA Genotek during the execution of the study and the writing of the manuscript. PS Curry is employed by DNA Genotek.
Acknowledgments
The authors wish to acknowledge the patients who participated in this study; the staff and administration of Mulago Hospital; our colleagues Dr. William Worodria and Dr. J. Lucian Davis, the clinical, research, and administrative staff of the MU-UCSF Research Collaboration, especially Emily Chang and Catherine Nabakiibi.
Appendix A. Supplementary data
Supplementary data associated with this article can be found, in the online version, at http://dx.doi.org/10.1016/j.jegh.2017.04.001.
References
Cite this article
TY  - JOUR
AU  - C.D. Kelly-Cirino
AU  - E. Musisi
AU  - P. Byanyima
AU  - S. Kaswabuli
AU  - A. Andama
AU  - A. Sessolo
AU  - I. Sanyu
AU  - J. Zawedde
AU  - P.S. Curry
AU  - L. Huang
PY  - 2017
DA  - 2017/04/13
TI  - Investigation of OMNIgene·SPUTUM performance in delayed tuberculosis testing by smear, culture, and Xpert MTB/RIF assays in Uganda
JO  - Journal of Epidemiology and Global Health
SP  - 103
EP  - 109
VL  - 7
IS  - 2
SN  - 2210-6014
UR  - https://doi.org/10.1016/j.jegh.2017.04.001
DO  - 10.1016/j.jegh.2017.04.001
ID  - Kelly-Cirino2017
ER  -