
Work productivity among adults with varied Body Mass Index: Results from a Canadian population-based survey
- DOI
- 10.1016/j.jegh.2014.08.001How to use a DOI?
- Keywords
- Absenteeism; Body Mass Index; Presenteeism; Work productivity
- Abstract
Background: The relationship between Body Mass Index (BMI) and work productivity, including absenteeism and presenteeism remains unclear. The objective of this study was to examine work productivity among adults with varied BMI using population-based data.
Methods: Data source was the 2009–2010 Canadian Community Health Survey. The outcomes reflected work absence (absenteeism) and reduced activities at work (presenteeism). The key explanatory variable was BMI in six categories. Logistic regressions were used to measure the association between outcome and explanatory variables adjusting for potential confounders.
Results: The sample consisted of 56,971 respondents ranging in age from 20 to 69 years. Relative to normal BMI, the odds of absenteeism were higher for those in the obesity class III (OR = 1.60, 95% CI: 1.39; 1.83). Presenteeism was weakly associated with all obesity categories (OR = 1.49, 95% CI: 1.38; 1.61, for obesity class I). Overweight was marginally associated with absenteeism and presenteeism. Underweight was inversely associated with absenteeism.
Conclusions: This study found that obesity is an independent risk factor for reduced work productivity. Both absenteeism and presenteeism were associated with obesity. However, being overweight was weakly associated with work productivity.
- Copyright
- © 2014 Ministry of Health, Saudi Arabia. Published by Elsevier Ltd.
- Open Access
- This is an open access article under the CC BY-NC-ND license (http://creativecommons.org/licenses/by-nc-nd/4.0/).
1. Introduction
Obesity is an increasing public health problem that imposes a significant burden to healthcare systems. Overweight and obesity are factors of higher mortality and morbidity [1], and several of the most common chronic medical conditions in adults, including cardiovascular diseases, type 2 diabetes mellitus and cancer, are associated with obesity [2]. Obesity is independently associated with elevated healthcare costs being responsible for approximately 4% and 6% of the total health expenditures in Canada and the United States, respectively [3,4]. In addition to the direct economic burden of obesity, costs outside medical expenditures related to decreased work productivity have been previously recognized [5,6].
Work productivity losses are mainly measured by absenteeism and presenteeism [7]. Absenteeism is defined as the days of absence from work because of illness. Cross-sectional studies have found an association between absenteeism and obesity [8–11]. Prospective studies performed in different industrial settings found that obese employees had a higher illness-absence rate and a longer duration of absence [12,13]. However, a large cohort study found that central abdominal fatness, but not BMI, was a risk factor of sickness absence [14]. Two systematic reviews have documented a positive relationship between obesity and the number of sick leave days. For overweight workers data are not conclusive, but the evidence points to either a increased or a neutral level of absenteeism compared with normal weight [15,16]. Presenteeism occurs when an employee chooses to be present at work despite feeling ill or when sick leave would be appropriate. This may cause the employee to work at a reduced capacity with subsequent productivity losses [17]. Obese employees report higher presenteeism rates. Moderately and severely obese workers showed limitations with respect to the time needed to complete tasks and the ability to perform physical job demands, whereas mildly obese employees were found to have no or fewer health-related loss in productivity [18–20].
Although prospective studies have addressed the question of relationship between BMI and work productivity, the relationship between overweight and work productivity remains unclear. A population-based study can test whether the association is consistent in a large sample representative of a variety of workplaces and geographic locations, adding external validity to the conclusions about this association. Thus, the primary objective of the present study was to examine the effect of BMI on absenteeism and presenteeism considering adjustment for the possible confounding variables.
2. Materials and methods
2.1. Data source and sample selection
Participants were respondents to the Canadian Community Health Survey (CCHS) 2009–2010. The CCHS is a national survey of people aged 12 and over that is conducted by Statistics Canada on an ongoing basis with data released every year [21]. The CCHS has a cross-sectional design and collects information using a complex stratified multistage cluster sampling method. The CCHS 2009–2010 collected responses from people living in private occupied dwellings in 121 health regions covering all provinces in Canada. The sampling frame excluded individuals living in Indian reserves and Crown lands, institutional residents, full-time members of the Canadian armed forces, and residents of certain remote regions. Data were collected by using in-person and phone interviews. Interviewers underwent extensive training and a system of monitoring and validation ensured quality data. The 2009–2010 CCHS provided a sample of 124,188 individuals with an overall response rate of 72.3%. A detailed description of the survey methodology has been published elsewhere [21].
In the CCHS 2009–2010, respondents were asked questions related to their working status and the reduction of activities at work due to health problems [22]. From the 2009–2010 CCHS database, an analytical sample was extracted consisting of individuals aged 20–69 years who reported having a job in the week prior to the survey administration and who provided valid responses regarding working status, reduced activity at work, height and weight, physical activity and any chronic conditions. Questions related to age, sex, education, income, physical activity and chronic diseases were considered for possible confounder factors. Invalid responses to all of these questions were excluded from the analysis.
2.2. Study variables
Absenteeism and presenteeism were separately examined and considered in different models. The two primary outcome variables of interest were absenteeism and presenteeism, both coded as binary variables (yes/no). Absenteeism was derived from the CCHS question: “Last week, did you have a job or business from which you were absent?” with two possible responses – yes or no. Absenteeism was defined as those who answered “yes” to this question. The CCHS data did not indicate whether the absence from work was due to illness or other non-health related reasons. Presenteeism was derived from the question: “Does a long-term physical condition or mental condition or health problem reduce the amount or the kind of activity you can do at work?” This question was formulated in present time with three possible responses: “sometimes, often, or never.” Presenteeism was defined with the answers “sometimes” or “often” reduced activities at work due to long-term physical or mental conditions.
The primary explanatory variable, BMI, included five categories corresponding to the World Health Organization (WHO) classification of BMI in kg/m2: Normal (18.5–25), underweight (less than 18.5), overweight (25–30), obesity class I (30–35), obesity class II (35–40), and obesity class III (over 40) [23]. BMI was calculated from self-reported height and weight in the CCHS. Possible confounder variables were selected a priori choosing those possibly associated with obesity and work productivity. Co-variables considered included sex, age (considered categorically as 20–29, 30–39, 40–49, 50–59 and 60–69 years), highest level of education (less than secondary, secondary graduation, some post-secondary and post-secondary graduation), personal income in Canadian dollars, CAD (less than $20,000, $20,000–$39,999, $40,000–$59,999, $60,000 or higher, and not stated), chronic diseases (no chronic disease or at least a chronic condition, including hypertension, diabetes mellitus, heart disease, previous stroke, asthma, chronic obstructive pulmonary disease, arthritis, chronic back pain, diagnosed digestive disorder, migraine, cancer, and mood and anxiety disorder), and physical activity (leisure time physical activity index, a derived variable in the CCHS [21], considered inactive, moderately active and active as possible categories).
2.3. Statistical analysis
Descriptive statistics of the distribution of covariates with respect to the outcomes were summarized. The frequencies of absenteeism and presenteeism by categories of BMI and covariates were calculated. Bi-variable logistic regression was used to examine the relationship between the independent variables with absenteeism and presenteeism. Multivariable logistic regression was used to provide adjusted odds ratios (OR) of the associations with 95% confidence intervals (CI). To account for the different probabilities that individuals were selected in the CCHS sample, all analyses included rescaled weights obtained by dividing the sampling frequency weights included in the 2009–2010 CCHS database by the mean of the weights in the analytical sample [22]. All analyses were performed using SAS statistical software version 9.3 (SAS Institute Inc., NC).
3. Results
A total of 56,971 respondents met the selection criteria and were included in the final analysis. Fig. 1 shows the sample selection process. Overall, 643 (1.2%) respondents did not provide valid answers to the questions on education, physical activity and chronic conditions and were excluded from the analysis. The distribution of the sample by categories of BMI and health-related factors varied widely (Table 1). The majority of respondents (43.9%) reported a normal BMI with 20.3% of the employed population falling into one of the three categories of obesity.
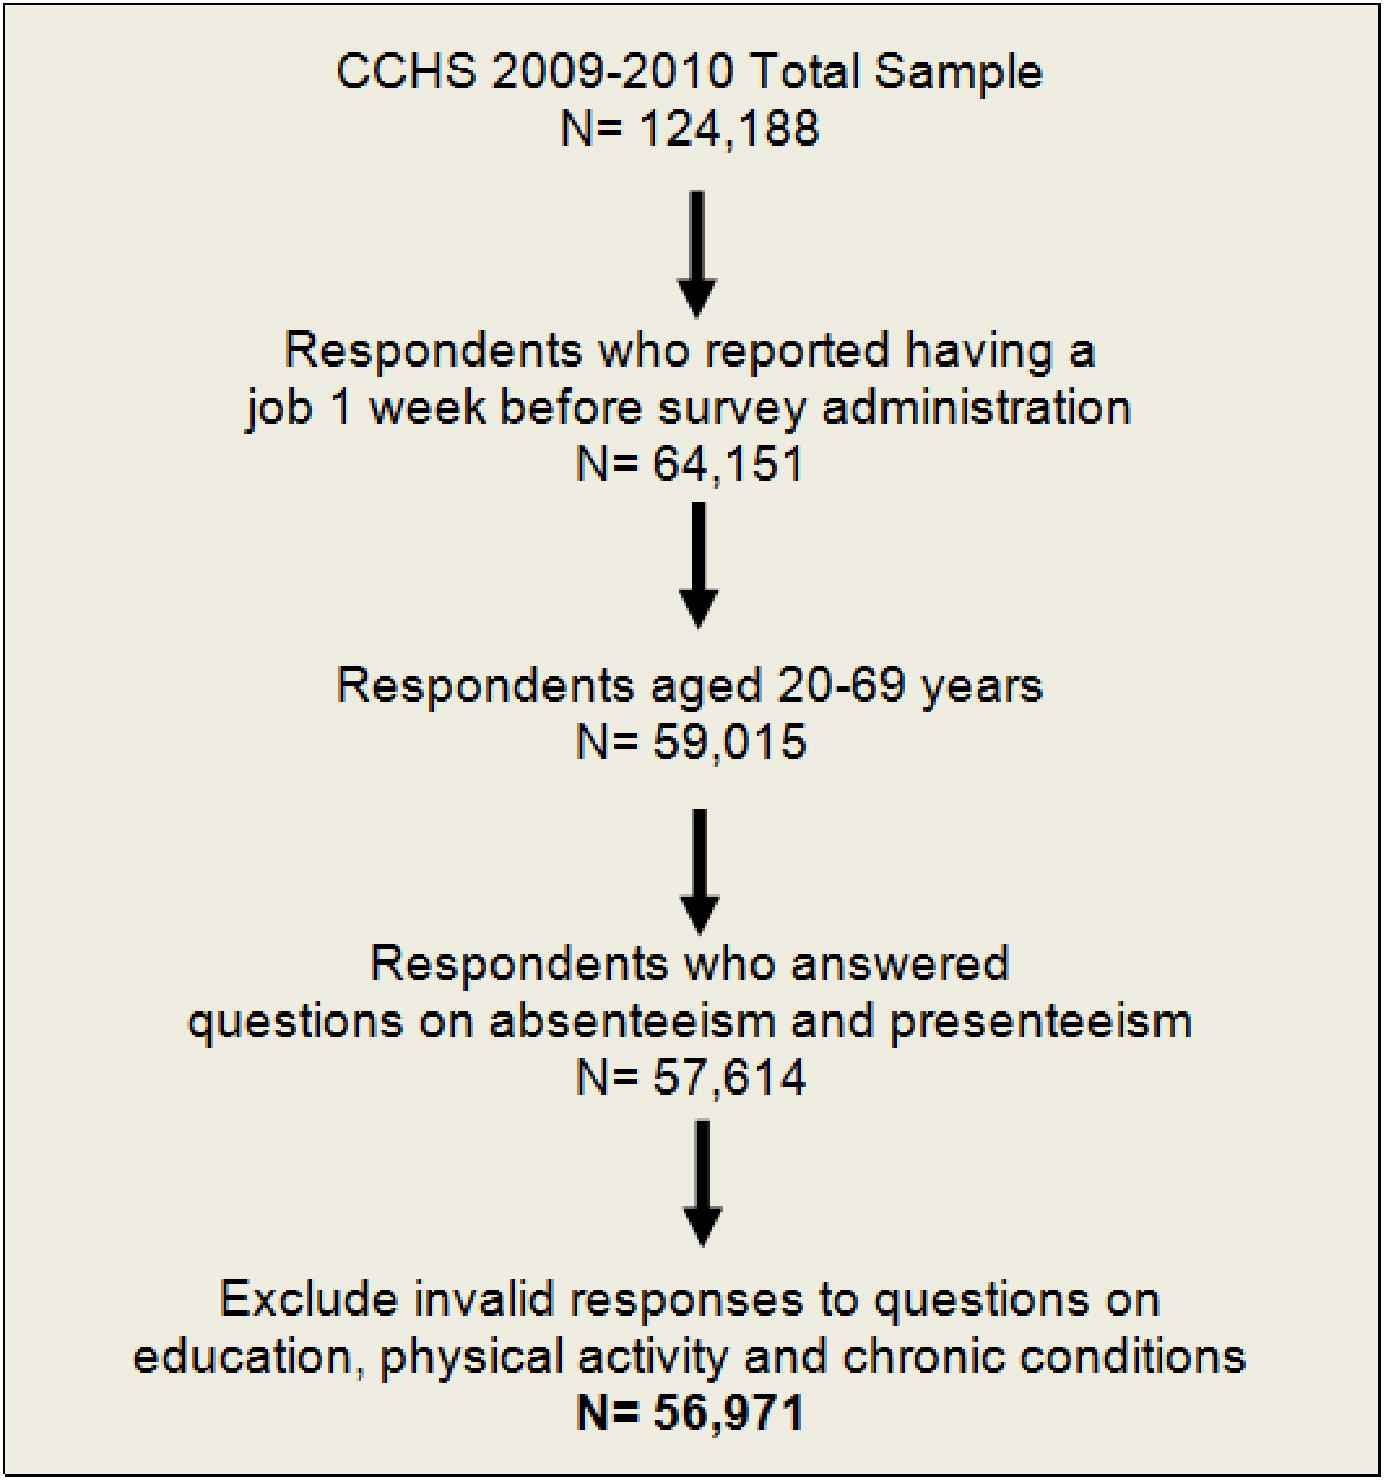
Flow chart showing the selection of participants.
| Total sample | ||
|---|---|---|
| N = 56,971 | % | |
| BMI class | ||
| Underweight | 1150 | 2.1 |
| Normal (healthy weight) | 25,043 | 43.9 |
| Overweight | 19,238 | 33.7 |
| Obese class I | 7131 | 12.5 |
| Obese class II | 1913 | 3.4 |
| Obese class III | 2496 | 4.4 |
| Sex | ||
| Male | 30,159 | 52.9 |
| Female | 26,812 | 47.1 |
| Age | ||
| 20–29 years | 12,153 | 21.3 |
| 30–39 years | 12,398 | 21.8 |
| 40–49 years | 15,097 | 26.5 |
| 50–59 years | 13,078 | 22.9 |
| 60–69 years | 4245 | 7.5 |
| Education | ||
| Less than secondary | 4390 | 7.7 |
| Secondary graduation | 9012 | 15.8 |
| Some post-secondary | 4087 | 7.2 |
| Post-secondary graduation | 39,482 | 69.3 |
| Income (CAD) | ||
| <–20,000 | 7000 | 12.3 |
| 20,000–39,999 | 14,697 | 25.8 |
| 40,000–59,999 | 12,179 | 21.4 |
| 60,000–> | 16,594 | 29.1 |
| Not stated | 6501 | 11.4 |
| Physical activity | ||
| Active | 15,032 | 26.4 |
| Moderately active | 14,531 | 25.5 |
| Inactive | 27,408 | 48.1 |
| Chronic conditions* | ||
| No chronic disease | 29,658 | 52.1 |
| Any chronic disease | 27,313 | 47.9 |
See text for description of chronic conditions included.
Distribution of the sample by Body Mass Index (BMI) category and health-related characteristics (weighted analysis).
Table 2 shows the frequencies of reported absenteeism and presenteeism by categories of BMI and health-related characteristics. The prevalence of absenteeism was slightly different among BMI groups except for obesity class III that exhibited 11.0% absenteeism as compared with 7.0% of those with a normal BMI. In the underweight category only 4.4% of respondents reported absenteeism. There was a substantial difference in the prevalence of presenteeism between obesity categories compared with normal weight, with 18.1% and 10.1% for obesity class II and normal weight, respectively. There were differences in the distribution of absenteeism and presenteeism among categories of health-related variables. The prevalence of absenteeism differed by gender, with women showing a higher proportion (8.8%) than men (6.1%). Absenteeism prevalence was higher (8.3%) in the physically active group and those who reported some chronic condition (8.0%). With respect to presenteeism, there was a higher prevalence in women (13.8%) compared with men (11.4%). The groups with less education and income reported higher proportions of presenteeism. Presenteeism prevalence was substantially higher in the physically inactive group (14.5%) and participants who reported some chronic condition (21.9%).
| Absent from work last week (absenteeism) | Reduced activities at work (presenteeism) | |||
|---|---|---|---|---|
| N | % | N | % | |
| BMI class | ||||
| Underweight | 50 | 4.4 | 105 | 9.2 |
| Normal (healthy weight) | 1754 | 7.0 | 2522 | 10.1 |
| Overweight | 1425 | 7.4 | 2443 | 12.7 |
| Obese class I | 513 | 7.2 | 1306 | 18.3 |
| Obese class II | 167 | 8.8 | 346 | 18.1 |
| Obese class III | 275 | 11.0 | 405 | 16.2 |
| Sex | ||||
| Male | 1829 | 6.1 | 3427 | 11.4 |
| Female | 2356 | 8.8 | 3699 | 13.8 |
| Age | ||||
| 20–29 years | 769 | 6.3 | 996 | 8.2 |
| 30–39 years | 951 | 7.7 | 1185 | 9.6 |
| 40–49 years | 1076 | 7.1 | 2198 | 14.5 |
| 50–59 years | 1014 | 7.7 | 2098 | 16.0 |
| 60–69 years | 374 | 8.8 | 651 | 15.3 |
| Education | ||||
| Less than secondary | 364 | 8.3 | 730 | 16.6 |
| Secondary graduation | 581 | 6.5 | 1170 | 13.0 |
| Some post-secondary | 272 | 6.7 | 589 | 14.4 |
| Post-secondary graduation | 2967 | 7.5 | 4637 | 11.8 |
| Income (CAD) | ||||
| <–20,000 | 531 | 7.6 | 1104 | 15.7 |
| 20,000–39,999 | 1111 | 7.6 | 1990 | 13.5 |
| 40,000–59,999 | 843 | 6.9 | 1473 | 12.1 |
| 60,000–> | 1293 | 7.8 | 1832 | 11.1 |
| Not stated | 407 | 6.3 | 726 | 11.2 |
| Physical activity | ||||
| Active | 1246 | 8.3 | 1472 | 9.8 |
| Moderately active | 1134 | 7.8 | 1683 | 11.6 |
| Inactive | 1804 | 6.6 | 3971 | 14.5 |
| Chronic conditions | ||||
| No chronic disease | 1990 | 6.7 | 1140 | 3.9 |
| Any chronic disease | 2194 | 8.0 | 5986 | 21.9 |
Prevalence of reported absenteeism and presenteeism by categories of BMI and health-related characteristics (weighted analysis).
Table 3 displays the results of bivariable and multivariable analyses. In the unadjusted analysis, the odds of absenteeism were higher among respondents in the obesity classes II and III compared with those in the normal weight category (OR = 1.64, 95% CI: 1.43; 1.87, for obesity class III). In the multivariable model adjusted for sex, age, education, income, physical activity and chronic conditions, the odds of absenteeism remained elevated, with the highest odds still observed for obesity class III (OR = 1.60, 95% CI: 1.39; 1.83). Compared with normal weight, overweight and obesity class I categories had slightly higher odds of absenteeism. The odds of absenteeism were reduced in the underweight group. The odds of presenteeism were higher for overweight and all obesity categories in the unadjusted analysis (OR = 2.00, 95% CI: 1.86; 2.15, for obesity class I); however, in the adjusted analysis, overweight and obesity were weakly associated with presenteeism (OR = 1.49, 95% CI: 1.38; 1.61, for obesity class I). In the adjusted analysis, the estimated ORs for obesity classes II and III were 1.26 and 1.36, respectively, whereas the estimated OR for obesity class I was 1.49; however, confidence intervals overlapped.
| Absent from work last week (absenteeism) | Reduced activities at work (presenteeism) | |||
|---|---|---|---|---|
| Unadjusted OR (95% CIs) | Adjusted OR (95% CIs) | Unadjusted OR (95% CIs) | Adjusted OR (95% CIs) | |
| BMI class | ||||
| Normal (healthy weight) | Ref.* | Ref. | Ref. | Ref. |
| Underweight | 0.60 (0.48–0.81) | 0.61 (0.46–0.82) | 0.90 (0.73–1.10) | 0.92 (0.74–1.14) |
| Overweight | 1.06 (0.98–1.14) | 1.14 (1.06–1.23) | 1.30 (1.30–1.38) | 1.16 (1.09–1.24) |
| Obesity class I | 1.03 (0.93–1.14) | 1.10 (0.99–1.22) | 2.00 (1.86–2.15) | 1.49 (1.38–1.61) |
| Obesity class II | 1.27 (1.08–1.50) | 1.32 (1.12–1.56) | 1.97 (1.74–2.22) | 1.26 (1.11–1.44) |
| Obesity class III | 1.64 (1.43–1.87) | 1.60 (1.39–1.83) | 1.73 (1.54–1.94) | 1.36 (1.21–1.53) |
| Sex | ||||
| Male | Ref. | Ref. | Ref. | Ref. |
| Female | 1.49 (1.40–1.59) | 1.57 (1.47–1.68) | 1.24 (1.18–1.31) | 1.10 (1.04–1.16) |
| Age | ||||
| 20–29 years | Ref. | Ref. | Ref. | Ref. |
| 30–39 years | 1.23 (1.11–1.36) | 1.19 (1.07–1.31) | 1.18 (1.09–1.29) | 1.10 (0.99–1.20) |
| 40–49 years | 1.14 (1.03–1.25) | 1.08 (0.98–1.20) | 1.91 (1.77–2.07) | 1.55 (1.42–1.69) |
| 50–59 years | 1.25 (1.13–1.37) | 1.18 (1.06–1.31) | 2.14 (1.98–2.32) | 1.45 (1.33–1.59) |
| 60–69 years | 1.43 (1.26–1.63) | 1.38 (1.21–1.58) | 2.03 (1.83–2.26) | 1.17 (1.05–1.31) |
| Education | ||||
| Less than secondary | Ref. | Ref. | Ref. | Ref. |
| Secondary graduation | 0.79 (0.67–0.93) | 0.77 (0.65–0.91) | 0.85 (0.75–0.95) | 1.13 (0.99–1.27) |
| Some post-secondary | 0.89 (0.80–1.01) | 0.82 (0.73–0.93) | 0.67 (0.61–0.73) | 0.89 (0.81–0.98) |
| Post-second. graduation | 0.76 (0.66–0.87) | 0.74 (0.64–0.85) | 0.75 (0.68–0.83) | 0.90 (0.81–1.01) |
| Income (CAD) | ||||
| <–20,000 | Ref. | Ref. | Ref. | Ref. |
| 20,000–39,999 | 0.99 (0.89–1.11) | 1.01 (0.91–1.13) | 0.84 (0.77–0.91) | 0.83 (0.76–0.90) |
| 40,000–59,999 | 0.91 (0.81–1.02) | 0.95 (0.85–1.07) | 0.74 (0.68–0.80) | 0.72 (0.66–0.79) |
| 60,000–> | 1.03 (0.93–1.14) | 1.11 (0.99–1.25) | 0.66 (0.61–0.72) | 0.65 (0.60–0.72) |
| Not stated | 0.81 (0.71–0.93) | 0.84 (0.73–0.96) | 0.67 (0.61–0.74) | 0.71 (0.64–0.79) |
| Physical activity | ||||
| Active | Ref. | Ref. | Ref. | Ref. |
| Moderately active | 0.94 (0.86–1.02) | 0.89 (0.82–0.97) | 1.21 (1.12–1.30) | 1.08 (0.99–1.16) |
| Inactive | 0.78 (0.72–0.84) | 0.72 (0.67–0.78) | 1.56 (1.47–1.66) | 1.29 (1.20–1.37) |
| Chronic conditions | ||||
| No chronic disease | Ref. | Ref. | Ref. | Ref. |
| Any chronic disease | 1.21 (1.14–1.29) | 1.13 (1.06–1.21) | 7.02 (6.57–7.50) | 6.32 (5.91–6.73) |
Ref.: Reference category.
Logistic regression results for the relationship between Body Mass Index (BMI) with absenteeism and presenteeism (weighted analyses).
In terms of the confounders, women had higher odds of absenteeism compared with men. Those between 60 and 69 years of age were more likely to be absent from work. Respondents with the lower level of education were more likely to be absent from work as compared with respondents in other educational categories. Income showed a dose–response relationship with presenteeism, as those with lower income were more likely to report decreased activities at work. The odds of absenteeism were lower in the physically inactive group as compared with the physically active group; however, the odds of presenteeism were slightly higher in the physically inactive group. There was a small difference in the odds of absenteeism between individuals with chronic conditions compared to those with no chronic condition; however, a strong association between chronic disease and presenteeism was observed.
4. Discussion
This population-based study found a weak but positive association between BMI and work productivity. This study found that the likelihood of absenteeism was higher among respondents with a BMI greater than 40, and the likelihood of presenteeism was mildly increased for all categories of obesity. These findings are in line with past research, as a large observational study and a systematic review have reported obesity as a predictor of absenteeism [15,24]. Similarly, obesity has been found to be a determinant of presenteeism [20]. Nevertheless, studies examining overweight as a predictor of absenteeism or presenteeism are inconclusive [16,25]. It was found that, compared with normal weight, overweight but not obese workers were at a slightly higher risk of absenteeism and presenteeism. A direct relationship between BMI and several health conditions such as hypertension and heart disease has been demonstrated, and this can explain the effect of moderate increases of BMI on work productivity. Interestingly, respondents in the underweight group were less likely to report absence from work. This finding could be explained by the fact that most workers in the underweight category in this sample were close to a normal BMI and individuals in the lower range of a normal BMI tend to be healthier.
This study found that absenteeism was slightly higher in women and presenteeism was higher in older participants. A higher level of absenteeism was reported by individuals with less education. In this analysis, individuals in the lower income category reported a higher proportion of presenteeism. People who reported higher levels of physical activity were less likely to report presenteeism. Substantially, higher rates of presenteeism were found for individuals with chronic conditions. These findings are similar to those in previous research. Higher presenteeism rates have been reported in workers with less income [26,27]. This may be explained by the financial need of workers with lower income and the risk of being present at work even when sick leave may be indicated. As in previous research, the presence of a chronic condition was a strong predictor of presenteeism [28], although there is limited evidence of a relationship between physical activity and presenteeism [29].
Both absenteeism and presenteeism have been measured in different ways. Measuring presenteeism has been particularly challenging since many jobs do not have easily measurable outputs [7]. The CCHS questions captured absence from work and reduced activities at work without specifying time or duration. Respondents’ self-report of absence from work in the last week and reduced activities at work reported as “often” and “sometimes” were used for the definition of absenteeism and presenteeism, respectively. Thus the prevalences of absenteeism and presenteeism shown in this study are relative proportions used only to compare categories of BMI. Significant differences in these frequencies were found. It is noteworthy that there is a difference in the proportion of presenteeism between obesity class II (18.1%) and normal weight (10.1%) which can be explained partially by the effect of other variables such as age and the presence of a chronic condition in obese workers.
One of the strengths of this study is the magnitude of the sample size. The analytical sample was limited to valid responses in the employed participants; non-valid responses accounted for only 1.2% of all eligible respondents, and no differences were found in rates in the exploration of the non-valid responses. This analysis included different related variables that were allowed within the restrictions of the CCHS design. The report was included of leisure-time physical activity and chronic conditions, which have been independently associated with work productivity and obesity.
The cross-sectional nature of this study results in a number of limitations that warrant attention. First, misclassification bias may have occurred for absenteeism. Respondents were considered who self-reported absence from work in the week previous to the survey administration, but the question in the CCHS did not specify whether the absence was due to illness or other non-health related reasons, such as vacations or personal responsibilities. It is possible that subjects with obesity were absent mainly due to conditions associated with an elevated BMI, whereas the healthy controls were absent mainly due to other reasons. However, while the CCHS did not ask to report sick leave but rather absence in the last week, it has been documented that questionnaires relying on self-reported sick leave information have very low sensitivity [30]. Second, since the CCHS questions only captured absence from work in the previous week, it may not well represent long-term absenteeism. The results of the present study are best seen as a “snapshot” of the relationship between BMI with absenteeism and presenteeism. Longitudinal studies that measure the number of absent days due to illness can better represent absenteeism and presenteeism outcomes. However, since respondents were asked about being absent in the previous week, the precision of the study may increase by minimization of recall bias. Third, the determination of BMI was also limited in the CCHS. BMI was based on self-reported values of height and weight. Studies have shown that there is usually under-reporting for weight and BMI and over-reporting for height [31]. Reporting bias may be present; however, it is believed that any small difference would be taken into account in the comparison of groups. Fourth, people with increased BMI may prefer job types different from those people with normal weight, and the job type may influence the work productivity level. Therefore, the characteristics of the job are to be regarded as potential confounders. However, the data available in the CCHS did not contain detailed job titles or duties. It is believed that by including education, income and chronic conditions in the model, a significant spurious effect was taken into account, since it is likely that an individual decides on his or her type of job based on education and pre-established health conditions. Due to the number of chronic health conditions included in the CCHS, chronic conditions was considered as a group; this limited the ability to estimate the effect of BMI on work productivity by specific chronic diseases. Although the risk of over-adjustment was taken into consideration when including both chronic diseases and physical activity variables in the models, they may independently affect both BMI and the outcome (absenteeism or presenteeism) and are not necessarily surrogate or intermediate variables. Lastly, this analysis utilized a subsample of the CCHS including only employed participants who answered questions related to absenteeism and presenteeism. While this study is subject to recall bias, the questions of the CCHS were asked in the context of the entire survey which may minimize the respondent’s social or workplace desirability bias that can be present in questionnaires designed to measure work productivity.
In summary, this is an analysis of a large population-based data to specifically examine the association between BMI and work productivity considering both absenteeism and presenteeism, and accounting for appropriate confounders. Despite its limitations, the present study suggests that BMI is associated with both absenteeism and presenteeism. This study adds evidence to the body of knowledge that has shown the adverse effect of overweight and obesity on absenteeism and presenteeism. Substantial differences in work productivity were evidenced with respect to the presence of a chronic disease, and small differences were found with regards to gender, age, education, income, and leisure time physical activity. Further prospective research focusing on validated indicators of work productivity will be necessary. Given the increasing rates of overweight and obesity in the Western world, public health efforts to address its causes as well as consequences in the general population are necessary.
Conflict of interest
None declared.
Acknowledgments
This study was not funded. We would like to acknowledge Ana Jost for her precious contribution in editing the final manuscript.
References
Cite this article
TY  - JOUR
AU  - Arnaldo Sanchez Bustillos
AU  - Kris Gregory Vargas
AU  - Raul Gomero-Cuadra
PY  - 2014
DA  - 2014/09/17
TI  - Work productivity among adults with varied Body Mass Index: Results from a Canadian population-based survey
JO  - Journal of Epidemiology and Global Health
SP  - 191
EP  - 199
VL  - 5
IS  - 2
SN  - 2210-6014
UR  - https://doi.org/10.1016/j.jegh.2014.08.001
DO  - 10.1016/j.jegh.2014.08.001
ID  - SanchezBustillos2014
ER  -