
Analysis of Death Risk of COVID-19 under Incomplete Information1
- DOI
- 10.2991/jracr.k.200709.002How to use a DOI?
- Keywords
- Coronavirus; death risk; evidence; experience; internet of intelligences; set-valued statistics
- Abstract
It is easy to write a story about the Coronavirus Disease 2019 (COVID-19) when everything about COVID-19 is known. It is difficult to analyze the death risks of COVID-19 with a few evidences collected before and at the beginning of the outbreak. In this paper, we suggest a hybrid model to analyze the death risk under incomplete information. The hybrid model would be supported by the internet of intelligences, being a platform interacting with infectious disease specialists and local doctors who fuse the evidences with the experience of the known infectious diseases and provide a series of judgments related to the death risk of a human population in a given period to COVID-19. The hybrid model consists of two models of set-valued statistics and a formula. The set-valued statistics integrate the judgments for constructing (1) a probability distribution of the percent of patients, as the exposure of the population, and (2) a mortality curve with respect to the percent, as the vulnerability of the population. The suggested formula calculates the expected value of death toll. We give a virtual case to show how to use the hybrid model.
- Copyright
- © 2020 The Authors. Published by Atlantis Press B.V.
- Open Access
- This is an open access article distributed under the CC BY-NC 4.0 license (http://creativecommons.org/licenses/by-nc/4.0/).
1. INTRODUCTION
The COVID-19 outbreak was first reported in the city of Wuhan, central China’s Hubei Province, in December 2019. Experts have attributed the outbreak to a novel coronavirus that has since spread across China and abroad with confirmed cases exceeding 234,000 globally, death toll of coronavirus tops 11,000 [1], on March 21, 2020. The disease has been named “coronavirus disease 2019” (abbreviated “COVID-19”). When the disease started to spread in China, authorities reacted with historically unprecedented quarantines of cities. On February 27, 2020, the World Health Organization (WHO) raised the risk assessment of COVID-19 from “high” to “very high” at global level. However, the concept of the risk of COVID-19 is still unclear today, and risk communication is not smooth. Before the outbreak, information about the disease was incomplete and traditional risk analysis tools were unable to provide any support. Holding the hope that the virus does not pass from human to human, meanwhile some political considerations, people lost the opportunity to control the source of infection early, causing serious losses. If a more reliable risk analysis was carried out before and at the beginning of the outbreak, and if a strengthen crisis response was took immediately, the situation will certainly be much better. It is the same for almost all disasters, the story after the events is easy to tell, but the risk analysis before the events is not easy. One reason is that the information available for risk analysis before and at the beginning of the outbreak is incomplete.
It is notable that the concept of risk in the glossary of WHO’s international health regulations is different from the definition of risk in ISO 31000 recommended by International Organization for Standardization (ISO). WHO defines public health risk as the likelihood of an event that may adversely affect the health of human populations [2], and ISO defines risk as effect of uncertainty on objectives [3].
There are at least three terms related to WHO’s definition: the risk of infection [4], epidemic risk and social risk [5]. It is difficult to establish a quantitative relationship between these risks and the public health risk. When WHO declares COVID-19’s risk is high, the meaning is not clear. If it refers to the risk of infection, the warning is not enough to attract people’s attention, because the risks infected by influenza viruses are also high, but the mortality rates of the influenzas are very low.
International Organization for Standardization’s definition cannot be used to describe any risk of COVID-19. A risk in ISO’s formwork must be related to one or more objectives which are managed by individuals or organizers. For example, “annual profit” is an objective of the risk management in many companies. In other words, the level of risk is relative to managed objectives. At the beginning of January 2020, COVID-19 already shown its initial shape in Wuhan, what is the risk faced by the residents who will the Baibuting Banquet [6]? which was held for the 20th time in 2020. If the “objective” is to set no one to be infected with the new crown pneumonia virus, the risk level will be high to reach the sky. No banquet! If the “objective” is to set 50% to be infected, the risk is low. Do banquet! The question is who is authorized to set a “objective”. Without any risk assessment, the banquet is held on January 18, 2020, more than 40,000 families in the Baibuting Community presented their own 13,986 dishes.
In this paper, we will suggest a hybrid model to analyze the death risk caused by COVID-19 under incomplete information. The paper is organized as follows: Section 2 defines the death risk caused by COVID-19 as the expected value of death toll; Section 3 reviews three approaches to assess health risk; Section 4 suggests a theoretical model to assess the death risk with complete information, where a formula is given to calculate the expected value of death toll; Section 5 suggests two models to integrate the judgments given by infectious disease specialists and local doctors for constructing the probability distribution and the mortality curve, serving for the formula in Section 4. In Section 6, we give a virtual case, based on the information collected from the Internet during December 8, 2019- January 10, 2020, to show how to use the hybrid model. We conclude this paper with Section 7.
2. DEATH RISK OF COVID-19
Our world is fraught with uncertainties and hazards, called the risk society [7], as featuring a less-controllable world and increasing challenges to define risks. The less-controllable world results from the diversification of human social activities, science and technology are changing with each passing day, climate change, and environmental deterioration, in which the unpredictable consequences of modernization cause social effects that are beyond the ability of experts and institutions to narrate them.
However, people do not just sitting by and watching tragedies. Ancient Chinese people invented a word “风险” (fēng xiǎn) to express an uncertainty tragedy. “风” means “wind”, and “险” means “danger”. Chinese “风险” means English “risk”. It may be argued that, risk is a synthetic phenomenon. Particularly, a risk must connect with the future and adverse incidents. According to the meaning of risk in the Chinese word, the following definition [8] is much clearer to answer the question: what is a risk?
Definition 1. Risk is a scene in the future associated with some adverse incident.
Scene means something seen by a viewer, or felt by individuals or various societal groups. It is a view or prospect. Adverse is contrary to one’s interests or welfare. It is harmful or unfavorable.
A scene must be described with a system consisting of time, a site and objects. The association would be measured with a metric space, such as probability. And, the adverse incident would be scaled with a magnitude, such as injure or death. Any risk must related to some time or period, a site and some objects that would suffer adverse incidents.
Obviously, no past or existing scene can be called risk. For example, an outbreak cannot be called a risk. The risk analysis is for the future.
The measurement of a risk depends on our knowledge for the risk. For example, the risk of aviation accidents is a statistical risk for an insurance company, but is a perceived risk for a passenger. From the perspective of epistemology, risks should be classified into four categories [9]:
- •
A pseudo risk is that we are able to accurately predict it by using system models and currently available data.
- •
A probability risk is that we are able to statistically predict it by using probability models and a lot of data.
- •
A fuzzy risk is that we are able to approximately infer it by using fuzzy logic and incomplete information.
- •
An uncertain risk is that we cannot predict or infer it by using any existing approach and available data.
Definition 1 is the basic definition of the risk rooted in the Chinese interpretation. According to a specific type of adverse events, more specific risk definitions can be derived. For example, the definition “Natural disaster risk is a scene in the future associated with the adverse incident caused by natural events or forces [10]” is derived from the basic definition. Similarly, we give the following definition:
Definition 2. Death risk of COVID-19 is a scene in the future associated with death caused by COVID-19.
We denote the death risk as D. For a risk analyst, the categories of death risks of COVID-19 are different for different regions, different times, and different populations. Many years later, the death risk of COVID-19 might become a pseudo risk. After an outbreak, the risk could be considered as a probability risk. For Wuhan in early January 2020, the death risk of COVID-19 is a fuzzy risk. The death risk of COVID-19 is not an uncertain risk.
3. THREE APPROACHES TO ASSESS HEALTH RISKS
Currently, there are at least three approaches to assess health risks: pathogenic modules, epidemiological models and media templates.
3.1. Pathogenic Modules for Assessing Infection Risks
The term pathogenicity denotes the ability of micro-organisms to cause infectious diseases within the body. The pathogenicity of a micro-organism is markedly coincident with inoculated dosage. Today, some study of pathogenic modules have reached the human genome.
A risk map indicating the vulnerability of different organs to COVID-19 infection was constructed based on that lung, heart, esophagus, kidney, bladder, and ileum, and located specific cell types are vulnerable [11], where the authors analyzed the single-cell RNA sequencing datasets derived from major human physiological systems, including the respiratory, cardiovascular, digestive, and urinary systems. They explored the data from the digestive system and known that extremely high Angiotensin Converting Enzyme II (ACE2) expression was found in ileal epithelial cells; thus, ileum could be at high risk. More than 1% ACE2 positive esophagus epithelial cells were found, and esophagus can thus be regarded as high risk. By contrast, the cells from stomach and liver showed lower ACE2 expression levels.
A study has demonstrated that the AA genotype of rs2268690 (59¢-flanking region), which leads to a higher serum concentration of α-2-Heremans-Schmid glycoprotein, was significantly associated with protection against Severe Acute Respiratory Syndrome (SARS) development [4]. The statistical analysis of the rs2248690 genotype data among the patients and healthy controls in the cohort of health care workers, who were all similarly exposed to the SARS virus, also supported the findings. More specifically, individuals with the AA genotype have a 41% lower risk of developing SARS than those with the TT/AT genotype. In the genetic risk association study, the odds ratio and a 95% confidence interval were used to measure the strength of association.
The pathogenic modules for assessing infection risks are limited to human organs or individuals. They are not suitable for assessing the health risks faced by among people in villages, cities, areas, territories, or countries.
3.2. Epidemiological Models for Predicting the Spread of Human Diseases
Epidemiology is the study of human health in populations, rather than in individuals. It studies the causes of illness, how a particular disease is spread, and disease control. Epidemiology uses a wide array of scientific tools, from medicine and statistics to sociology and anthropology. Epidemiology is concerned not only with the spread of diseases, but also with their cause-if an outbreak of cholera can be traced back to a particular contaminated water source.
For the COVID-19 pandemic, the Imperial College COVID-19 Response Team modified an individual-based simulation model developed to support pandemic influenza planning [12,13] to explore scenarios for COVID-19 in Great Britain (GB). The basic structure of the model remains as previously published. In brief, individuals reside in areas defined by high-resolution population density data. Contacts with other individuals in the population are made within the household, at school, in the workplace and in the wider community. Census data were used to define the age and household distribution size. Data on average class sizes and staff-student ratios were used to generate a synthetic population of schools distributed proportional to local population density. Data on the distribution of workplace size was used to generate workplaces with commuting distance data used to locate workplaces appropriately across the population. Individuals are assigned to each of these locations at the start of the simulation. The team’s report [14] predicted, in the absence of any control measures or spontaneous changes in individual behavior, approximately 510,000 deaths in GB and 2.2 million in the US, not accounting for the potential negative effects of health systems being overwhelmed on mortality. The most important statistics used in the model are that, (a) Incubation period are 5.1 days 9 and 10; (b) Infectiousness is 6.5-day; (c) Reproduction number R0 = 2.4, based on fits to the early growth-rate of the epidemic in Wuhan [15,16]; (d) 50% of those in critical care will die. The report does not clearly give the mortality rate of COVID-19 used in the model.
It seems that the report of the team finally got the UK and US to realize that this is going to require a massive social-distancing and lockdown to avoid killing millions. It is interesting to note that, if the report was released at the beginning of January 2020, few would believe its results. The outbreak data over the past 2 months have supported the report.
The results of epidemiological models depend on the statistics of diseases. Changing any of the important parameters in the model will change the results. The parameters produced without a large amount of data are unreliable. They are not suitable for predicting the spread of the human diseases caused by newly discovered pathogens, such as the novel coronavirus appeared in 2019.
3.3. Media Templates for Showing Potential Health Risks
The media templates are the paradigmatic examples, would be established and maintained by source strategies, social power relations and journalistic/audience reception processes, a journalist also examined how templates operate in relation to existing theories around key events, framing and news icons. The templates are acting to provide context for new events, and helping to shape the ways in which we make sense of the world. Template events help to shape news narratives and guide thinking not only about the past, but also of the present and the future [17].
The model of media template might be illustrative of the making of social facts against the backdrop of risk society. For example, 1079 press items from the Apple Daily, Ming Pao and Wen Hui Pao were selected for the content analysis to constructed a three-step model to examine how highly unknown social risks are constructed as social facts in the process of news-making, demonstrating how Hong Kong’s news discourse about the Swine Flu pandemic (SF) in 2009 drew upon the exemplar of the Hong Kong’s SARS epidemic in 2003. The data coding was conducted in April 2011. Before the coding, one tenth of the samples were selected randomly to conduct an inter-coder reliability test [5].
In self-media era, a lot of important and timely information may not come from the selected press agencies, but from the Internet. To cover different ideologies of the local press, in the media template for SF, the Apple Daily (widely regarded as the most sceptical and critical newspaper), Ming Pao (a commercial paper widely perceived as politically neutral and elitist) and Wen Hui Pao (a leftist, partisan paper that maintains the Chinese state discourse and the official discourse of the Government) were selected. It is very difficult to select the self-media platforms to serve for a media template. On the self-media platforms, such as WeChat and Twitter, there is not only an amount of message about truth but also lies.
None of the above approaches alone can provide effective services for early risk assessment. Under incomplete information, we need a hybrid model to assess death risk, in which all information from observations, analogies and public participations can be used.
4. THEORETICAL MODELS FOR ASSESSING DEATH RISKS WITH COMPLETE INFORMATION
Any theoretical model is based on some assumption. When we assume that the information about risk source, risk bearing body, exposure and vulnerability are complete, there are at least three theoretical models could be used to calculate or assess death risks caused by a deadly virus, with respect to specific individuals, non-specific individuals, or groups.
4.1. Risk Source, Risk Bearing Body, Exposure and Vulnerability
Definition 3. A source that causes risk scenes is called the risk source.
For example, the novel coronavirus is the risk source of the COVID-19’s death risk; flood, earthquake and tropical cyclone are the risk sources of natural disasters; the employee errors are the risk sources of the operational risks faced by financial institutions [18].
We suggest term “scale” to measure the size of a risk source. For example, the number of COVID-19 cases in a city is the scale of the risk source “COVID-19”.
Definition 4. An object that will bears adverse incidents is called the risk bearing body.
For example, a healthy person in a deadly virus-infected area is a risk bearing body. A building in a seismic activity area, a village in the flood area, and a city in a region where multiple hazards frequently occur are risk bearing bodies. A risk bearing body can be an object, individual, group, community, area, country or other entity to incur the possible damages from a risk source [19].
Definition 5. The degree to which a risk bearing body is affected by a risk source is called the risk exposure.
For example, the risk exposure of a healthy person to COVID-19 is the number of COVID-19 patients who would directly contact the person. The risk exposure of a city to COVID-19 is the percent of patients who would be infected in the future. In natural management, exposure usually refers to that which is affected by natural disasters, such as people and property.
“Risk exposure” has more definitions than “risk”. Holton defined risk as exposure to a proposition of which one is uncertain, where exposure means possible consequences and a proposition is the content of an assertion [20]. The concentration and effect levels of a chemical is called the human exposure to the chemical in a scenario-based risk assessment method [21]. The transaction volume of a bank is regarded as a risk exposure of the bank in a model to assess credit risk of banks to non-financial firms [22].
We suggest term “intensity” to measure the size of a risk exposure. For example, the percent of patients to COVID-19 is the intensity of the risk exposure of a city to COVID-19. The seismic intensity is the risk exposure of a building to earthquake.
Definition 6. The degree of adverse incident of that a risk bearing body would bear is called the vulnerability.
For example, the vulnerability of a healthy person to COVID-19 is degree of injury after illness caused the coronavirus. The vulnerability of a community to COVID-19 could be measured in mortality rate. The vulnerability of a building to earthquake is the frangibility of the building.
The means of the vulnerability is similar to the weakness in a risk bearing body. A scale of the vulnerability is from 0 (no adverse incident) to 1 (total adverse incident), or in percent. The vulnerability of a risk bearing body could be measured by a relationship between the intensities of a risk exposure and the possible adverse incidents on the body. In the risk-based decision making for terrorism applications, the definition of the vulnerability of a facility is the probability that an attack against that facility will succeed, given the attack was initiated [23].
We suggest term “curve” to describe the vulnerability of a risk bearing body to a risk source. For example, the mortality curve with the percent of patients as independent variable is the vulnerability of a city to COVID-19.
4.2. Pseudo Risk Model for Calculating Death Risks to Specific Individuals
Let W be a set of the individuals with n persons w1, w2,..., wn, i.e.,
That the information is complete for analysis of death risks of W as a set of specific individuals means that, all attribute values have been known, i.e., we known who will be infected by the given virus, and also know he must die or cure if he is infected by the virus. In this case, the death risk of the individuals is a pseudo risk. Then, the death risk of a person w in the set can be calculated by using Equation (4),
For example, suppose John and Mary are two persons of the specific individuals. The collected data provide complete information to assign their exposures and vulnerabilities to the virus: eJohn = 1, eMary = 1, vJohn = 1, and vMary = 0. Then, as two risk bearing bodies, their death risks to the given virus, as a risk source, are
Obviously, it is very difficult to assign exposure and vulnerability of a risk bearing body even there are a lot of data of death cases and cure cases. It must be noted that, no risk bearing body is included in the death cases or cure cases which have been recorded. Any case is an occurred event, but a risk is a scene in the future. A risk bearing body would bears adverse incidents which would occur in the future.
4.3. Probability Risk Model for Assessing Death Risks to Non-specific Individuals
That the information is complete for a deadly infectious disease means that, at least the basic reproduction number R0 and the mortality rate ρ have been known, which could be estimated by using a large number of epidemiological cases.
Let X be a set of the individuals in the epidemiological cases with m persons x1, x2,..., xm, i.e.,
The set X in Equation (5) is different from the set W in Equation (1), although both of their elements are persons. The elements of X are the epidemiological cases, but W’s elements are risk bearing bodies, who haven’t been infected but may be infected in the future.
That the information is complete for analysis of death risks of W as a set of non-specific individuals means that, although we do not know who will be infected by the given virus, and we do not know whether they will die after they are infected, but we know R0 and ρ of the individuals, which are the same as ones calculated by using X. Furthermore, the completeness implies that, all probability distributions related to the disease are known. It means that, for a person w, there is enough information to calculate the probability pw of his infection, according to his environment and the R0 of the disease. Then, the death risk D of a person w in the set W can be calculated by using Equation (6),
For example, let pJohn = 0.326 be the probability of John’s infection in COVID-19 and ρCOVID-19 = 0.0387, his death risk is
In the real world, even the information is complete, it is not easy to estimate the probability of the infection, which is mainly determined by personal behavior and environment factors. There are too much uncertainty in routes of infection. No environmental model can estimate the probability that a person in a set of non-specific individuals will be infected.
4.4. Probability Risk Model for Assessing Death Risks to Groups
When the information about risk source, risk bearing body, exposure is complete, it is possible to estimate the probability distribution of the percents of a group facing an infectious disease. When the information about vulnerability is complete, it is possible to find a function expressing the relationship between the percent and the mortality rate, determined by the vulnerability of the group and the medical resources. The more patients, the more scarce the medical resources are, and the higher the mortality rate of patients.
Let T be a period in the future, and G be a group in which some persons might be infected during T by virus carriers as risk sources.
That the information is complete for a deadly infectious disease means that, there are enough observations that various groups of people are infected. With the observations, we can estimate the probability distribution p(γ) of the percent γ of patients in G during T.
With the observations of death cases and cure cases under various medical resources, we can find a function f(γ) expressing the relationship between the percent γ and the mortality rate ρ, i.e., ρ = f(γ).
The expected value of mortality rate ρ is the death risk D of group G in period T, which is calculated by using Equation (7),
For example, let T = 30 days, and G be a group which is composed of all residents in a community. We suppose that the probability distribution p(γ) of the percent γ of patients in G during T is,
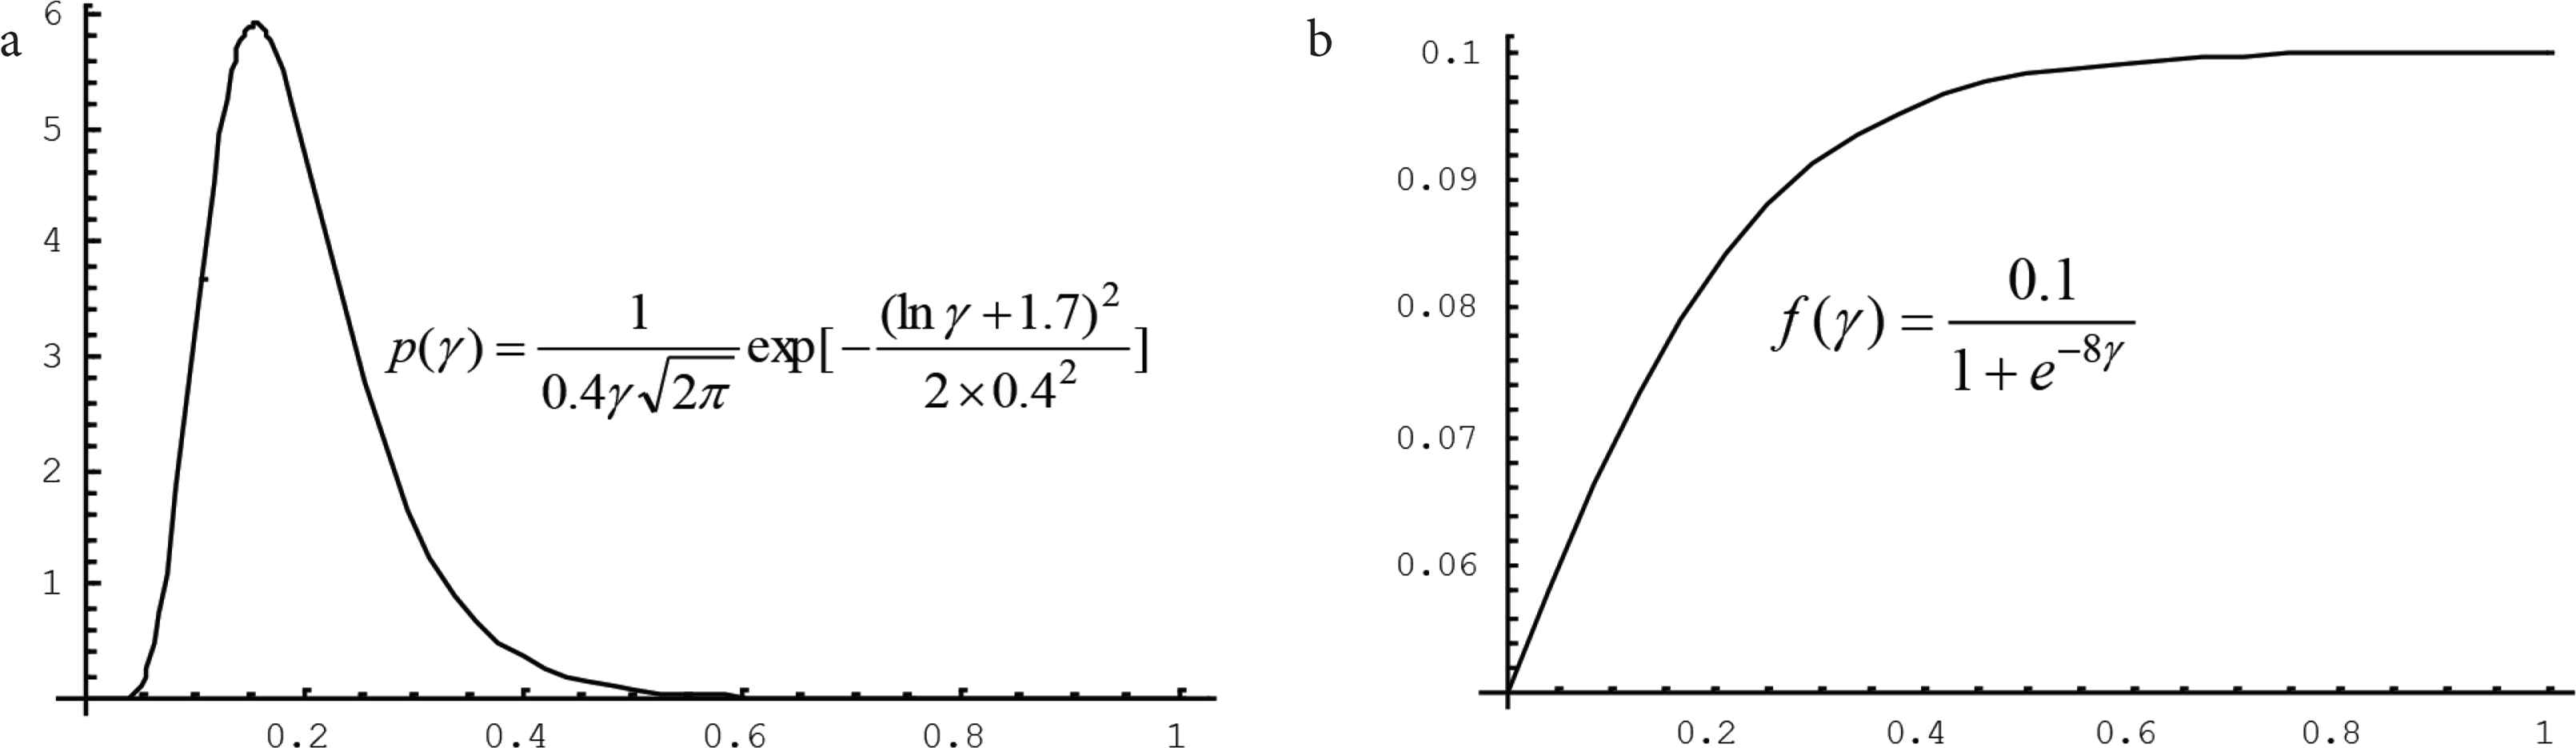
Two functions serving for assessing the death risk of a group to the infectious disease. The probability distribution reflects the exposure of the group and the relationship reflects the vulnerability of the group under corresponding medical system to the disease. (a) Probability distribution of the percent γ that will be infected. (b) Relationship between the percent γ and the mortality rate
It is interesting to note that, when the information about risk source, risk bearing body, exposure is complete, the epidemic might be over. Any analysis is storytelling. The analysis results can no longer be used for risk management of the epidemic. However, the results should be useful for risk analysts to assess the risks of another similar epidemics, such as that the results of SARS in 2003 should be useful for us to assess the risks of COVID-19.
Before the outbreak and at the beginning of the outbreak of a human disease caused by a newly discovered pathogen, the information supporting the analysis risk of the disease is seriously incomplete. In the situation, it is impossible to directly estimate the probability distribution of the percents, or find a function expressing the relationship between the percent and the mortality rate. It is necessary to have model to assess the risk under incomplete information. In the case, the exposure p(γ ) and the vulnerability f(γ ) resulted from the similar infectious diseases, that occurred in the past, can be used for reference, but cannot be used directly.
5. TWO SET-VALUED STATISTICS OF FUZZY JUDGMENTS GIVEN BY STAKEHOLDERS
When the information of a new infectious disease is seriously incomplete, it is necessary to fuse the information with the experience about historical infectious diseases. It is possible to develop a platform of the Internet of Intelligences (IOI) [24] to do that, where experts, citizens, officer, as elements of a set of agents, do not only provide information and the experience but also fuse them. For a given population and time period, on IOI, each agent proposes a rough judgment of the percent of patients and the relationship between the percent and the mortality rate. Then, the model serving for IOI will deal with the judgments to produce the exposure p(γ ) and the vulnerability f(γ ), which could be used to assess the death risk of the population to the new infectious disease, more early.
5.1. Framework Supporting by the Internet of Intelligences
On January 23, 2020, Chinese authorities placed a lockdown on Wuhan where COVID-19 outbreak. Until this day, the information people have about the infectious disease is still incomplete. Both of the exposure and the vulnerability of the city were unknown. The government and experts know neither risk sources (virus carriers) nor the mortality rate. However, they still remember the terrible SARS. It is the shock from SARS that help China controlled COVID-19 in March. If decisive measures had been taken earlier, such as before January 10, the disease might not be outbreak globally. If there is a more reliable risk warning, it is possible to avoid this mistake.
A believable risk warning is based on sufficient evidences. When the information is incomplete, it is necessary to have a new model that can make full use of a few observations, expert knowledge and public wisdom for the risk analysis. To do this, first we review what data is available on January 10, 2020. Integrating messages from official reports and public media, at least we known the following five facts:
- (1)
On December 8, 2019, the first case of unexplained pneumonia was officially reported in Wuhan.
- (2)
On December 31, 27 cases have been found in Wuhan, of which seven are in serious condition, and two cases are expected to be discharged in the near future.
- (3)
On January 5, 2020, 59 cases of the unknown strain of viral pneumonia have been reported in Wuhan, and officials say there has been no “clear evidence” of human-to-human transmission [25].
- (4)
On January 10, 2020, 41 cases of pneumonia infected by the new coronavirus, including seven severe cases and one death was officially reported in Wuhan [26].
- (5)
On January 10, 2020, experts discover that most of the infectious disease contains 80% of the same genetic code as SARS occurred in 2003 [27].
Obviously, the information provided by these facts is seriously incomplete for understanding a new infectious disease. However, the epidemic’s 34-day record and the high similarity with SARS are sufficient to preliminarily analyze the death risk of a group to the new infectious disease. Certainly, the risk analysis only based on the incomplete information is unreliable. Fusing the information from the facts with the experience about historical infectious diseases, we should reasonably assess the risk.
Considering theoretical model in Equation (7), we suggest a framework Figure 2 to fuse the incomplete information with the experience, and we restrict attention to construct a probability distribution p(γ ) of the percent γ of patients in G during T and a function f(γ ) expressing the relationship between the percent and the mortality rate.
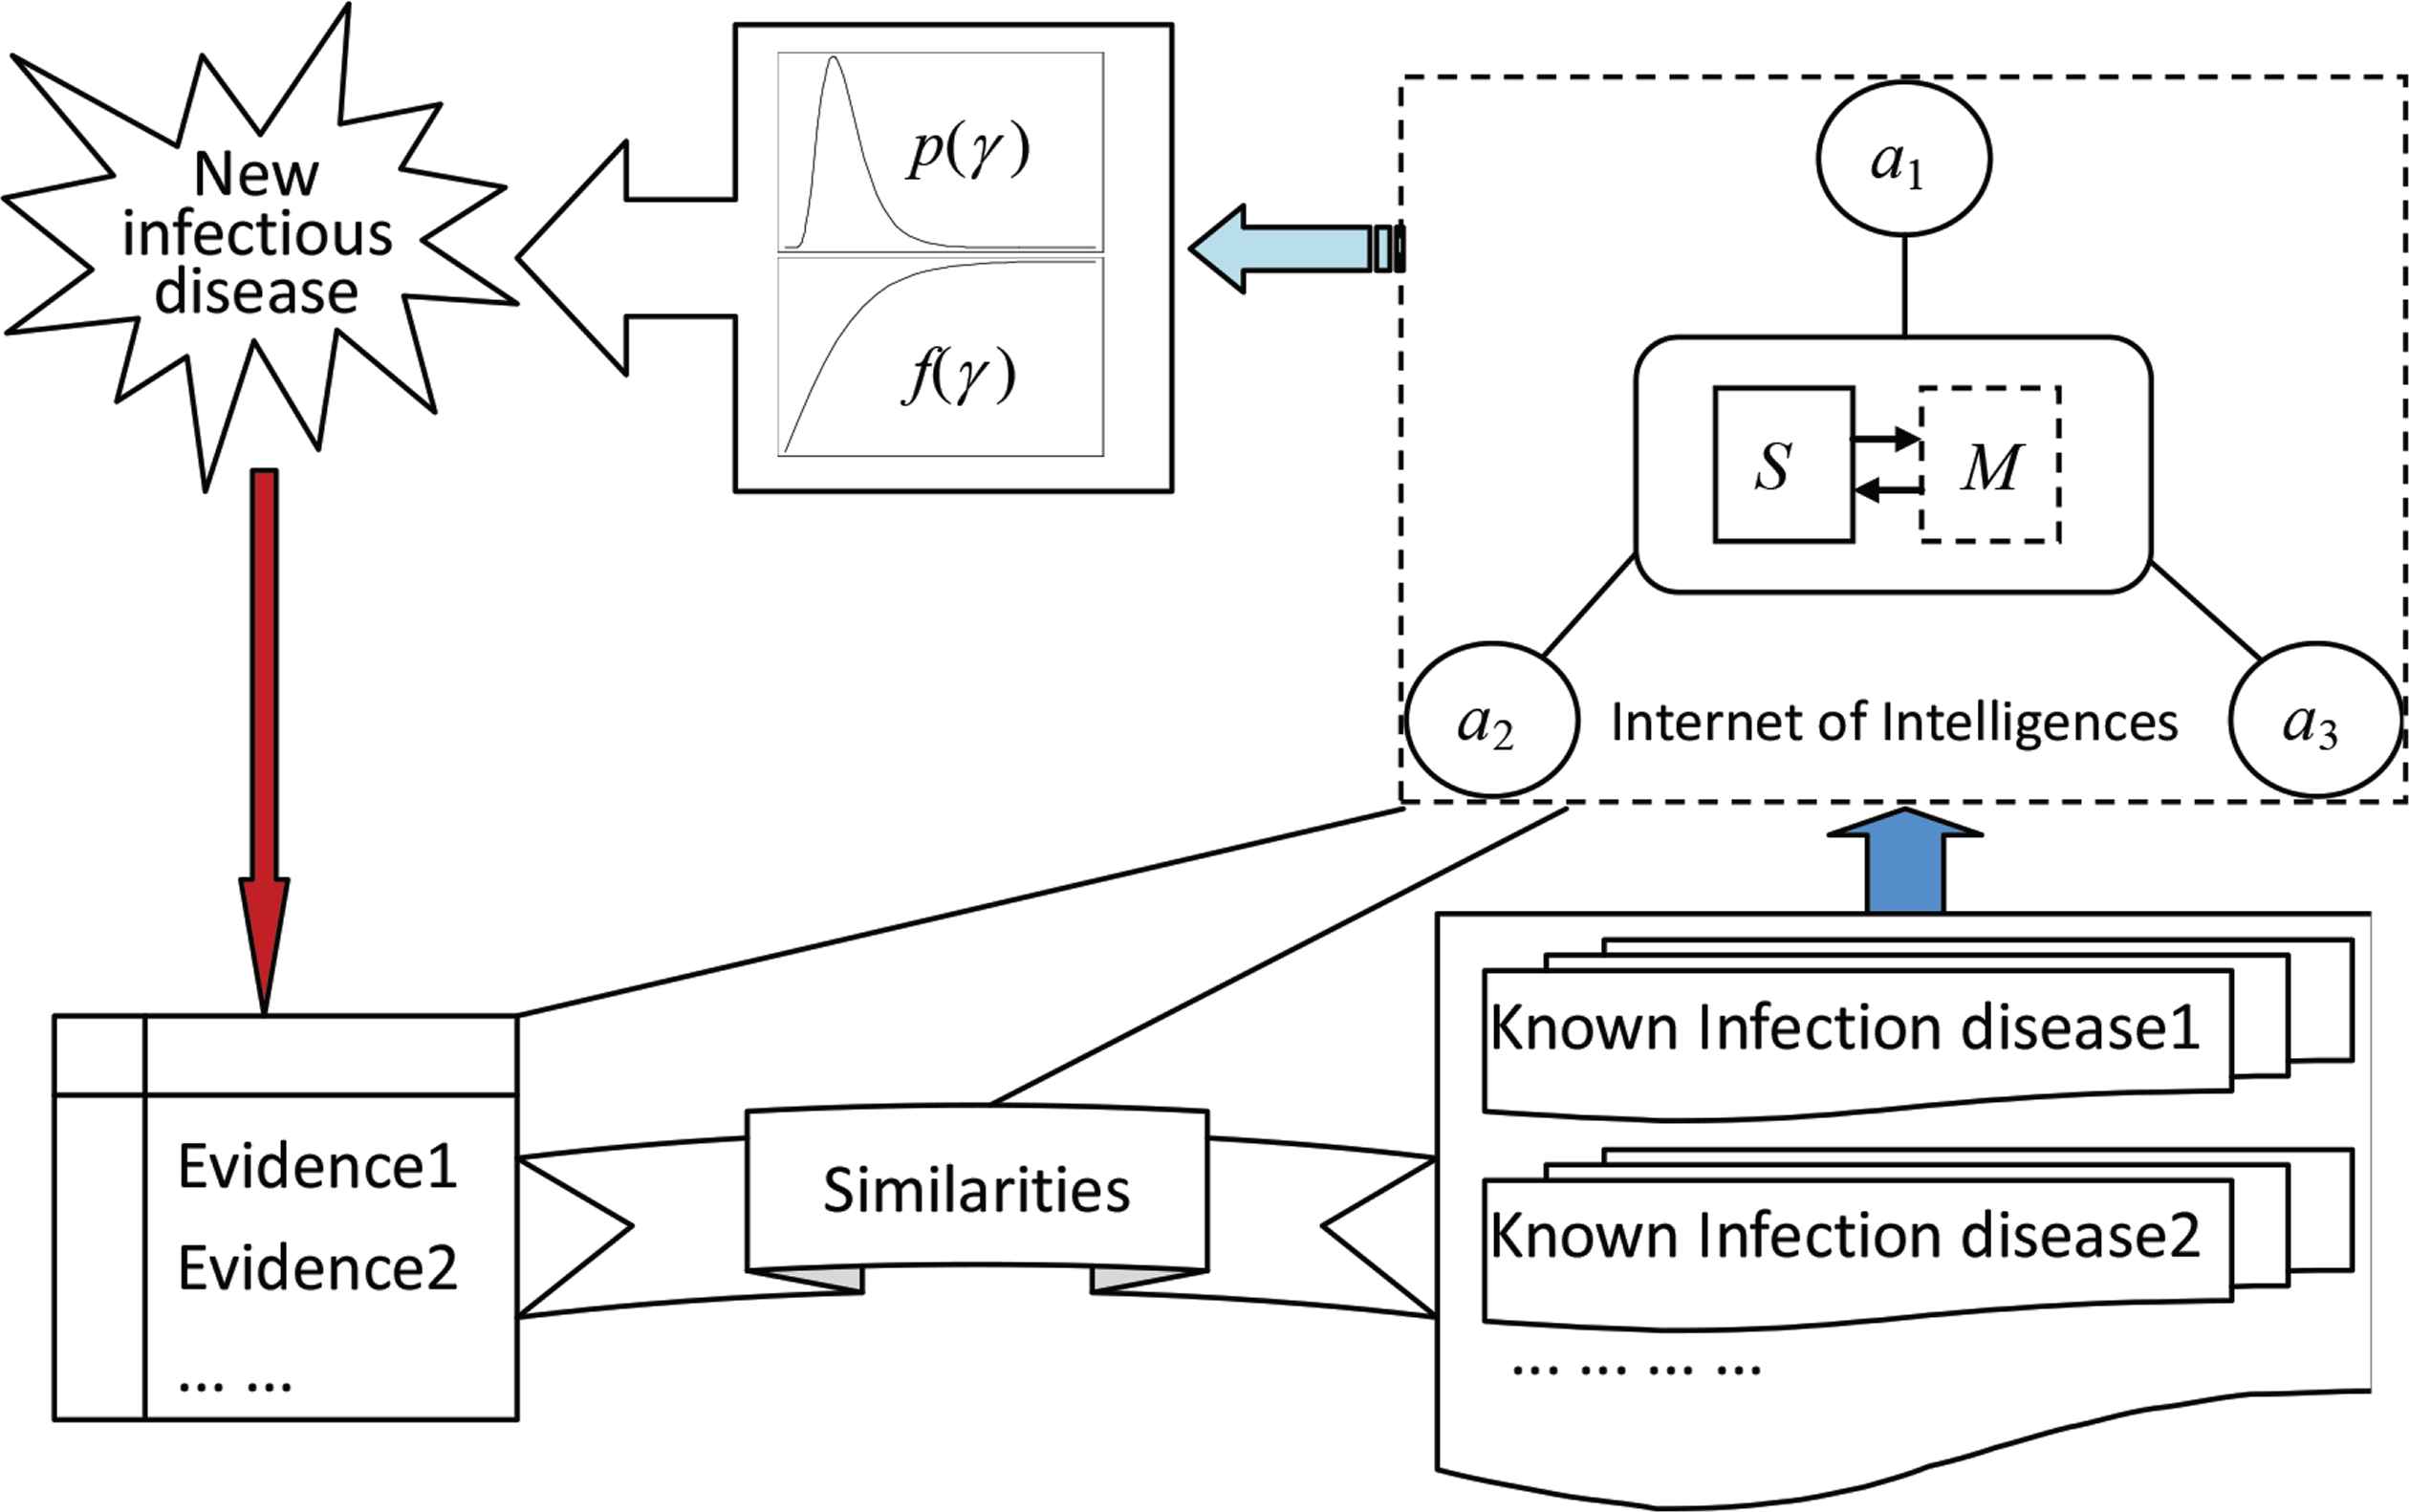
The framework to fuse the collected evidences of a new infectious disease with the experience of the known infectious diseases. The elements a1, a2, a3, ... are agents, such as infectious disease specialists and local doctors. S is a network server. M is a set of models, including two models to integrate the judgments given by agents for constructing the probability distribution p(γ ) and the mortality curve f(γ ), where γ is the percent of people who will be infected. The similarities connect the new infectious disease with known ones in terms of viruses, patient symptoms, mode of transmission, and so on.
The framework is supported by IOI. A network connecting agents by the Internet and integrating scattered wisdoms to be a great wisdom by embedded models is called an IOI, where an individual who can provide message, experience, knowledge, and judgment to a customer to solve problems is called an intelligent agent or simply an agent. A system consisting of a group of two or more computers linked together is called a network. The Internet is the most convenient network. Any mathematical expression describing the relationships among variables, any mathematical method processing data, and any human brain paradigm analyzing questions can be called a model. For an IOI, when we talk about the model, unless stated otherwise, it is assumed as a mathematical model or a human brain paradigm for processing information. The formal definition of IOI is as follows [28]: Let A be a set of agents, N be a network used by A, and M be a model to process information provided by A; a triple <A, N, M> is called the Internet of intelligences, denoted as Φ.
In next two subsections, we suggest two models to construct the probability distribution p(γ ) and the mortality curve f(γ ) used in Equation (7), respectively, for assessing the death risk of a population to a new infectious disease, with respect to a time period in the future.
5.2. Constructing a Probability Distribution by using Possibility Distributions
For a new infectious disease, it is easy to collect the following four types of information: The times when the cases were recorded, places where the cases occurred, symptoms of the cases, and similarities to known infectious diseases. We can use the first three types of information to construct three evidence templates. The fourth type of information could play a role of bridge to connect the experience about historical infectious diseases. According to the connection, anyone can give their own judgments about the severity of the new infectious disease.
The evidence templates should be post on IOI. The experience of historical infectious diseases should be stored in the mutual database of IOI, and automatically organize the templates corresponding to the evidence templates. The similarities between the evidence templates and experience templates are a series of basis to fuse the evidences with the experience.
There are a lot of fuzzy uncertainties in evidence templates, experience templates, and similarities, due to linguistic terms, unstructured information, and vague similarities, and so on. Only the human brain, as a super model, can handle the fuzzy information to fuse them efficiently and reliably. No mathematics model can do that. IBM’s Watson cannot do it, and Google’s AlphaGo cannot. Any Artificial Intelligence (AI) on the basis of existing mathematics is intelligence in the sense of automation, which should be called “smart”, not real intelligence that can create knowledge. The work of fusing information, for assessing death risk of COVID-19 under incomplete information, can only be carried out by the human brain with the help of a series of analytical tools.
There is no loss in generality when we supposed that, for a new infectious disease, q stakeholders (in risk issues, socially organized groups that are or will be affected by the outcome of the event or the activity from which the risk originates and/or by the risk management options taken to counter the risks) were ordered to give their judgments about the percent γ of patients in G during T according to the collected evidences, the experience of the known infectious diseases, and the similarities between the new infectious disease with known ones in terms of viruses, patient symptoms, mode of transmission, and so on. The set of the q stakeholders is written as
For a given group G and a time period T, nobody can accurately judge how percent of patients will be. Each stakeholder, as an agent on the platform of IOI serving for analysis of the death risk of G in T to the new infectious disease, is requested to give a fuzzy judgment of the percent, distributing on the values in Equation (12), that called the universe.
For example, u1 = 0, u2 = 0.1 (i.e., 10%),..., u11 = 1 (i.e., 100%). A fuzzy judgment is a possibility distribution to distinguish the possible degree of different percents. A possibility distribution is written as
An element of the possibility distribution Π is also written as π(u), u ∈ U, mathematically. For example, for the universe with respect to group G and period T,
the possibility distribution given by a stakeholder a,
means that the stakeholder thinks that the possibility of that 10% of patients in people of G in the future T will be infected is the largest. It is also that 20% people may be infected with a small possibility. No other percentage is possible.
The main benefit of that possibility distributions are used to express the judgments is that the flexible retains useful transition information. This is very helpful to improve the accuracy of the risk assessment under incomplete information.
The traditional statistics generally restricts itself to deal with the samples consisting of observations on one or more variables. The value of a variable is a real number. Such observation is called the singleton observation. A fuzzy judgment with a possibility distribution is a set-valued observation, where the element of the universe is one or more variables, but more than one value would be taken. We also can use a set of set-valued observations to estimate a probability distribution with respect to a random variable.
Suppose now that q stakeholders have given q possibility distributions expressing their judgments of the percent of patients with respect to group G and period T,
To make each judgment have the same importance, we use Equation (15) to normalize them,
Let
According to the consistency principle of possibility/probability shown in Equation (17) [29],
5.3. Constructing a Mortality Curve by Rough Judgments
For COVID-19, it took 34 days from the first case to the first deceased. Although it is not a short period, it also is impossible to estimate a mortality curve of the new infectious disease by using the evidence. However, considering the similarities with the known infectious diseases, any stakeholder can give a rough judgment on the death rate.
Suppose that, based on the evidence templates, experience templates and the similarities which are shared on an IOI, q stakeholders have given q mortality curves expressing their judgments of the relationship between the percent γ and the mortality rate ρ with respect to group G and period T,
Let γ = u, the average of these curves fi(u) in Equation (20) could be used as the mortality curve in Equation (7).
6. A VIRTUAL CASE TO ASSESS THE DEATH RISK OF COVID-2019
Since the author of this paper is neither an infectious disease specialist nor a doctor, but only a risk analyst, he can neither obtain the scientific data of the COVID-19 cases nor have the experience of any known infectious disease. Therefore, he can only use the suggested hybrid model for virtual data, based on the information collected from the Internet during December 8, 2019- January 10, 2020, to analyze the death risk of COVID-19 under incomplete information.
In the case, the group G studied is the population of a city, where 10 million people are living. The period T is 30 days in the future. The starting point of time starts from the day when 18 infectious disease specialists and local doctors, as stakeholders, who are virtually invited to give their judgments. Suppose that, before the T, there is a small number of COVID-19 cases and early outbreaks. In the virtual case, the information available for risk analysis is seriously incomplete.
As a virtual case, it is reasonable to assume that there is an IOI where the invited stakeholders can work on, and they are required to give their judgments under following two constraints:
- (1)
The current medical resources (Local hospital facilities and doctors);
- (2)
The current administration (No control over patients and communities).
Let the universe of percent of patients, for analyzing the death risk of the city to COVID-19 in future 30 days, be
Suppose that, there are 10 infectious disease specialists and eight local doctors among the 18 stakeholders, who given fuzzy judgments of that the percent of patients to COVID-19 in Equation (21) are the possibility distributions shown in Table 1.
| u1 | u2 | u3 | u4 | u5 | u6 | u7 | u8 | u9 | u10 | u11 | |
|---|---|---|---|---|---|---|---|---|---|---|---|
| IDS1 | 0.1 | 1 | 0 | 0 | 0 | 0 | 0 | 0 | 0 | 0 | 0 |
| IDS2 | 0 | 0.8 | 1 | 0.1 | 0 | 0 | 0 | 0 | 0 | 0 | 0 |
| IDS3 | 0.5 | 1 | 0.6 | 0 | 0 | 0 | 0 | 0 | 0 | 0 | 0 |
| IDS4 | 0.2 | 1 | 0.1 | 0 | 0 | 0 | 0 | 0 | 0 | 0 | 0 |
| IDS5 | 1 | 0.5 | 0 | 0 | 0 | 0 | 0 | 0 | 0 | 0 | 0 |
| IDS6 | 0.3 | 0.2 | 0.1 | 0 | 0 | 0 | 0 | 0 | 0 | 0 | 0 |
| IDS7 | 0 | 0.4 | 0.8 | 1 | 0.7 | 0.6 | 0.2 | 0.1 | 0 | 0 | 0 |
| IDS8 | 0 | 0.9 | 1 | 0.7 | 0.5 | 0 | 0 | 0 | 0 | 0 | 0 |
| IDS9 | 0.4 | 0.5 | 0.7 | 0.8 | 0.9 | 1 | 0.9 | 0.8 | 0.7 | 0.1 | 0 |
| IDS10 | 0 | 0.8 | 0.9 | 1 | 0.7 | 0.5 | 0.1 | 0 | 0 | 0 | 0 |
| LD1 | 0 | 0.5 | 0.6 | 0.8 | 1 | 0.7 | 0.6 | 0.2 | 0.1 | 0 | 0 |
| LD2 | 0 | 0.8 | 1 | 0.8 | 0 | 0 | 0 | 0 | 0 | 0 | 0 |
| LD3 | 0 | 0.4 | 0.8 | 1 | 0.8 | 0.4 | 0 | 0 | 0 | 0 | 0 |
| LD4 | 0 | 0 | 0.3 | 0.6 | 0.8 | 1 | 0.7 | 0.2 | 0.1 | 0 | 0 |
| LD5 | 0 | 0.1 | 0.4 | 0.8 | 1 | 0.9 | 0.8 | 0.4 | 0.3 | 0.1 | 0 |
| LD6 | 0 | 0 | 0 | 0.6 | 1 | 0.6 | 0.3 | 0 | 0 | 0 | 0 |
| LD7 | 0.2 | 0.8 | 1 | 0.9 | 0.7 | 0.6 | 0.5 | 0.2 | 0.1 | 0 | 0 |
| LD8 | 0.6 | 1 | 0.6 | 0 | 0 | 0 | 0 | 0 | 0 | 0 | 0 |
IDS, infectious disease specialist; LD, local doctor, the value in the table is possibility π.
The fuzzy judgments of that the percent of patients who might be infected by the COVID-19 virus in the studied city in the next 30 days
Taking the seventh local doctor’s possibility distribution as an example, we use Equation (15) to normalize the judgment. Let
Summing the 18 normalized judgments by Equation (16), we obtain an integrated possibility distribution,
For example,
Let
using Equation (18), we infer a discrete probability distribution of the percent of patients who might be infected by the COVID-19 virus in the studied city in the next 30 days,
For example, p(u2) = 0.282 means that, according to the judgments given by the 18 stakeholders, the probability of infection of 10% of people in the city in the 30 days is 0.282.
Similarly, suppose that, the 18 stakeholders given 18 mortality curves expressing their judgments of the relationship between the percent and the mortality rate, shown in Table 2, including the average of the mortality rate with respect to each percent shown in Equation (21).
| u1 | u2 | u3 | u4 | u5 | u6 | u7 | u8 | u9 | u10 | u11 | |
|---|---|---|---|---|---|---|---|---|---|---|---|
| IDS1 | 0 | 0.10 | 0.50 | 0.6 | 0.8 | 1 | 1 | 1 | 1 | 1 | 1 |
| IDS2 | 0 | 0.8 | 1 | 1.1 | 1.5 | 1.5 | 1.5 | 1.5 | 1.5 | 1.5 | 1.5 |
| IDS3 | 0 | 0.15 | 0.55 | 0.9 | 1 | 1.2 | 1.2 | 1.2 | 1.2 | 1.2 | 1.2 |
| IDS4 | 0 | 0.08 | 0.3 | 0.5 | 0.8 | 0.9 | 0.9 | 0.9 | 0.9 | 0.9 | 0.9 |
| IDS5 | 0 | 0.03 | 0.2 | 0.4 | 0.6 | 0.6 | 0.6 | 0.6 | 0.6 | 0.6 | 0.6 |
| IDS6 | 0 | 0.02 | 0.3 | 0.5 | 0.5 | 0.5 | 0.5 | 0.5 | 0.5 | 0.5 | 0.5 |
| IDS7 | 0 | 1.5 | 2.1 | 3.5 | 4.02 | 4.02 | 4.02 | 4.02 | 4.02 | 4.02 | 4.02 |
| IDS8 | 0 | 1.9 | 2.7 | 3.8 | 3.8 | 3.8 | 3.8 | 3.8 | 3.8 | 3.8 | 3.8 |
| IDS9 | 0 | 2.5 | 6.04 | 6.04 | 6.04 | 6.04 | 6.04 | 6.04 | 6.04 | 6.04 | 6.04 |
| IDS10 | 0 | 2 | 2.5 | 3.5 | 4 | 4 | 4 | 4 | 4 | 4 | 4 |
| LD1 | 0 | 2 | 3 | 4 | 5 | 5 | 5 | 5 | 5 | 5 | 5 |
| LD2 | 0 | 0.7 | 0.8 | 1.3 | 1.3 | 1.3 | 1.3 | 1.3 | 1.3 | 1.3 | 1.3 |
| LD3 | 0 | 1.4 | 1.8 | 3 | 3.5 | 3.5 | 3.5 | 3.5 | 3.5 | 3.5 | 3.5 |
| LD4 | 0 | 3 | 5 | 5.8 | 5.8 | 5.8 | 5.8 | 5.8 | 5.8 | 5.8 | 5.8 |
| LD5 | 0 | 2.6 | 4 | 5.1 | 5.1 | 5.1 | 5.1 | 5.1 | 5.1 | 5.1 | 5.1 |
| LD6 | 0 | 2.5 | 3.8 | 4.9 | 4.9 | 4.9 | 4.9 | 4.9 | 4.9 | 4.9 | 4.9 |
| LD7 | 0 | 1.2 | 1.3 | 1.4 | 1.4 | 1.4 | 1.4 | 1.4 | 1.4 | 1.4 | 1.4 |
| LD8 | 0 | 0.13 | 0.45 | 0.8 | 0.9 | 1 | 1 | 1 | 1 | 1 | 1 |
| Average | 0 | 1.256 | 2.019 | 2.619 | 2.831 | 2.864 | 2.864 | 2.864 | 2.864 | 2.864 | 2.864 |
IDS, infectious disease specialist; LD, local doctor, the value in the table is the mortality rate ρ.
The judgments of the mortality curve f(u) with respect to percent u of patients who might be infected by the COVID-19 virus in the studied city in the next 30 days
Then, we obtain a discrete mortality curve of the percent of patients who might be infected by the COVID-19 virus in the studied city in the next 30 days,
According to Equation (7), we infer the death risk of COVID-19,
Considering that there are ten million people in the studied city, D = 1.8917 means that, in the next 30 days, the death toll to COVID-19 might be 189170 (0.018917 × 10000000 = 189170), if both of the medical resources and the administration are unchanged. This is a terrible figure of deaths. This figure is enough to attract the attention of the authorities, and will immediately take a strong crisis response measures.
7. CONCLUSION
Under the condition of incomplete information, there still is a possibility to reasonably analyze the death risk of COVID-19. However, the first of all, the death risk must be defined clearly. There is no abstract risk, only concrete risk. Secondly, there must be some infectious disease specialists and local doctors, who can fuse the evidences of the new infectious disease with the experience of the known infectious diseases, to give fuzzy judgments: (1) possibility distributions of the percent of patients in the population during a period, and (2) mortality curves with respect to the percent. Third, with the set-valued statistic, we can change the fuzzy judgments into the probability distribution of the percent of patients and the mortality curve. Finally, as the expected value of death toll, the death risk can be calculated by using the probability distribution and the mortality curve.
Simply speaking, the suggested hybrid model consists of three statistics models, one is to calculate an expected value, others are set-valued statistics to integrate fuzzy judgments. The hybrid model would be performed on an IOI where the infectious disease specialists and local doctors share information and experience and give their judgments.
It is easy to write a story when everything has been known. But, any risk analysis is not about writing stories. The death risk is a scene in the future, not a story. It is difficult to analyze the death risks of COVID-19 with a few evidences collected before and at the beginning of the outbreak. The death risk of COVID-19, which is calculated by using the suggested hybrid model, should not be the same as the future story, but if the assessment can promote reducing catastrophes, the value of the model will be revealed.
The meaning of “the risk of COVID-19” is ambiguous, which may be infection risk, death risk, disability risk, or economic systemic risk. Particularly, any health risk must be related to individuals or a population, as the risk bearing body, and the risk is constrained by a time period. The risk within 5 days is quite different from one within two months. Neither ISO’s risk definition: “Effect of uncertainty on objectives” or WHO’s definition of public health risk: “Likelihood of an event that may adversely affect the health of human populations” can lead out the definition of death risk. Without an managed “objective”, no risk can be measured by ISO’s definition. The WHO’s risk warning cannot provide the connotation of a risk.
According to the meaning of risk in the Chinese word, “risk” should be defined as: “A scene in the future associated with some adverse incident”, which leads out the definition of death risk of COVID-19: “A scene in the future associated with death caused by COVID-19”. As the expected value of death toll, the death risk of COVID-19 can be assessed by the exposure and vulnerability of a human population to COVID-19. In the suggested model, the probability distribution of the percent of patients in the population during a period represents the exposure, and the mortality curve with respect to the percent represents the vulnerability.
As evidence increases, medical resources improve, and crisis response strengthen, the death risk must change. The IOI with updated risk function is a risk radar. Today, the most of commercial risk radars only have the function to show risks, as same as a set of risk matrixes. The risk radar driven by IOI monitors dynamic risks for emergency management in community.
CONFLICTS OF INTEREST
The author declares no conflicts of interest.
Footnotes
This project was supported by the National Key Research and Development Plan (2017YFC1502902) and the National Natural Science Foundation of China (No. 41671502). Author is the president of Society for Risk Analysis - China (SRA-China), https://www.sra.org/china-sra .
REFERENCES
Cite this article
TY  - JOUR
AU  - Chongfu Huang
PY  - 2020
DA  - 2020/07/15
TI  - Analysis of Death Risk of COVID-19 under Incomplete Information1
JO  - Journal of Risk Analysis and Crisis Response
SP  - 43
EP  - 53
VL  - 10
IS  - 2
SN  - 2210-8505
UR  - https://doi.org/10.2991/jracr.k.200709.002
DO  - 10.2991/jracr.k.200709.002
ID  - Huang2020
ER  -