
Food Security Risks of Countries along the Belt and Road in the Context of the COVID-19 Pandemic
 , Yanzhao Yang1, 2, 4, *, , Zhiming Feng1, 2, 4, Tingting Lang1, 2, Xiufen Wang5, Ying Liu1, 2
- DOI
- 10.2991/jracr.k.210503.001How to use a DOI?
- Keywords
- COVID-19 pandemic; food security; international trade; supply risk; countries along the Belt and Road
- Abstract
The COVID-19 pandemic has triggered concerns about the global food crisis, thus identification of food security risks constitutes an important basis for responding to the influence of the pandemic. In this study, the influence path of the pandemic on food security was analyzed first. Then, the risk nodes of the trade network of countries along the Belt and Road were identified by complex network analysis. Further, food security risks were comprehensively assessed, and dominant risk types were systematically determined by using a four-dimensional integrated food security risk assessment model. According to the results: (1) The COVID-19 pandemic adds to the uncertainty of food security, lowers the efficiency and stability of international trade, highlights the importance of domestic supply, and exposes the vulnerability of external dependence. (2) The Main Cereals Trade Network (MCTN) presents typical scale-free features in the Belt and Road, and core countries significantly affect the stable service of the network. However, as spreading of COVID-19, these countries may pose potential risks to the global food market in the future, by disrupting MCTN. (3) The possession of cereals less than 200 kg/per in 19 countries along the Belt and Road, nine countries have an external dependence of above 90%, and eight countries have an import concentration of above 90%. With the pandemic, 27 countries’ Food Security Risks Indices (FSRI) increase over 1.5 times. (4) Roughly 25%, 40%, and 15% of the countries are dominated by the pandemic risk, dual risks, and compound risks, respectively. About half a number of the countries shows very high or high FSRI level. Specifically, seven countries are dominated by the compound risk. Ten countries are dominated by the domestic supply risk and the pandemic risk. Six countries are dominated by the domestic supply risk and the import concentration risk.
- Copyright
- © 2021 The Authors. Published by Atlantis Press B.V.
- Open Access
- This is an open access article distributed under the CC BY-NC 4.0 license (http://creativecommons.org/licenses/by-nc/4.0/).
1. INTRODUCTION
Food security exists when all people, at all times, have physical, social and economic access to sufficient, safe and nutritious food, which meets their dietary needs and food preferences for an active and healthy life” [1]. Requirement of appropriate ways to maintain and improve food security poses one of the major challenges at the global scale in the 21st century. The food crisis in today’s world; however, is no longer the crisis associated with insufficient food production in its traditional sense, but the crisis of food allocation, trade, and supply [2]. It is also affected by global and regional public health events, such as the COVID-19 pandemic (hereinafter referred to as “the pandemic”) that has triggered concerns about the global food crisis [3]. As of December 31, 2020, the pandemic has spread to more than 200 countries and regions in the world, causing a cumulative total of more than 80 million confirmed cases and 1.8 million death cases. Many countries have taken a series of measures such as social distancing and border closure, which to some extent is helpful in containing the cross-border or cross-regional spread of the pandemic. However, these measures have also led many countries into the difficulties of traffic disruption, business suspension, and economic stagnation; and damaged the stability of their domestic food supply chains. On the other hand, concerns about the interruption of the Main Cereals Trade Network (MCTN) and the restriction of food export have caused upward pressure on food prices to rise up with fluctuations, and thus exposed the vulnerability of the global allocation of the food supply chain [4].
In this context, how to measure and respond to the influence of the pandemic on food security has become an urgent problem faced by government agencies and academic circles, which needs urgent solution. Scholars have basically reached the consensus that the first step is to identify the threats posed by the pandemic to the food system, in order to implement effective mitigating measures [5]. According to Moran et al. [6], the pandemic has caused a shortage of seasonal labor in Britain. Arumugam et al. [7] hold the perspective that the closure policy has negatively impacted the decisions about the supply and plantation of agricultural means of production in India. Zabir et al. [8] found that the pandemic has given rise to a shortage of food supply and agricultural labor in Bangladesh, and posed risks to crop harvesting. Coluccia et al. [9] discussed the effects of COVID-19 on agri-food supply and value chains in Italy. Marti et al. [10] highlighted that control measures have important consequences for European food chains and agri-food export supply chains. As typically observed during public health emergencies, the restriction on international trade reduces the efficiency of the global trade network, and distorts the supply relationship. A series of problems caused by pandemic persistence, such as income decline, supply shortage or interruption, and food price fluctuations, have impacted food security from different dimensions [11]. Other scholars mostly believe that the uncertainties of food production and trade restriction generated due to the ongoing spread of the pandemic will make it more difficult to regulate the domestic food market [12]. In fact, the spread of the pandemic and the restriction of trade will combine to increase food security risks worldwide, eventually turning the food security crisis into a global challenge that can be tackled only through joint efforts. Although there is no factual shortage of food in the world, maintaining international food trade smoothly has emerged as an inevitable common choice for jointly coping with this potential food crisis.
In summary, existing studies show that the pandemic situation has broken the relatively stable state of food supply and consumption, leading to malfunctioning food supply chains and thus highlighting the importance of domestic supply and exposing the vulnerability of external dependence. Noteworthy, these studies are mostly based on the global perspective; however, when it comes to quantifying the patterns of food security risks at regional and national levels, they seem to be slightly insufficient. Besides, these studies have rarely attempted the comprehensive assessment of food security risks in the context of the pandemic by combining pandemic crisis and food flow patterns with food security. Therefore, in order to deal with potential food security risks, it is vitally important to combine the pandemic risk with food flow patterns and domestic supply capacity in order to quantify the integrated food security risk at the national scale and further analyze the main factors influencing the food security of a country.
The Belt and Road runs across major rice exporters of the world [13], including eight low-income food-deficit countries and 11 net food-importing developing countries; and enjoys an important place and a significant influence on the global food market. However, the pandemic has posed potential risks to the Belt and Road construction [14], in particular, to the food security of countries along the Belt and Road. For example, according to the Crop Prospects and Food Situation, over 80% (24.3 million) and 54% (9.3 million) of the population are at risk from food crisis in Yemen and Syrian, respectively. Bangladesh and Myanmar’s Food insecurity levels have increased due to income losses and a decline in remittances as a result of the pandemic [15].
In this study, countries along the Belt and Road were considered as the research object, and the food-related data were collected from the food balance sheets and trade matrix released by the United Nations Food and Agriculture Organization (FAO). We collected the data of the pandemic risk indices of different countries. Furthermore, by sorting out the influence path of the pandemic on food security, the features and risk nodes of the MCTN of countries along the Belt and Road were identified herein using complex network analysis [16]. Specially, a multi-dimensional integrated food security risk assessment model was constructed, and the food security risks and dominant risk types of countries along the Belt and Road were quantified and determined. The findings of this study are of vital significance for countries along the Belt and Road in coping with food security risks in a targeted manner, and for China in cooperating with countries along the Belt and Road in the field of food security.
2. INFLUENCE PATH OF THE COVID-19 PANDEMIC ON FOOD SECURITY
In general, food security can be characterized by four dimensions, including food availability, economic and physical access to food, food utilization and stability (vulnerability and shocks) over time [17]. Since the pandemic outbreak globally, various measures for the pandemic control have negatively impacted food security from different dimensions [11]. First, border closure and traffic and transportation control have affected the cross-border migration of labor and the transportation of agricultural materials, resulting in labor shortage and other related problems in many countries [18] and raising significant concerns about food production in the future. Second, the restricted food trade, the difficulty of freight consolidation to ports, and a series of other problems have overshadowed the global food market, causing a significant increase in food prices worldwide and posing severe potential external supply risks to net food-importer countries. Third, the pandemic has cut down food aid from the United Nations World Food Programme (WFP), which may directly plunge some groups into the state of food insecurity [19]. Moreover, the pandemic is also expected to exert a profound influence on the economy. The International Monetary Fund has estimated the decrease in the global economic growth rate of 2020 by 4.4%. The decline of disposable income and the increase of food prices accompanying such drop can further restrict the economic access to food. Moreover, the consequent reduction in foreign currency earnings may make food import unaffordable for some countries. The shutdown of food processing and storage enterprises and the restriction imposed on transportation also affect food utilization and access to food.
The fluctuations in food prices caused by multiple factors under the pandemic constitute the most unstable factor of food security. From March 11 to early April 2020, major food exporters such as Ukraine, Russia, Vietnam, Myanmar, and Kazakhstan successively announced the control of food export [19], following which food prices increased around the world. In the latter half of 2020, widespread concerns were encountered about the food production in the US and Russia, the harvest prospect in America, the short supply in Thailand and Vietnam, the additional purchase of food by India and Pakistan, the restriction of food transportation, etc. By December 2020, food prices had been rising for six months, with the average food price being 6.6% higher than that of 2019, and the highest margin since 2014 [20] (Figure 1).
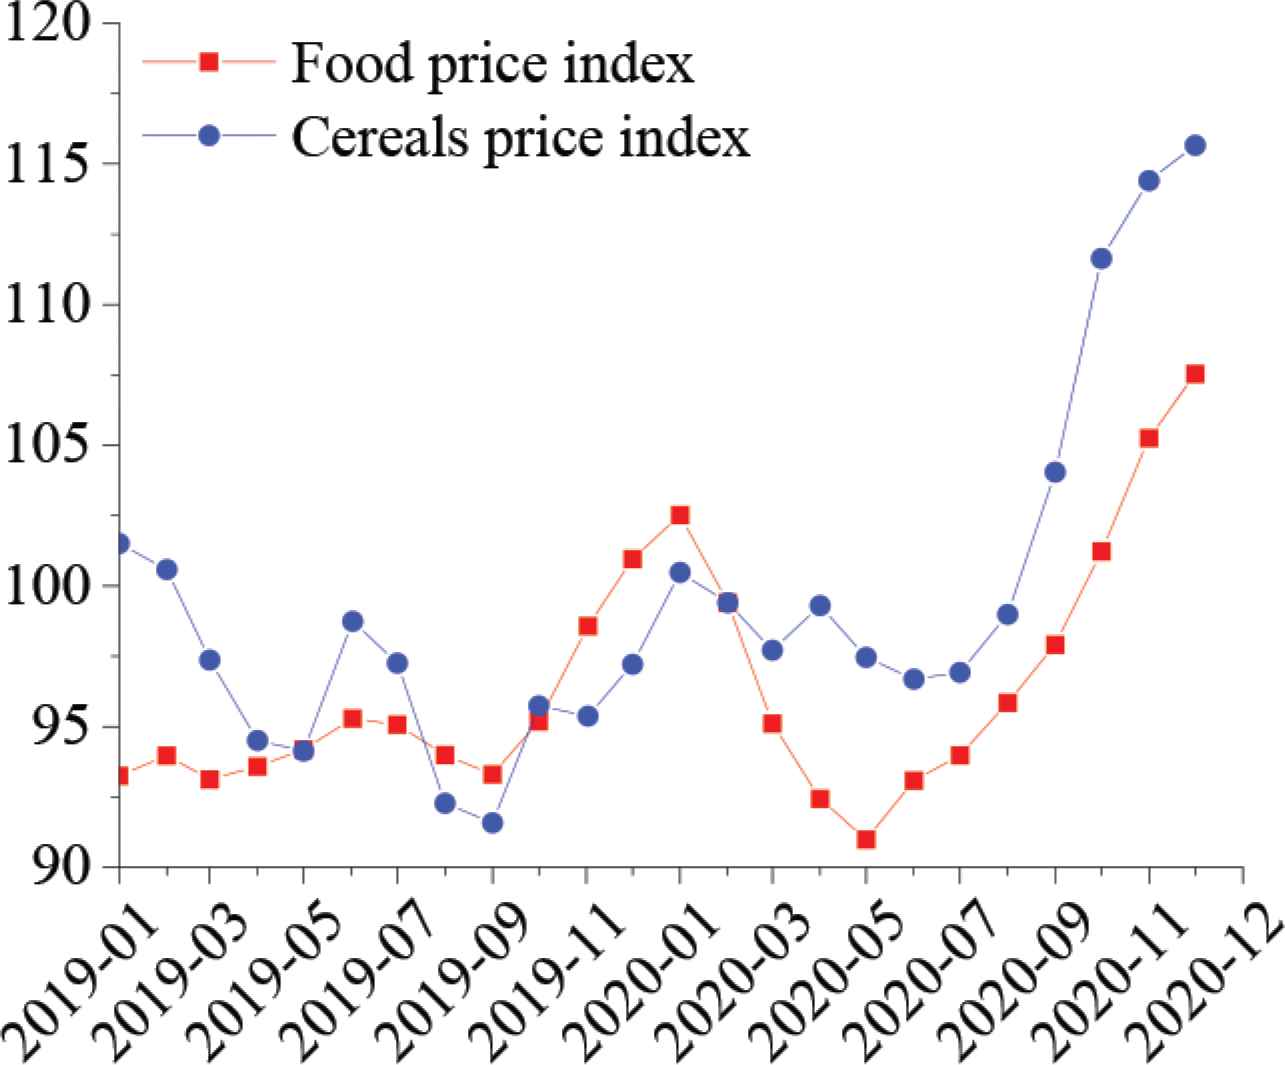
Changes in the global food price index from January 2019 to December 2020. Note: arranged according to the global food price index released by the FAO.
Although the FAO forecast that the global food production of 2020 would increase by 1.3% based on the data of 2019. Nevertheless, the production prospects of North Africa, West Africa, and Europe, declined by 9.5%, 4.0%, and 5.4%, respectively. Notably, the production prospect of EU was found to drop by 14.9% [15]. The International Grains Council estimated and reported that, affected by the decline of food reserves in the US, China, and the EU, the global cereals reserve would drop to 611 million tons, the lowest point in 5 years [21]. Moreover, the reduction in both regional food production and global food reserve would increase global demands for food trade; and trade is exactly one of the fields most severely affected by the pandemic. More than 120 countries and regions in the world have prohibited or restricted entry of ships for pandemic prevention. Reports released by the World Trade Organization (WTO) show that the global grade volume in the first three quarters of 2020 was down nearly 8.2% from the same time last year, and that the prospect of revival of trade is still unclear [22].
To sum up, unfortunately, the ongoing spread of the COVID-19 causes a series of problems, such as a sharp drop in purchasing power, reduction in foreign currency earnings, and shortage of foreign and domestic food supply, in economically disadvantaged countries. The interruption of food supply chains and the reduced stability of the international food trade network caused by the pandemic further weaken the stability of food security pillars (food availability, access to food, and food utilization), and break the relatively stable state of food supply and consumption. As a result, this highlights the importance of domestic supply; exposes the vulnerability of external dependence; and exacerbates the domestic supply, external dependence, and import concentration risks of food security worldwide. Moreover, the pandemic-triggered food panic, turmoil, and other mass incidents also compromise the effects of pandemic control measures, and cause the further spread of the pandemic, resulting in a vicious cycle of “pandemic outbreak-food insecurity-pandemic persistence” (Figure 2).
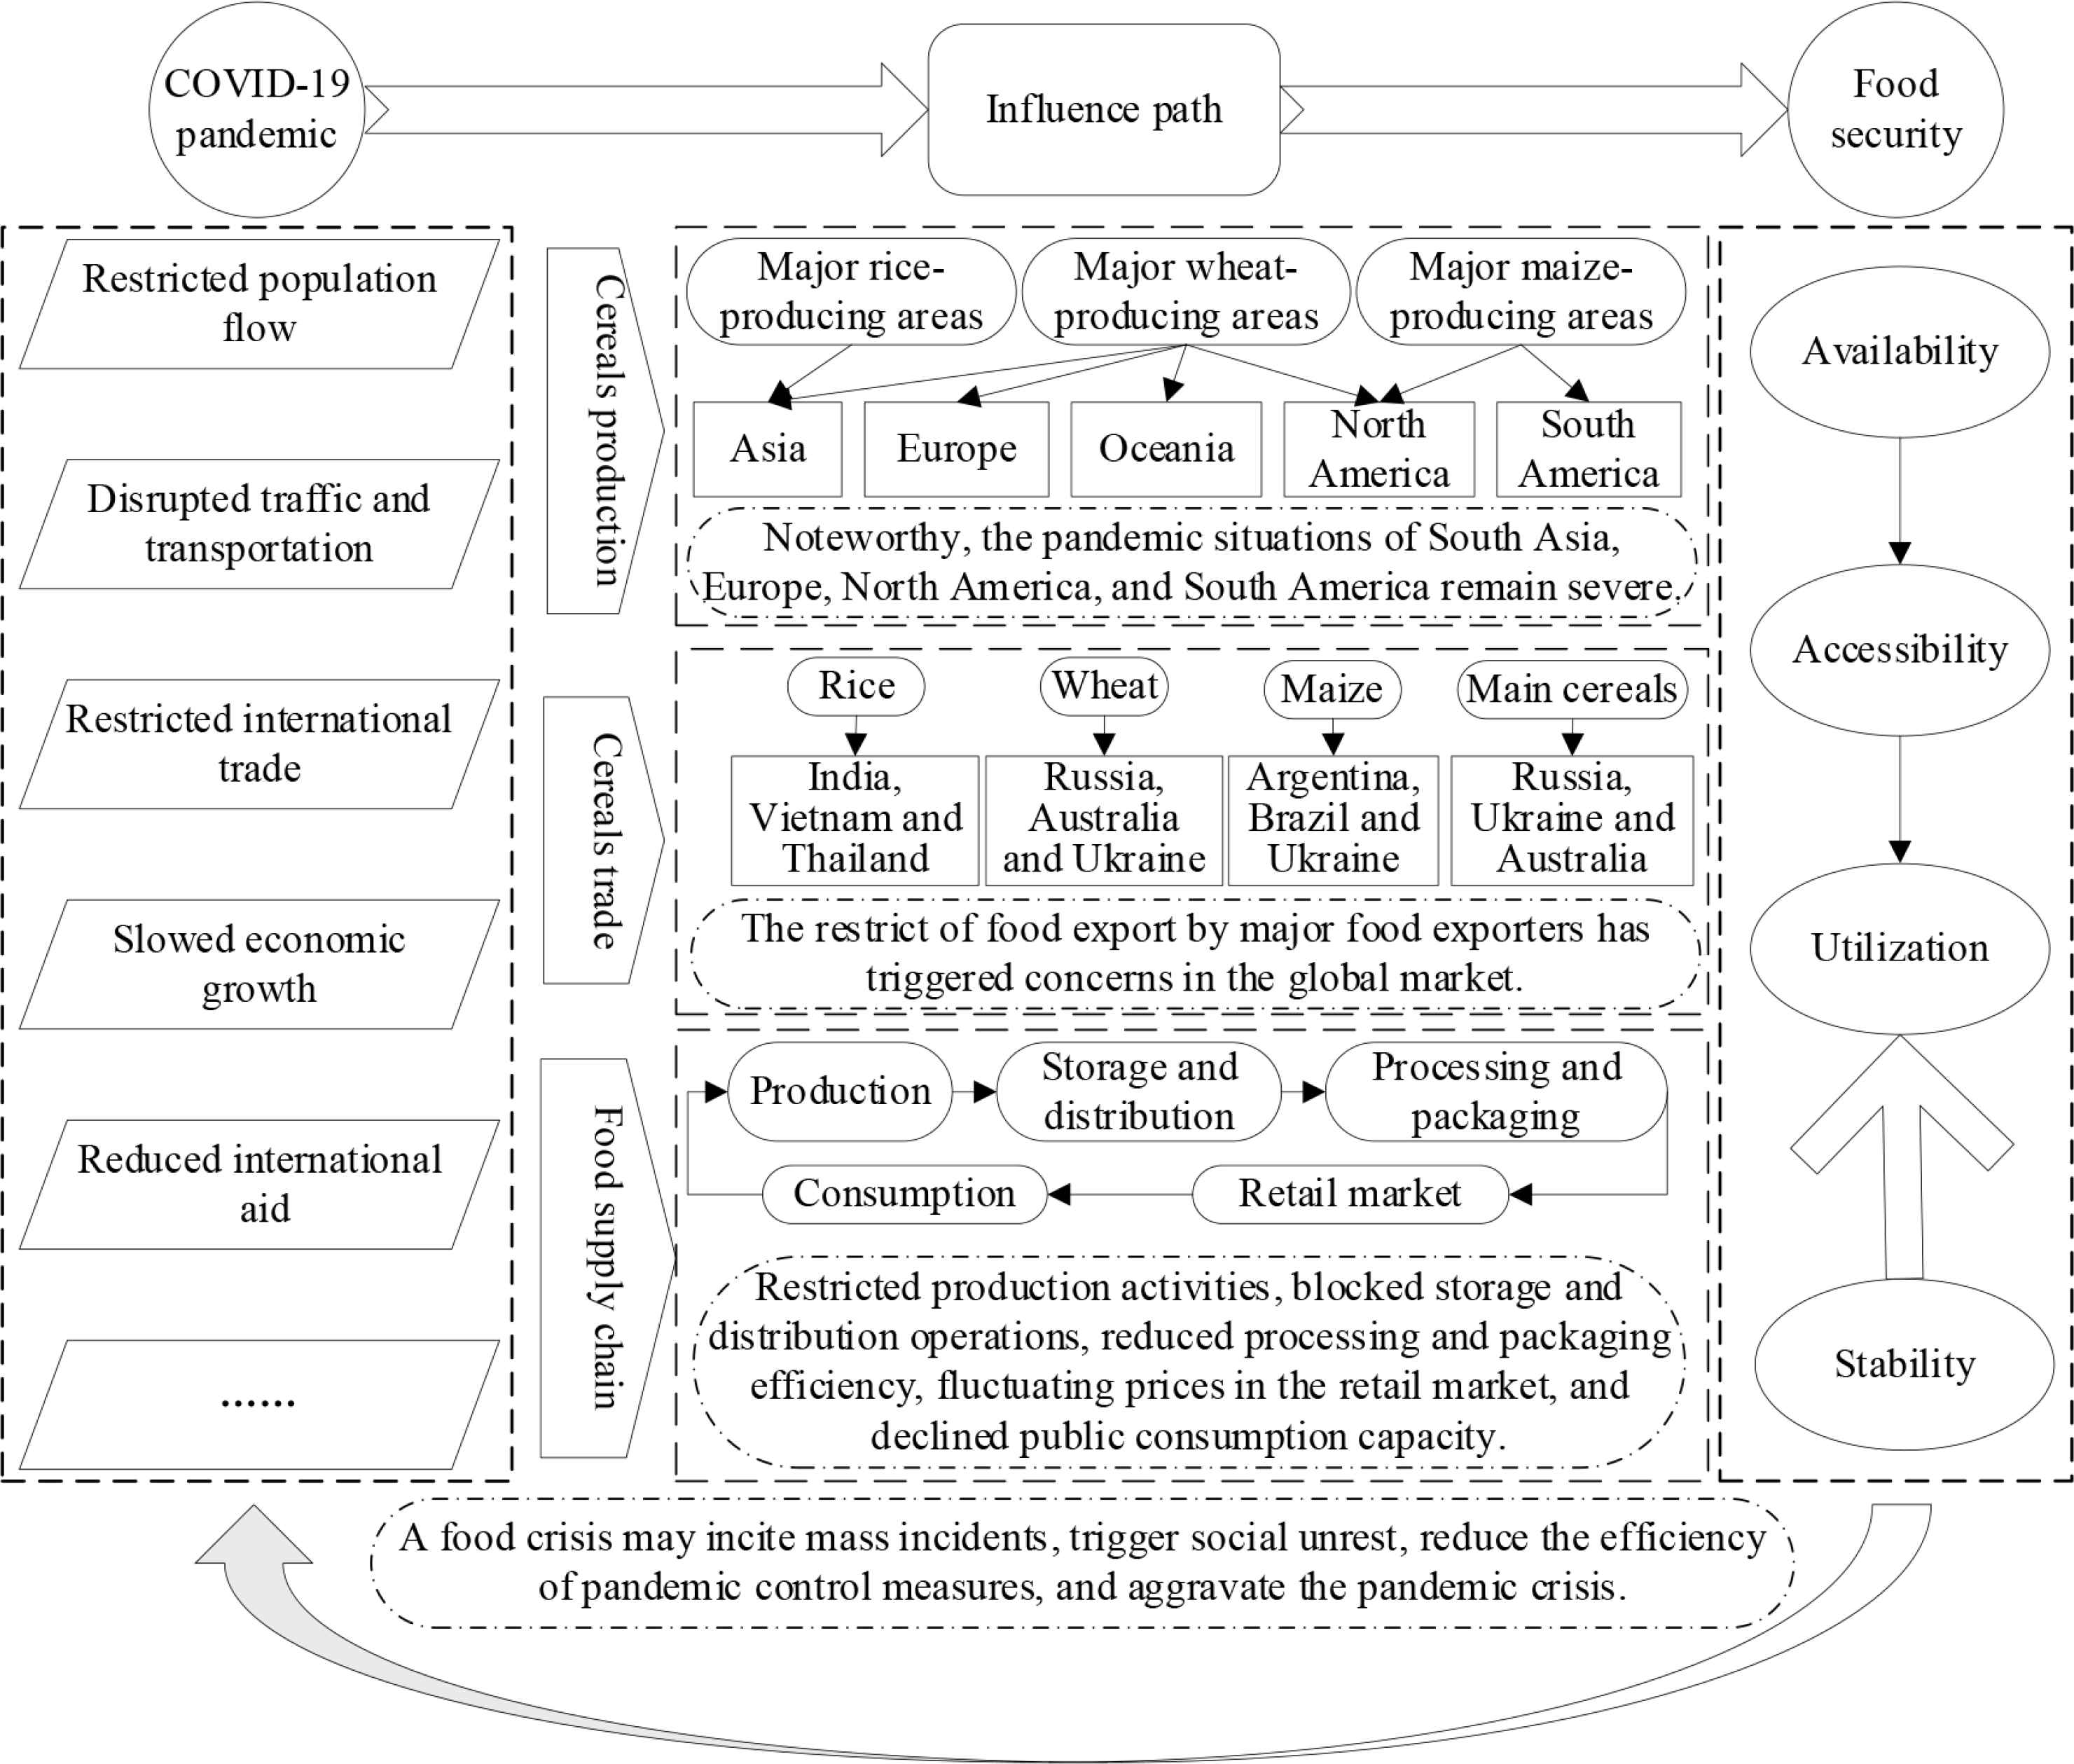
Transmission path between the COVID-19 pandemic and food security.
3. DATA AND METHODS
3.1. Definition of Concepts and Scope of Study
For the convenience of comparative analysis at the international scale, the definition of food adopted in this study is the same as that of cereals given in FAO’s food balance sheets, and main cereals include the rice, wheat, and maize described in FAO’s detailed trade matrix. The Belt and Road initiative (BRI) is an open international network for regional economic cooperation. With reference to related literature, this study states that along the Belt and Road, 65 countries (China included) are connected for facilitating global trade [23] (Table 1).
| Region | Country (ISO3 Code) | Quantity |
|---|---|---|
| Central Asia | Kazakhstan (KAZ); Kyrgyzstan (KGZ); Tajikistan (TJK); Turkmenistan (TKM); Uzbekistan (UZB) | 5 |
| China, Mongolia, and Russia | China (CHN); Mongolia (MNG); Russia (RUS) | 3 |
| Southeast Asia | Brunei (BRN); Myanmar (MMR); Indonesia (IDN); Cambodia (KHM); Laos (LAO); Malaysia (MYS); Philippines (PHL); Timor-Leste (TLS); Singapore (SGP); Thailand (THA); Vietnam (VNM) | 11 |
| South Asia | Afghanistan (AFG); Bangladesh (BGD); Bhutan (BTN); Sri Lanka (LKA); India (IND); Maldives (MDV); Nepal (NPL); Pakistan (PAK) | 8 |
| Central and Eastern Europe | Albania (ALB); Bulgaria (BGR); Belarus (BLR); Estonia (EST); Bosnia and Herzegovina (BIH); Hungary (HUN); Croatia (HRV); Latvia (LVA); Lithuania (LTU); Republic of Moldova (MDA); The Republic of North Macedonia (MKD); Czech Republic (CZE); Poland (POL); Romania (ROU); Slovenia (SVN); Slovakia (SVK); Ukraine (UKR); Serbia (SRB); Montenegro (MNE) | 19 |
| West Asia and the Middle East | Armenia (ARM); Bahrain (BHR); Azerbaijan (AZE); Egypt (EGY); Georgia (GEO); Iran (IRN); Iraq (IRQ); Israel (ISR); Jordan (JOR); Kuwait (KWT); Lebanon (LBN); Qatar (QAT); Saudi Arabia (SAU); Syrian Arab Republic (SYR); Oman (OMN); Turkey (TUR); United Arab Emirates (ARE); Yemen (YEM); Palestine (PSE) | 19 |
Countries along the Belt and Road
3.2. Data Sources and Processing
Food production, import, and export data were derived from FAO’s food balance sheets, and main cereals trade data were extracted from FAO’s detailed trade matrix. The MCTN was constructed by using import data, and specific indices were measured by using Gephi software. Noteworthy: (1) Considering the lack of related data on Syria, Palestine, Bahrain, Bhutan, Qatar, Brunei, and Singapore in FAO’s food balance sheet databases, these seven countries were excluded from discussion made herein. (2) The detailed trade matrix do not provide any data on Myanmar, Iraq, Laos, East Timor, Tajikistan, Turkmenistan, Uzbekistan, Vietnam, Montenegro, or Palestine as a Reporter Country, thus their data are substituted and supplemented through import/export conversion. (3) To overcome the influence of data fluctuations, the average value from 2015 to 2017 was adopted to characterize the level of the present stage. COVID-19 data were obtained from the World Health Organization (WHO) (https://covid19.who.int/) and Johns Hopkins University (https://coronavirus.jhu.edu/map.html), including new case, confirm case, recovered case, and deaths. We use the confirmed cases minus recovered and deaths case to get the current case. The data used in the study is from March 11 (the time when the WHO announced the COVID-19 pandemic globally) to December 31, 2020. Data on the pandemic risk were provided by Chen’s team (http://covid19-risk-index.com/). The data used in the study is from August 15 to December 31, 2020.
3.3. Methods
Network analysis has been widely used to understand complex systems. Currently, the usage of complex networks for tracking global and regional trade networks has become an important research trend [16,24]. In this paper, network analysis was applied to assess the characteristic of cereals flow and food security risks in the countries along the “Belt and Road”.
3.3.1. Measurement of trade network indices
- (1)
Node degree and node strength
Noteworthy, the distribution features of node degree reflect different network configurations, which differ from each other in vulnerability and weak links [25]. The specific indices are as follows [24]: Node degree (Ki) denotes the number of countries having direct trade connections with node Ki, defined as follows:
whereFurthermore, for a directed weighted network, node strength can be defined as consisting of out-strength (weighted outdegree) and in-strength (weighted indegree), as expressed below:
where - (2)
Betweenness centrality of nodes
Betweenness centrality (BC) is an index used to reflect the importance of a node, and is characterized by a number of the shortest paths passing through a node. It is defined in terms of the following formula:
where gsi is the number of the shortest paths from node s to node i; and
3.3.2. Integrated food security risk analysis
Starting with the investigation of the influence of the pandemic on food security, this study took into comprehensive consideration the stability of food supply and the influence of the pandemic risk, and constructed a four-dimensional integrated Food Security Risk Index (FSRI) model. This model is composed of our indices, i.e., Per Capita Cereals Possession Index (PERCI), External Dependence Index (EDI), Herfindahl–Hirschman Index (HHI), and COVID-19 Risk Index (CRI), as defined below:
- (1)
Per capita cereals possession index is defined as the ratio of the cereals production to the population of a country. It reflects the self-sufficiency of the country in the food supply, and measures the domestic supply risk. That is, the greater the values of PERCI, the lower the food security risk.
- (2)
External dependence index is defined as the ratio of net cereals-import to apparent cereals consumption (apparent cereals consumption = domestic cereals production + net cereals-import), and measures the external dependence of a country for cereals, that is, the greater the value, the higher the security risk. Referring to existing studies [27], this study divides EDI into five levels, i.e., dangerous (>18%), insecure (18–13%), basically secure (13–5%), secure (0–5%), and absolutely secure (<0%).
- (3)
Import concentration is defined as the quadratic sum of the percentage of food imports from various origin countries of import in the total import, and often measured by using the HHI [28]. It is an important index reflecting the diversification level of import markets. A greater HHI value indicates that a single food exporter has a greater influence on the food security of the country under examination. Notably, HHI values generally range between 0 and 1; therefore, they are often multiplied by 10,000 for amplification. They are classified into five types, i.e., high oligopoly I type (>3000), high oligopoly II type (1800–3000), low oligopoly I type (1400–1800), low oligopoly II type (500–1400), and competitive type (0–500) [29].
- (4)
COVID-19 risk index refers to the pandemic risk level of a country, obtained through calculating the weighted sum of the following nine indices: cases per 100k population, tests per 100k population, total positive, new positive, case fatality rate, new confirmed case growth rate, new death case growth rate, active cases per 100k population, NPI effectiveness. A greater CRI value indicates a greater influence on food security. Considering the availability of data and to overcome the influence of data fluctuations, in this study, the average value from August 15 to December 31, 2020, was adopted to characterize the general level of the pandemic risk. CRI values generally range between 0 and 100; therefore, herein it is divided into five levels based on the equidistant partition method, i.e., very high (80–100), high (80–60), medium (60–40), low (40–20), and very low (20–0).
All the assessment factors affect food security, and they are all important in the construction of the FSRI. Considering this, and to avoid uncertain interferences with construction results caused by subjective weight settings and prevent partial weight imbalance from affecting comprehensive assessment results [30], in this study, equal weight settings were adopted for the four assessment factors, that is, a weight of 0.25 for each. Further, they were homogenized by the following methods: (1) No domestic supply risk is posed in countries with a large value of PERCI, thus the ratio of the PERCI of a country to the global average PERCI (400 kg) is adopted as the PERCI risk index. If this ratio is greater than 1, a value of 1 is assigned. If it is less than 1, the original value is adopted, in this way, the processed value falls within the range of 0–1. (2) A country with a negative value of EDI is a net food-exporter country without any EDI risk, and is assigned a value of 0. For a country with a positive EDI, the original value is adopted, and the processed value falls within the range of 0–100%. (3) The HHI value and the pandemic risk value fall within the ranges of 0–1 and 0–100, respectively, and the original values are retained for them. (4) To narrow down the dimension gap so that statistics of indices can be obtained under the same conditions, factor thresholds are re-graded by the equal interval. To be specific, PERCI values are graded into 10 levels (1–10) in descending order; while EDI, HHI, and CRI values are graded into ten levels (1–10) in ascending order, respectively. Integrated food security risk analysis is performed by additive synthesis based on the weights of assessment factors [31], as expressed below:
| Dominant factor type | Classification criteria | Name |
|---|---|---|
| Single factor-dominated type | RPERCI > 50% | Domestic supply risk |
| RDEI > 50% | EDI risk | |
| RHHI > 50% | HHI risk | |
| RCRI > 50% | Pandemic risk | |
| Multi-factor affected type | Two of RPERCI, RDEI, RHHI, and RCRI fall within the range of 30–50% at the same time | Dual risks |
| All of RPERCI, RDEI, RHHI, and RCRI are below 50%, and are not above 30% at the same time | Compound risks |
Classification criteria on the dominant factors of the integrated food security risk
4. IDENTIFICATION AND DETERMINATION OF POTENTIAL FOOD SECURITY RISKS
4.1. Identification of the Features and Risk Nodes of the Trade Network
4.1.1. Features and core nodes of the trade network
In 2015–2017, the annual average food import and export of the countries along the Belt and Road reached 1.90 and 2.03 × 10⁸ tons, accounting for 38.85 and 39.29% of the global average, respectively. These countries have formed an extensive MCTN with 128 nodes and 1935 edges, and established connections with more than half of the countries worldwide (Figure 3).
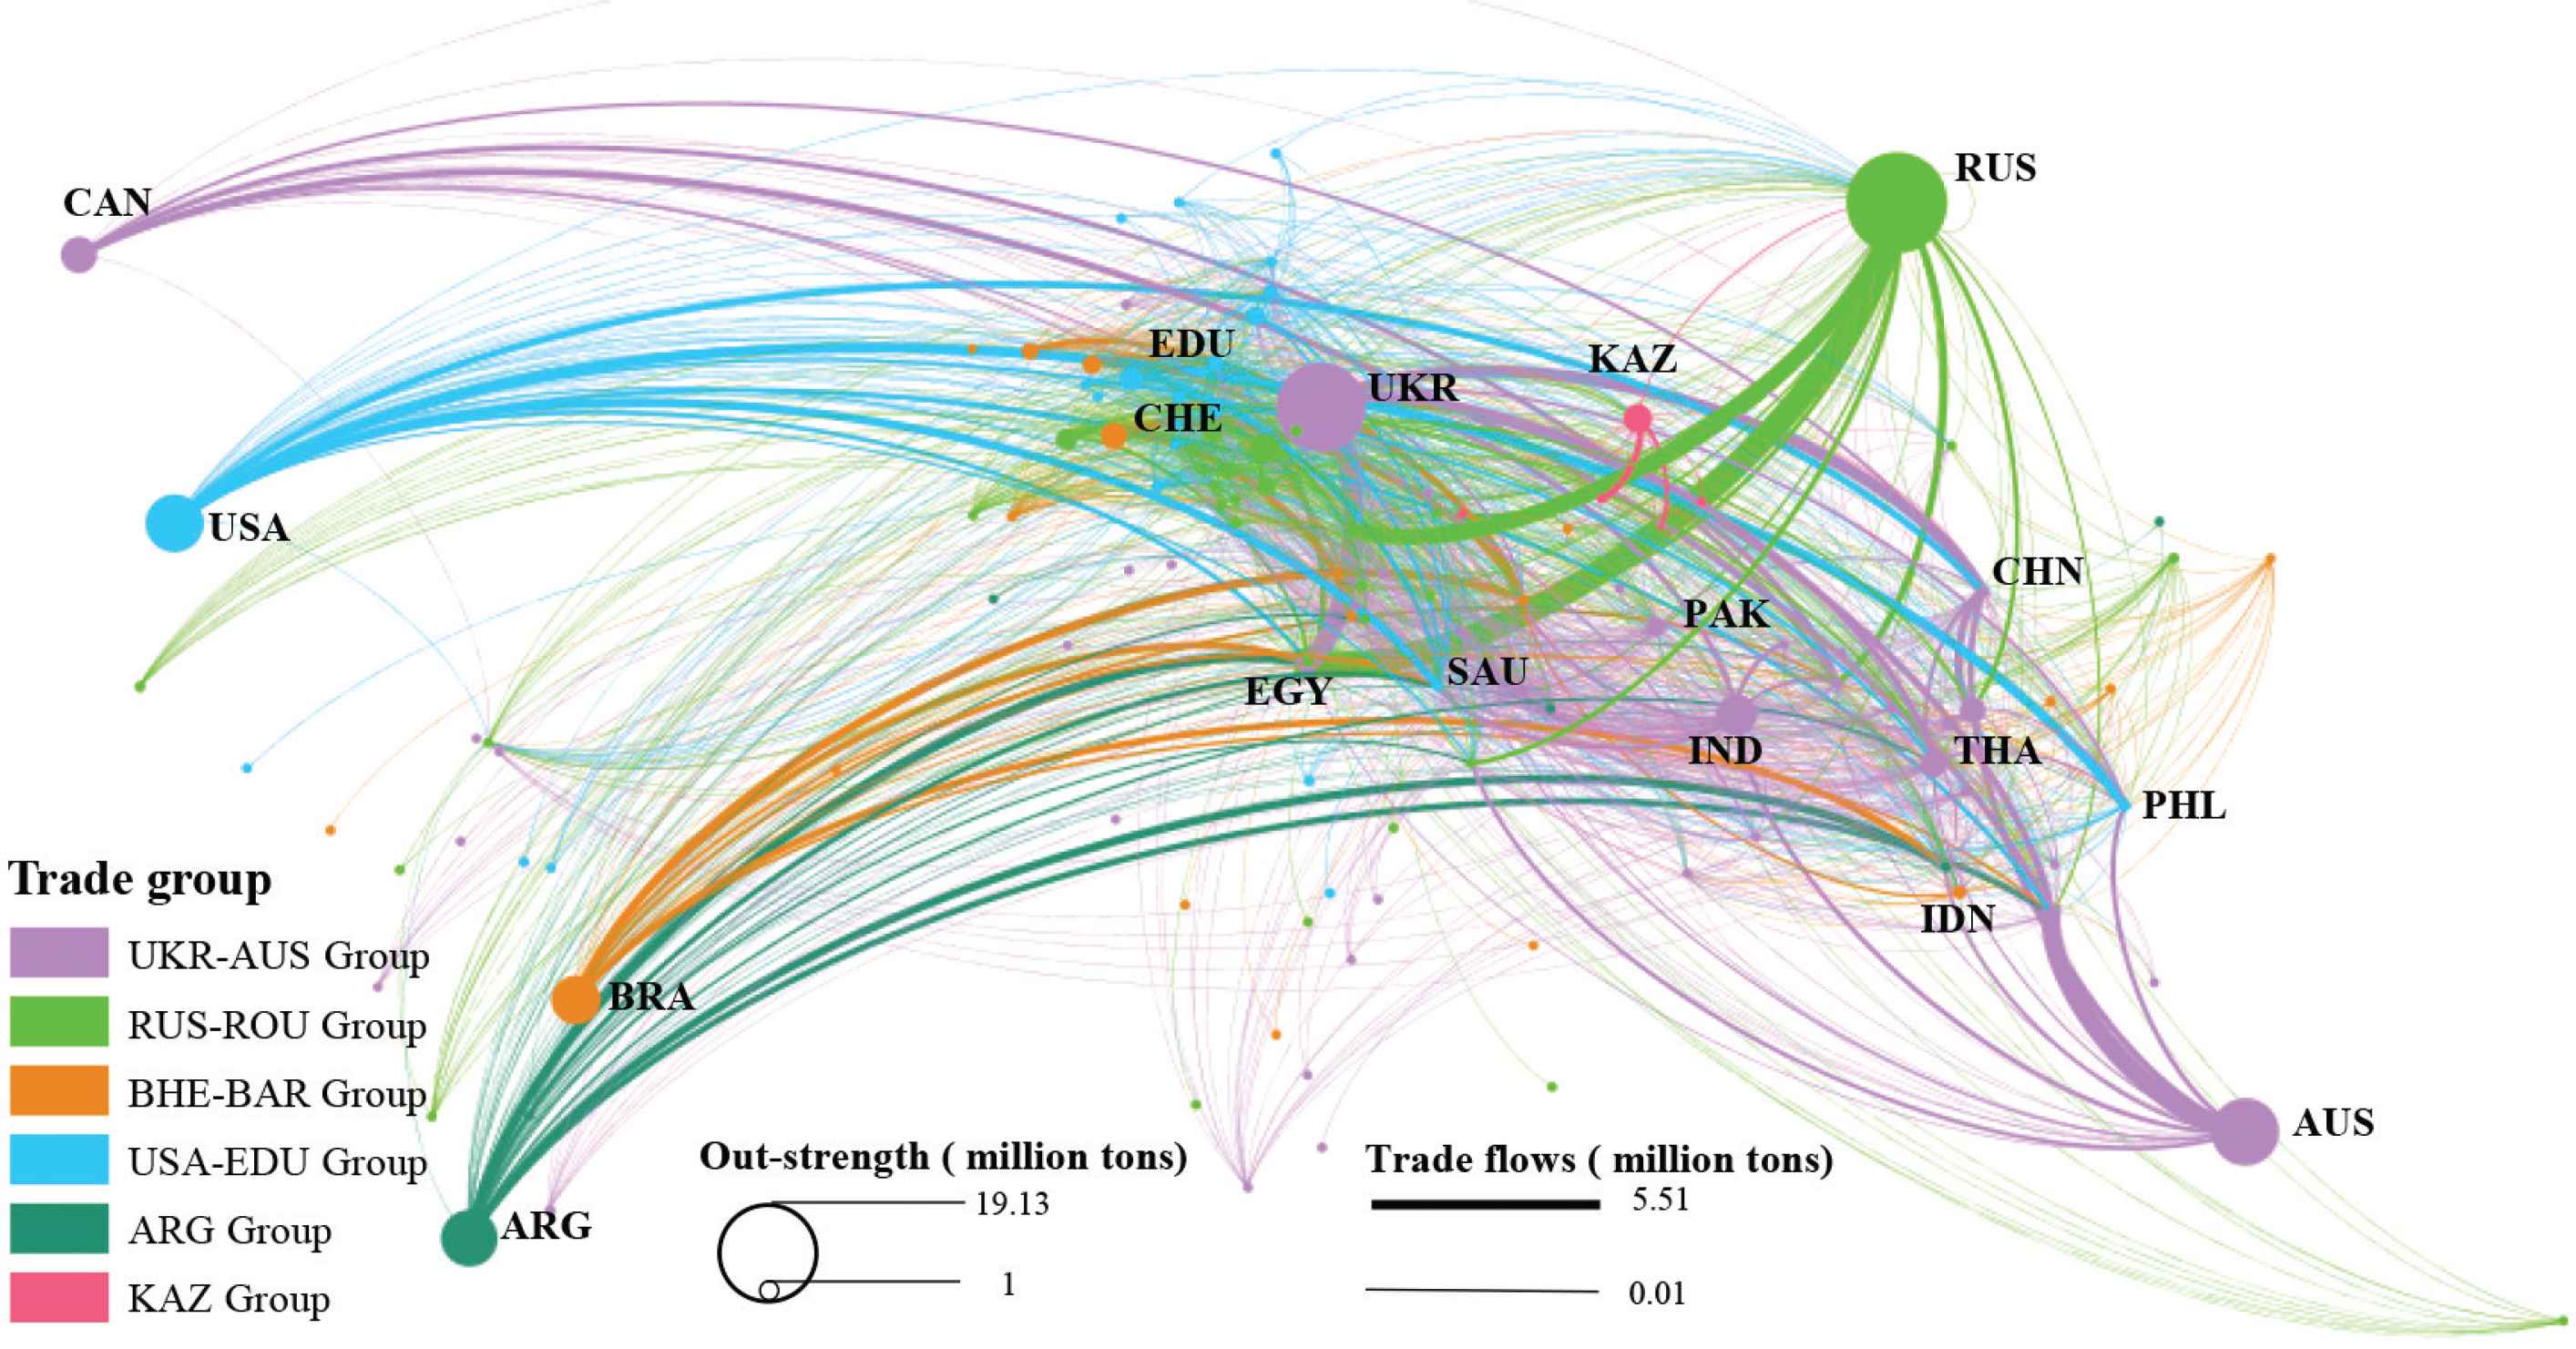
Main cereals trade network of countries along the Belt and Road.
Figure 4 shows the distribution of degree and strength probabilities. Clearly, the distribution of main network nodes obeys the power law, and presents long-tailed distribution features, thus the network is a scale-free network. In general, the connectivity of networks with this structure type is highly stable in case of a random network fault; nonetheless, becomes extremely vulnerable under malicious attacks. Noteworthy, with the removal of a few nodes with high a degree or strength values, the connectivity of the entire network is jeopardized [26]. In other words, maintaining the stable trade flow among core nodes offers an effective way of preventing the destructive interruption or collapse of the MCTN of countries along the Belt and Road.
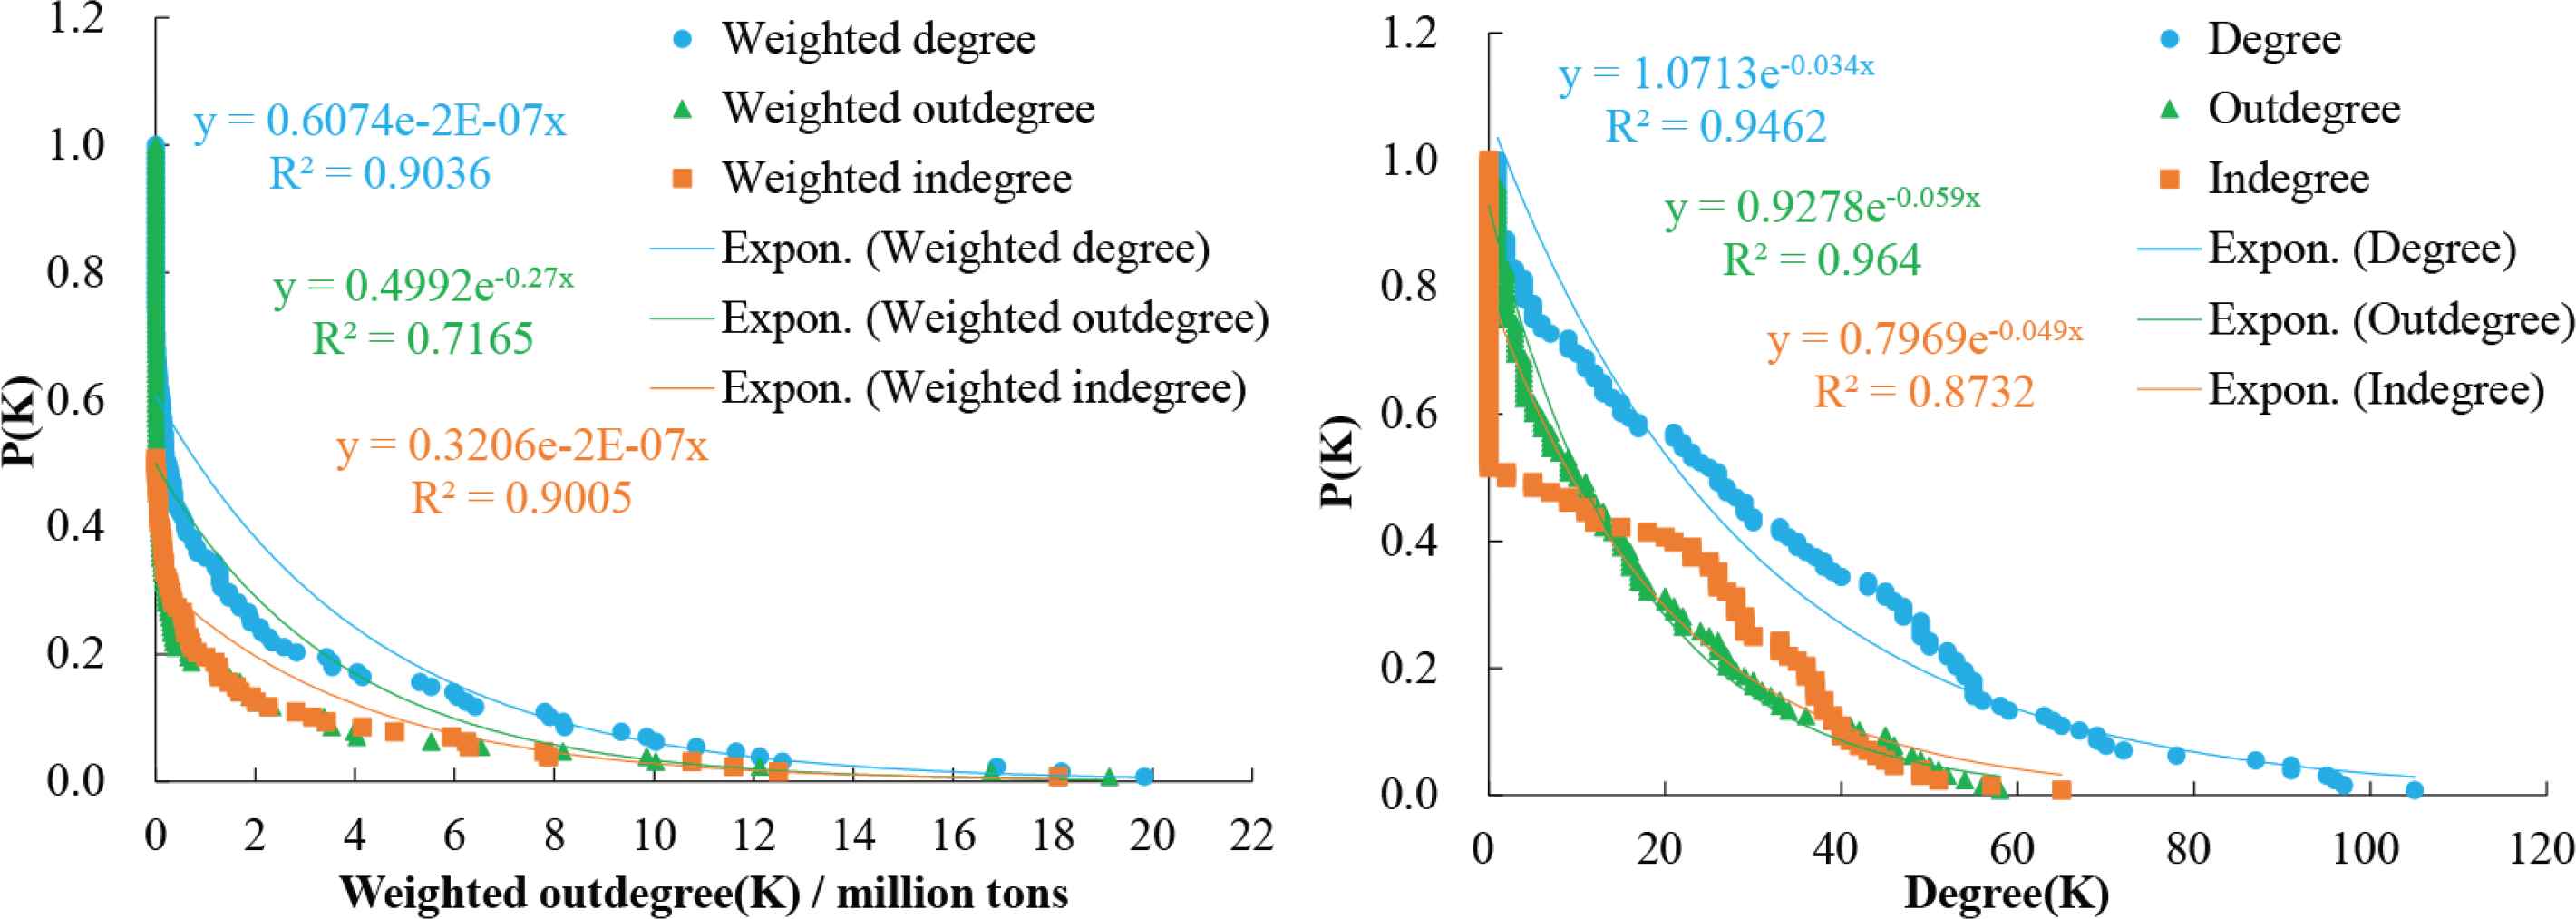
Fitting of trade network degree and weighted degree probability distribution.
One premise of guarding against the risks of a MCTN includes the identification of the core nodes of the network. According to the results of core node identification in the export market, the export of the top ten countries accounts for 72.63% of the total export of the trade network at the global scale. According to the scatter diagram drawn using outdegree and weighted outdegree, the values of weighted outdegree of Russia and Ukraine are 19.13 and 16.76 × 10⁶ tons, accounting for 14.45% and 12.66% of the trade network, respectively (Table 2). The outdegrees of Russia and Ukraine are 2.92 and 3.24 times of the network average, respectively. Clearly, they show absolute dominance in the export market. Seven countries (including India, Thailand, and Pakistan) show an outdegree value of above 45 (three times of the network average), thus capable of seizing important places in the trade network. Moreover, United Arab Emirates, Vietnam, Germany, Romania, and China exhibit low weighted outdegrees, but have established relatively extensive external connections. With an outdegree value of 40–45, they also exert some influence on the trade network (Figure 5a).
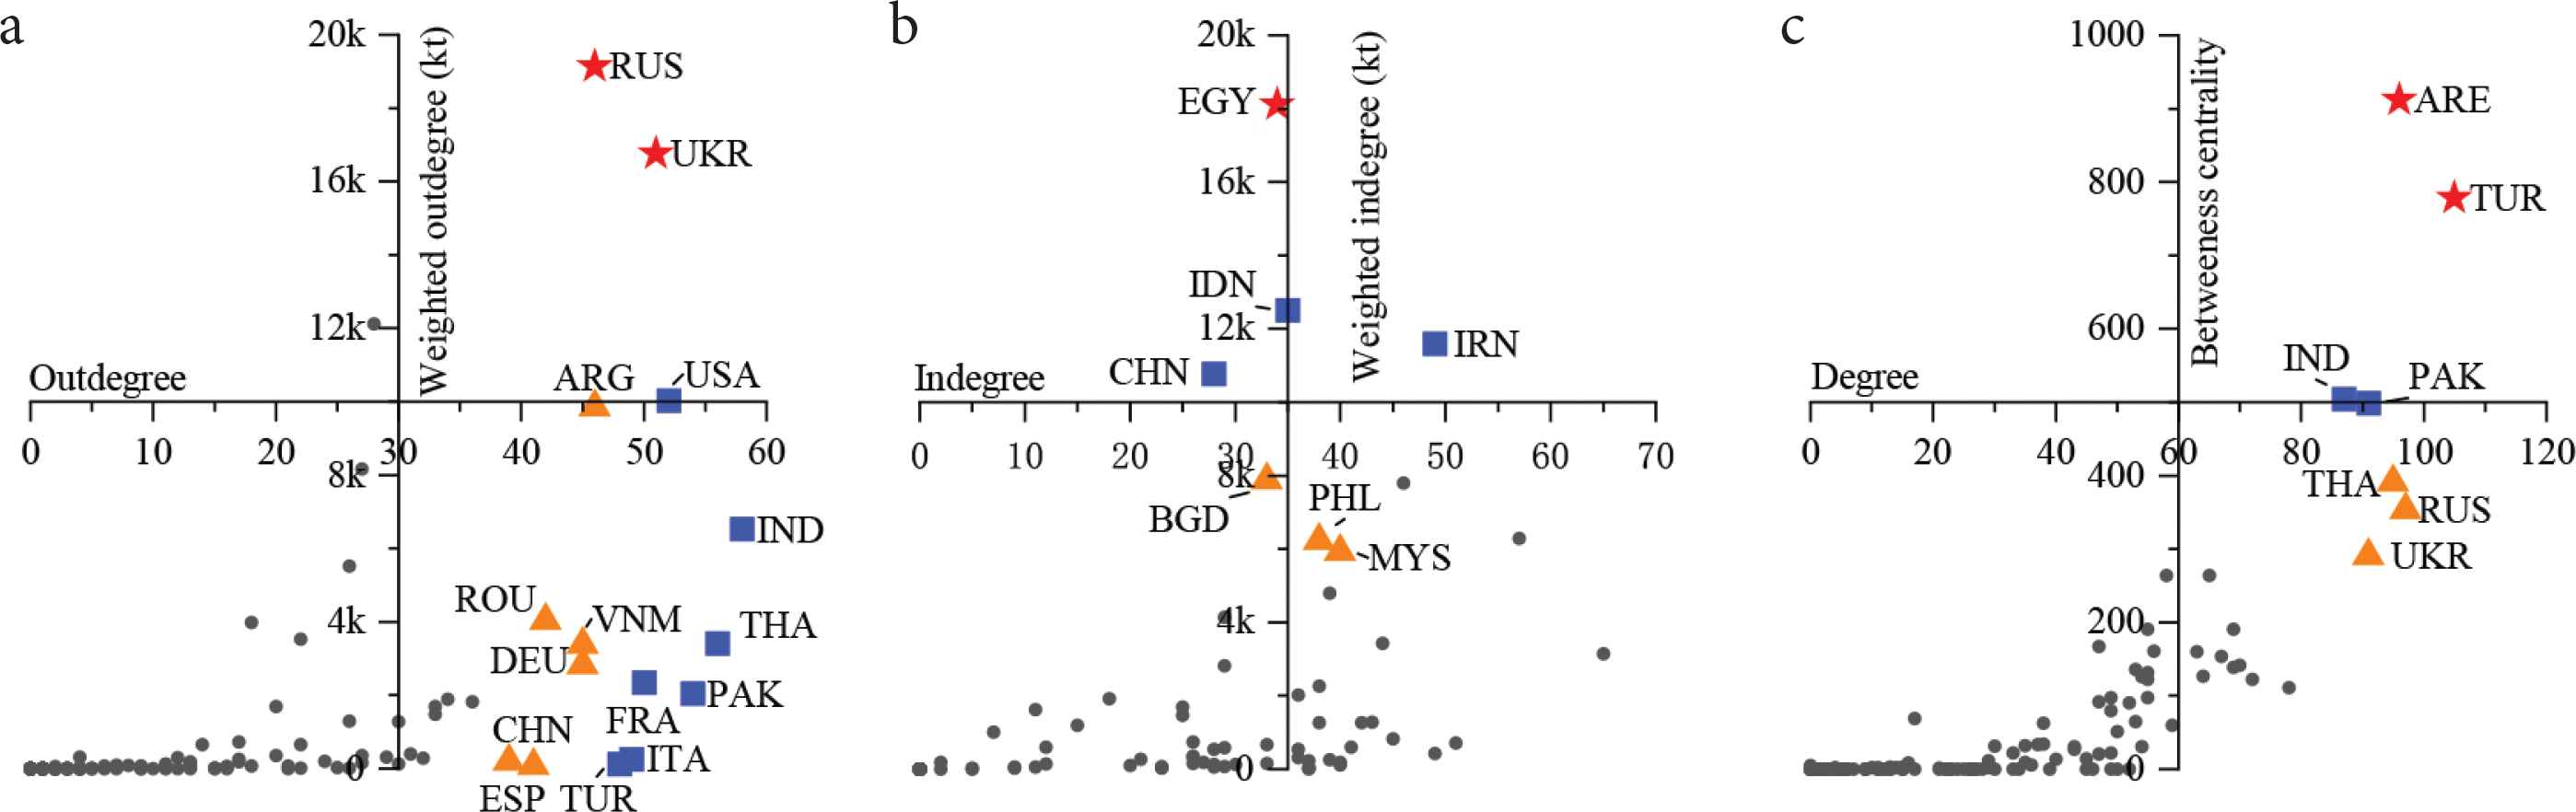
Scatter diagrams of countries along the Belt and Road: (a) outdegree vs. weighted outdegree; (b) indegree vs. weighted indegree; and (c) degree vs. BC.
The import market is dominated by major food importers. The import by the top ten countries accounts for 69.41% of the total import of the trade network. The scatter diagram drawn by using indegree and weighted indegree (Figure 5b) reveals that Egypt has a weighted indegree of 18.10 × 10⁶ tons, accounting for 13.68% of the total import of the trade network. The weighted indegrees of India, Iran, and China all exceed 10 × 106 tons, and account for 9.44%, 8.76%, and 8.13% of the trade network, respectively. Bangladesh, Philippines, and Malaysia have high weighted indegrees, but low indegrees (Table 3). On the one hand, countries with a high weighted degree, but a low indegree import in large volume relatively from a single source; as a result, they face a high HHI risk. On the other hand, faced with unstable import sources, these countries have to seek substitutes on the global market, which is likely to cause fluctuations in the MCTN and increases the external supply risk of food security worldwide.
| Rank | Country | Out-strength | Outdegree (#Nations) | Country | In-strength | Indegree (#Nations) | ||
|---|---|---|---|---|---|---|---|---|
| Quantity (million tons) | Proportion (%) | Quantity (million tons) | Proportion (%) | |||||
| 1 | RUS | 19.13 | 14.45 | 46 | EGY | 18.10 | 13.68 | 34 |
| 2 | UKR | 16.76 | 12.66 | 51 | IDN | 12.50 | 9.44 | 35 |
| 3 | AUS | 12.12 | 9.16 | 28 | IRN | 11.59 | 8.76 | 49 |
| 4 | USA | 10.03 | 7.58 | 52 | CHN | 10.76 | 8.13 | 28 |
| 5 | ARG | 9.85 | 7.44 | 46 | BGD | 7.88 | 5.95 | 33 |
| 6 | BRA | 8.17 | 6.17 | 27 | SAU | 7.79 | 5.89 | 46 |
| 7 | IND | 6.52 | 4.93 | 58 | TUR | 6.29 | 4.75 | 57 |
| 8 | CAN | 5.53 | 4.17 | 26 | PHL | 6.23 | 4.71 | 38 |
| 9 | ROU | 4.04 | 3.05 | 42 | MYS | 5.93 | 4.48 | 40 |
| 10 | KAZ | 3.98 | 3.01 | 18 | THA | 4.79 | 3.62 | 34 |
| / | Total | 96.14 | 72.63 | / | Total | 91.87 | 69.41 | / |
| / | BRI | 132.37 | 100 | / | BRI | 132.37 | 100 | / |
Network attributes of countries ranked top ten in the main cereals trade network
Important betweenness countries in the trade network are of vital significance for the stability of the network, and also constitute critical risk points of the network. The scatter diagram drawn using degree value and BC (Figure 5c) indicates that the United Arab Emirates and Turkey have large degree values and BC, and play critical connecting roles in the trade network. Moreover, India and Pakistan also offer important connecting functions. Thailand, Russia, and Ukraine belong to the third echelon in terms of degree value and BC, and also serve as critical nodes of the trade network. The adverse impact of the pandemic on the food production, processing, and transportation links of these countries may weaken the functions and efficiency of these countries as operating hubs in the trade network, resulting in the inefficiency or even collapse of the trade network as a whole.
4.1.2. Pandemic situations and potential influence
Based on the comprehensive consideration of weighted outdegree, outdegree, and BC, this study analyzes the pandemic situations and potential influence of countries having a significant impact on international trade along the Belt and Road. The situations of pandemic control in Russia and Ukraine, both core dominant countries of the trade network, are highly discouraging. Russia is undergoing the third peak of the pandemic, with the fourth largest cumulative number of confirmed cases in the world. However, Ukraine, failing to control its pandemic situations, has a cumulative total of more than one million confirmed cases. The US and Argentina, taking a back seat, are experiencing the ongoing spread of the COVID-19. The US has ranked first in the world for a long time in terms of new confirmed cases, existing confirmed cases, and cumulative confirmed cases [32]. In contrast, Argentina has a large number of new confirmed cases and a cumulative total of more than 1.7 million confirmed cases. Thailand has seen a rapid increase in its new confirmed cases since December 2020. Relatively speaking, Australia has performed well in controlling the pandemic situation. Although India has contained its pandemic situations to some extent; with the second largest cumulative number of confirmed cases, it still has a long haul ahead. Both, United Arab Emirates and Pakistan, with prominent BC effects, have experienced a secondary outbreak of the pandemic. Noteworthy, the history of food market crises has made it clear that the stability of export by major exporters is highly correlated with the stability of the global food market [33]. Moreover, the pandemic that has been continuously spreading in several countries has severely affected seeding and other food production links, thus the instability of food production and trade induced hereby is likely to pose potential risks to the global food market in the future (Figure 6).
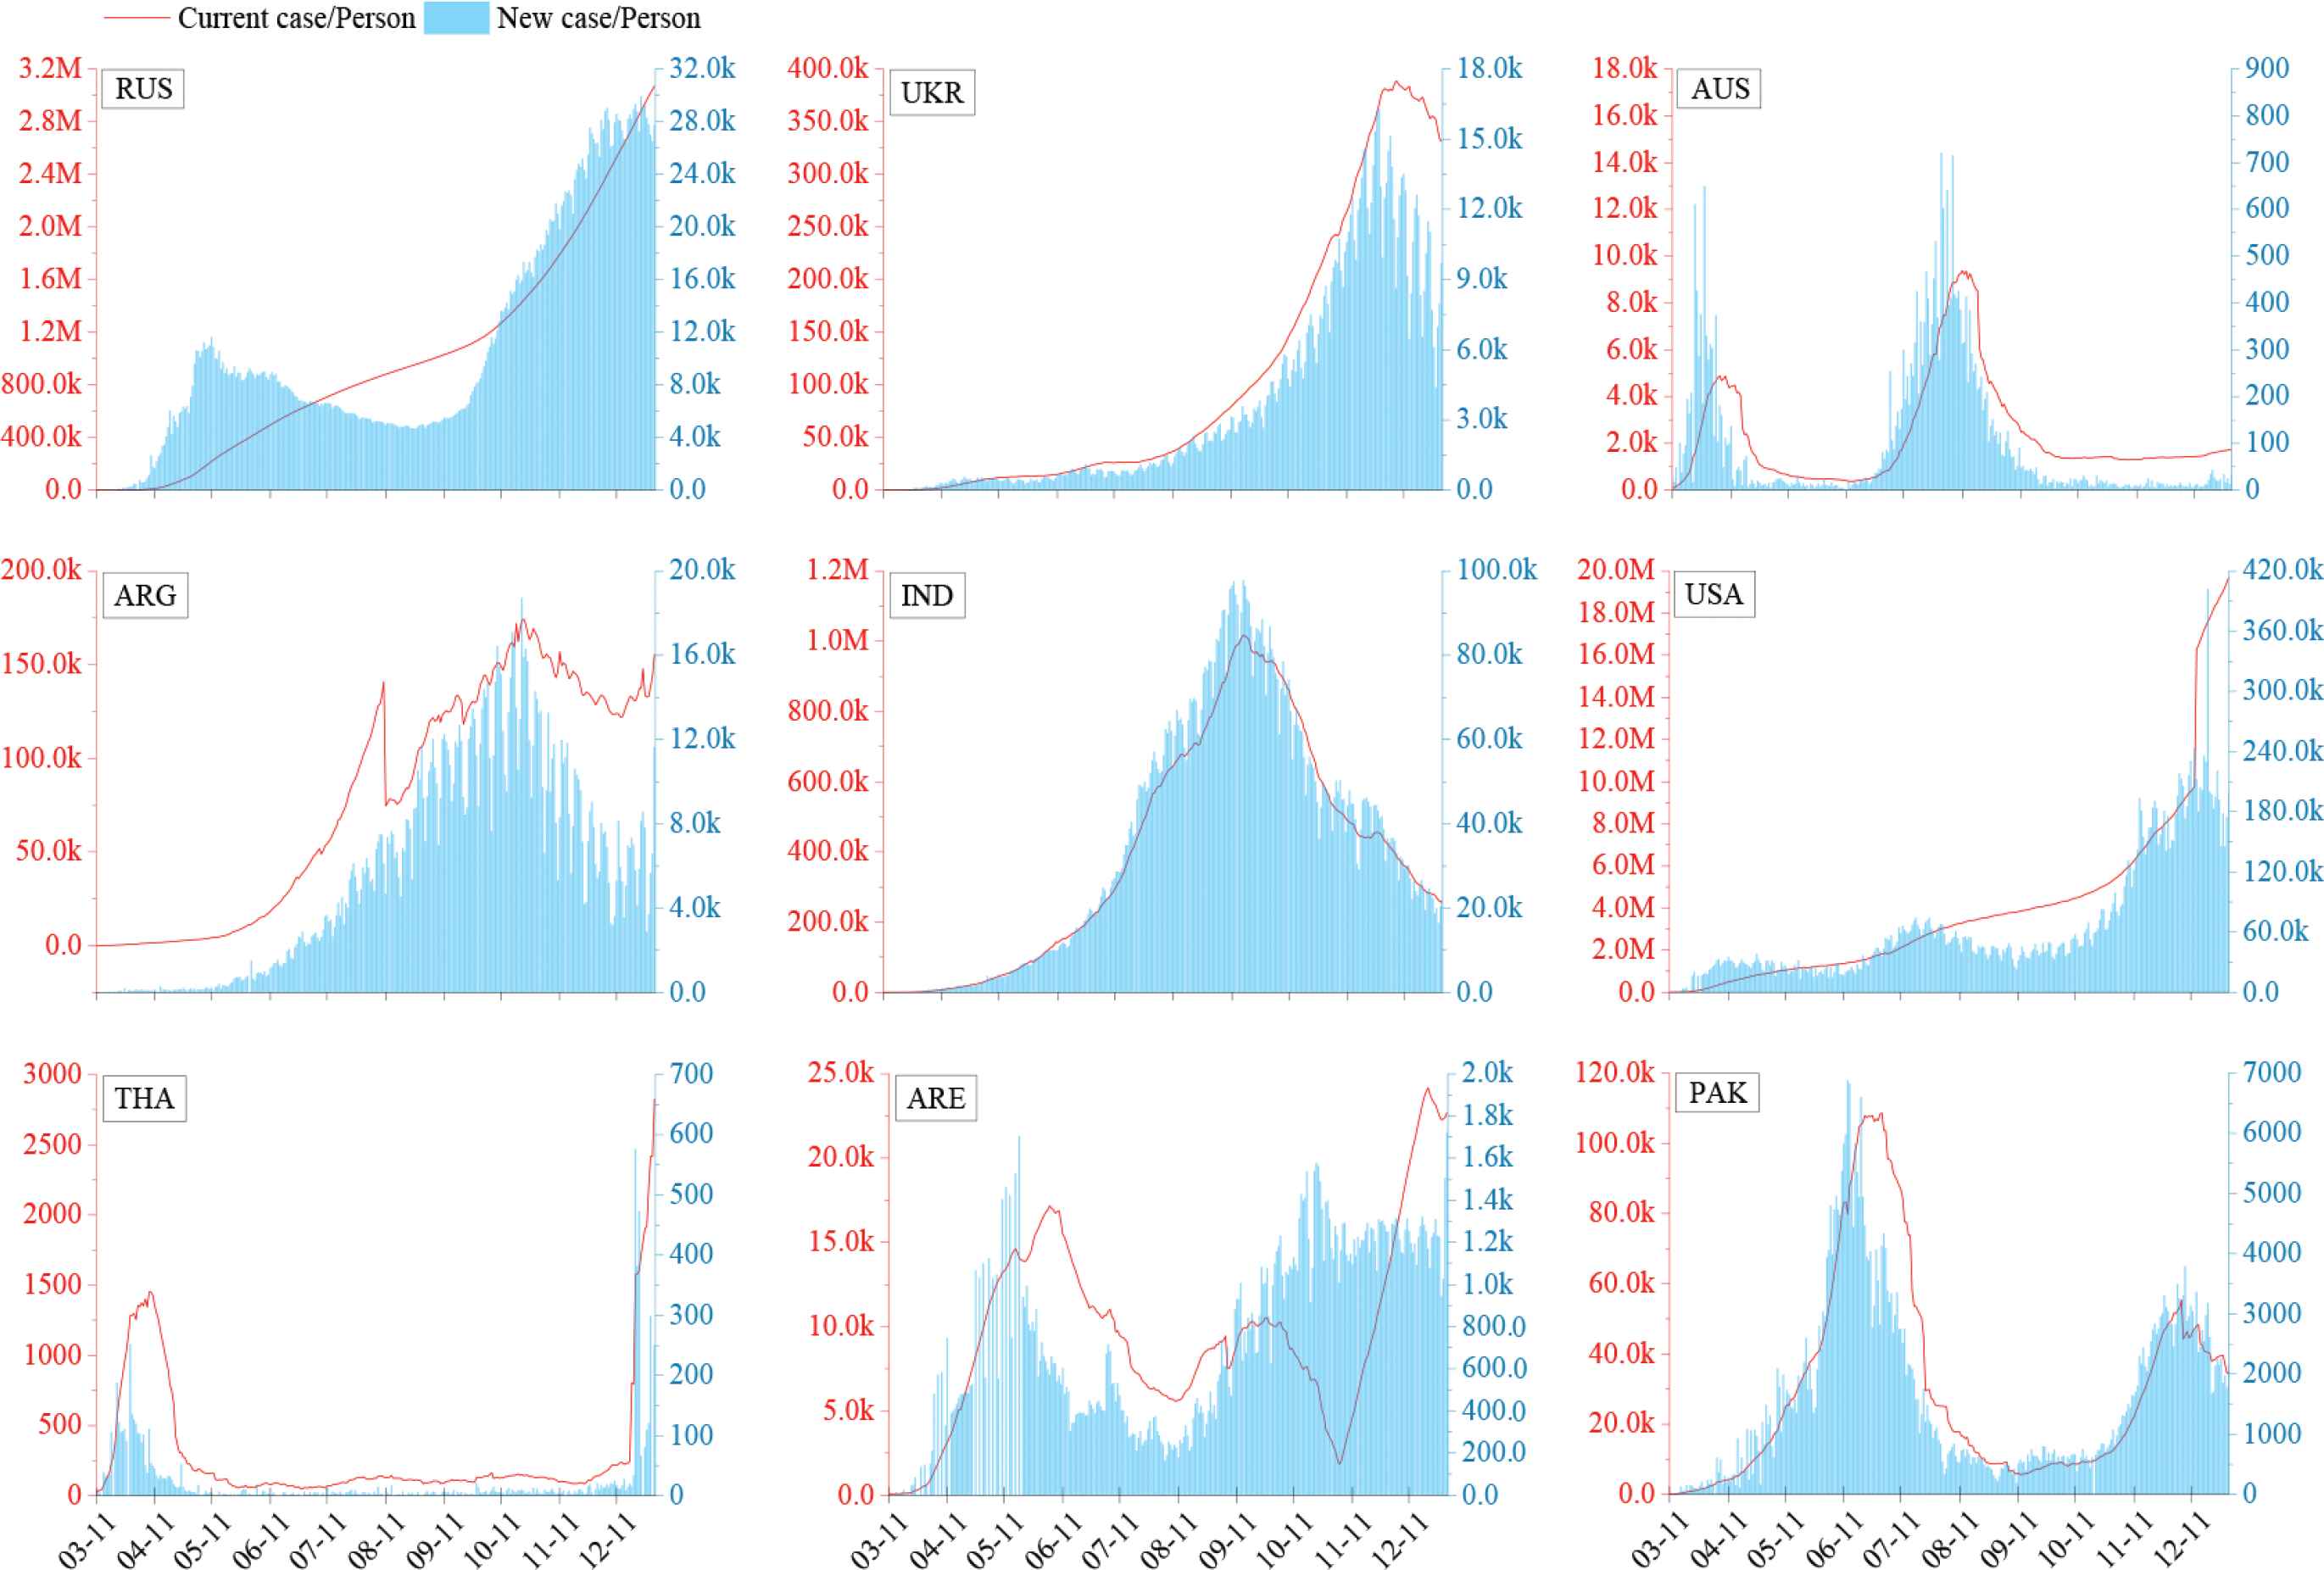
Pandemic situations of core countries having a significant influence on international trade along the Belt and Road.
4.2. Spatial Pattern of Food Security
Data related to the domestic supply in the period of 2015–2017 indicate that countries along the Belt and Road had an annual average food production of 17.17 × 10⁸ tons, accounting for 58.60% of the global average, and a per capita cereals possession of 371.16 kg corresponding to 92.23% of the global average only. The per capita cereals possessions of 35 countries (involving 2.56 billion people) were below the global average, and those of 19 countries (involving 246 million people) were below 200 kg. In terms of spatial distribution, these 19 countries included 11 in West Asia and the Middle East (including Armenia, Iraq, Georgia, and Saudi Arabia), three in South Asia (Afghanistan, Sri Lanka, and Maldives), and East Timor and Malaysia in Southeast Asia, as well as Tajikistan, The Republic of North Macedonia, and Mongolia. A majority of these countries showed unfavorable food production conditions, unstable political situations, or vulnerable food supply chains, and were more likely to see an intensified domestic supply risk under the pandemic situation (Figure 7a).
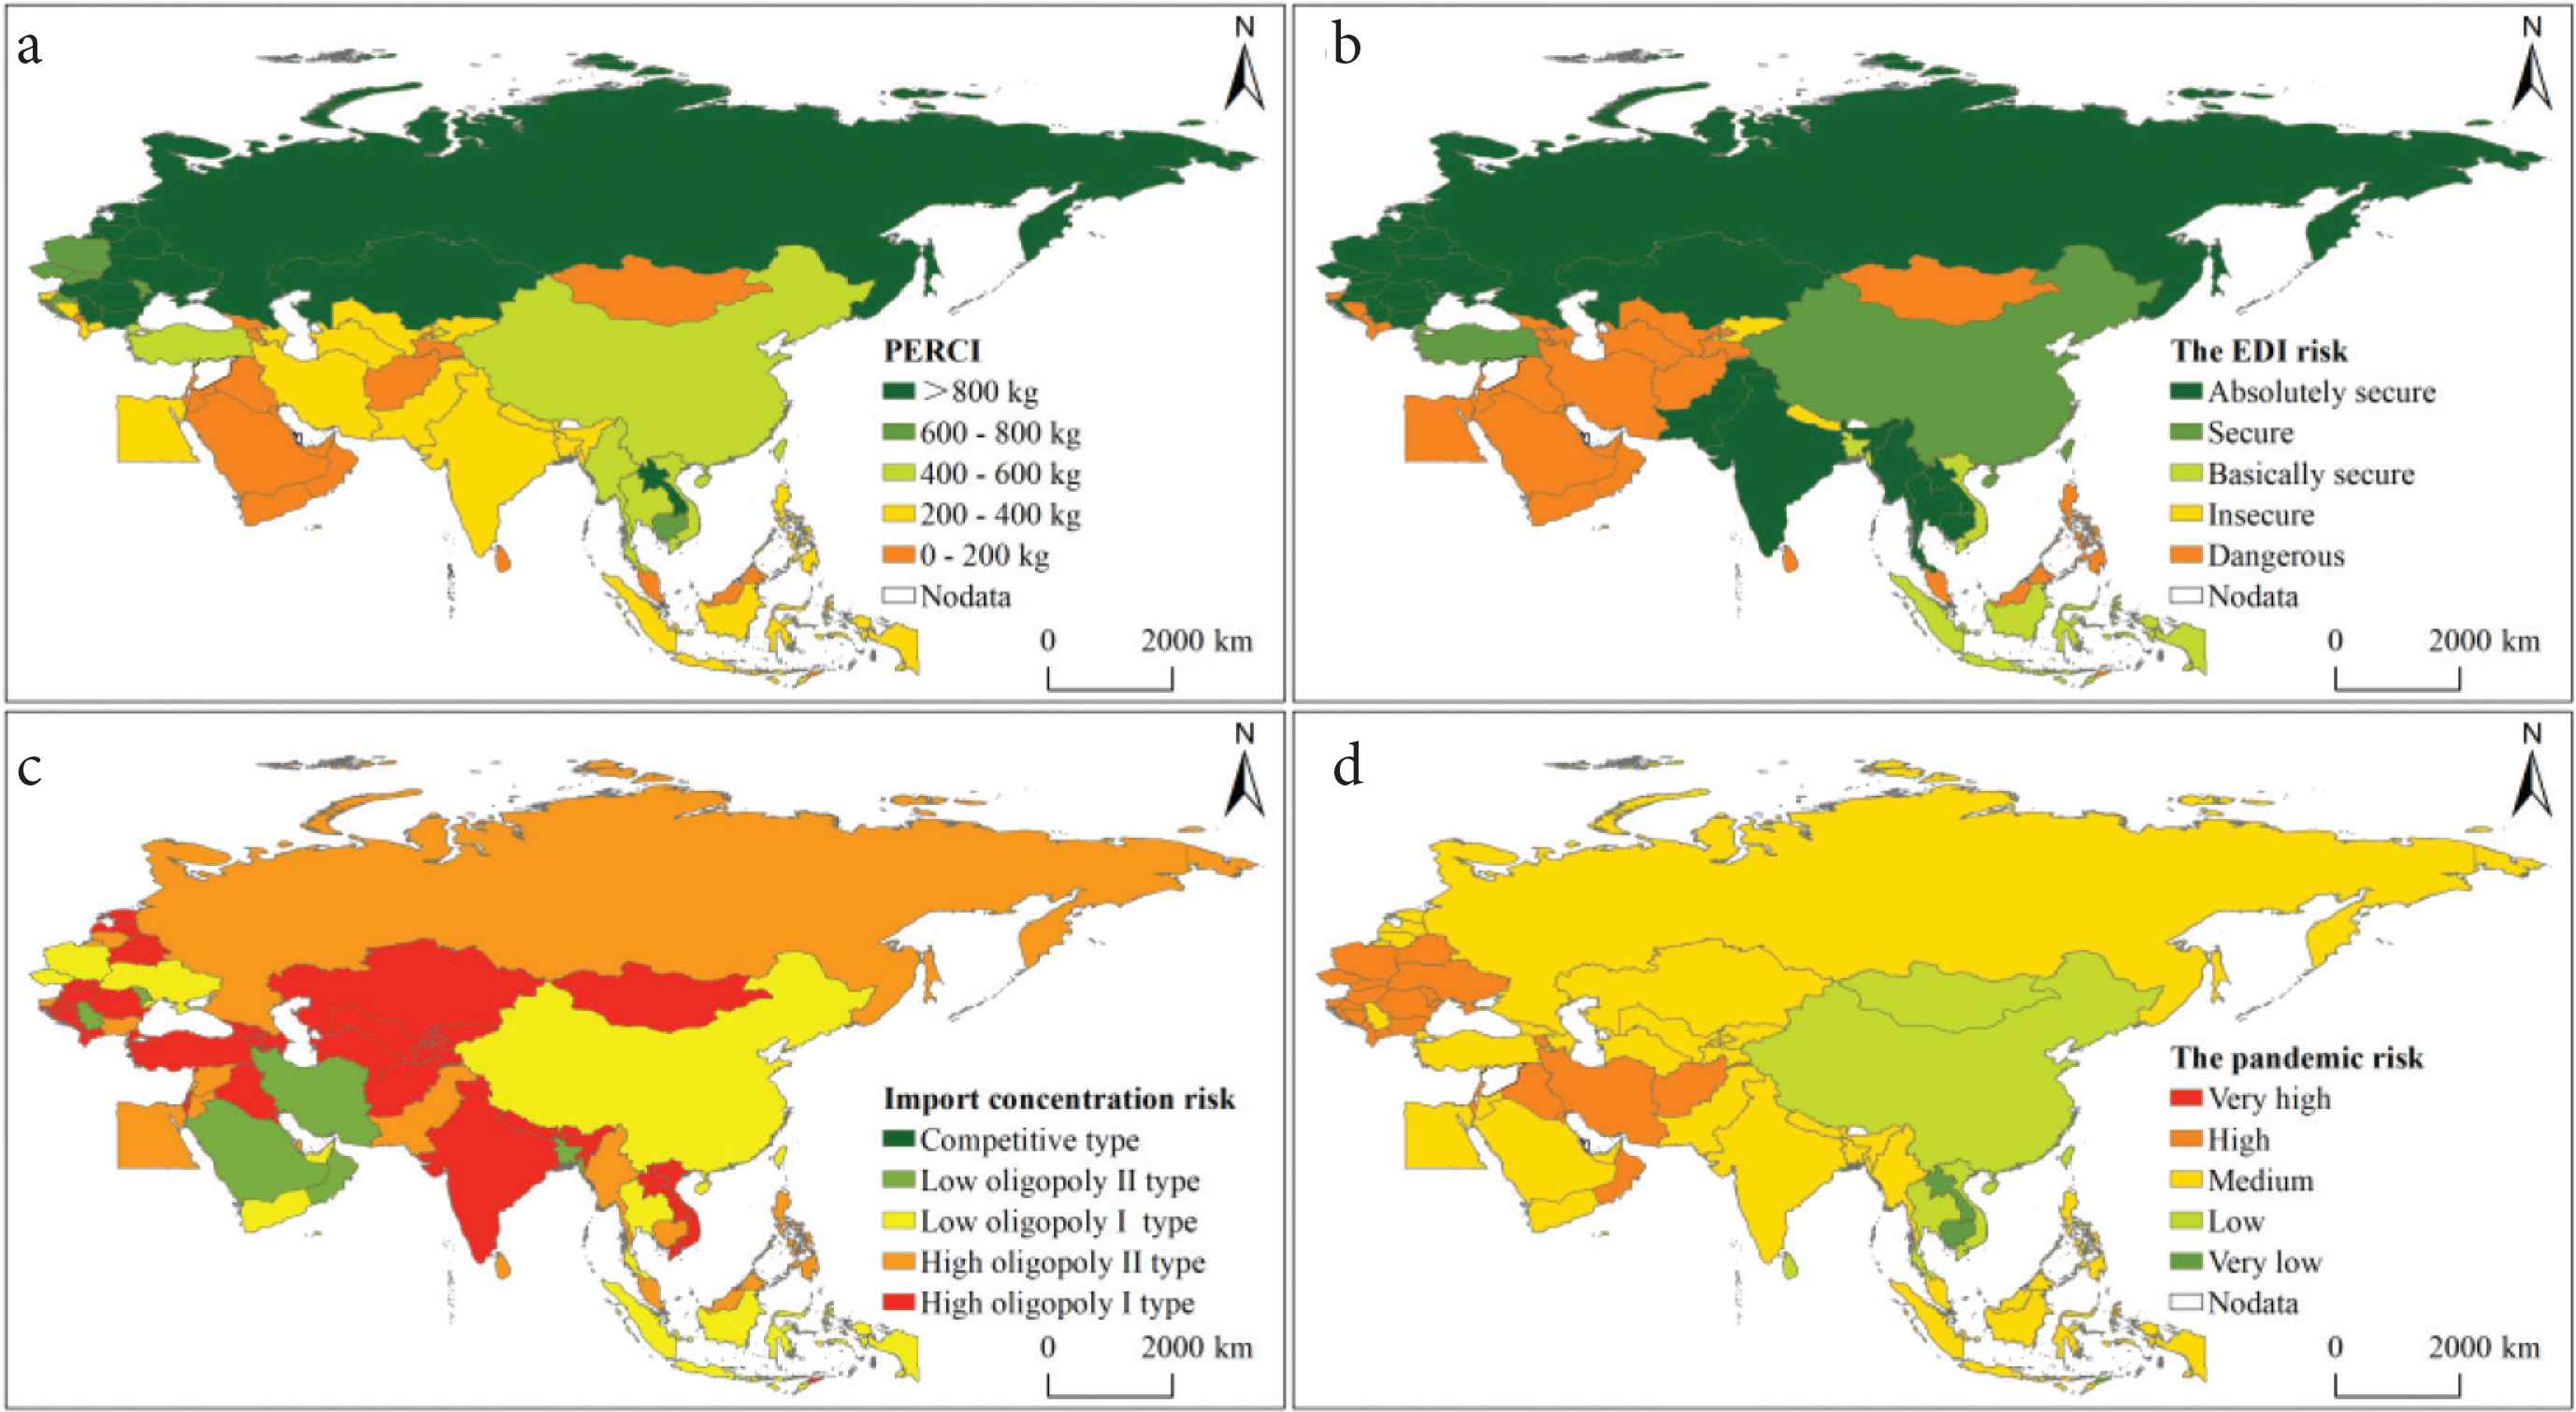
Risk patterns of food security of countries along the Belt and Road.
External dependence index obtained in 2015–2017 revealed that countries along the Belt and Road exhibited an average EDI of 4.62%. The EDIs of 24 countries were below 5%, which placed them in a secure or absolutely secure state. These countries were mainly distributed in Central and Eastern Europe and Southeast Asia. Moreover, 29 countries were still in a crisis state, and they were mainly distributed in West Asia, the Middle East, and Southeast Asia. To be specific, the EDIs of nine countries (including Maldives, United Arab Emirates, and Kuwait) exceeded 90%. Among countries with a net food import of 1 million tons, Indonesia and Iran showed the largest EDIs (35% and 53%, respectively), and their food supply was significantly affected by trade, transportation, and market price fluctuations (Figure 7b).
Herfindahl–Hirschman index data for 2015–2017 indicate that countries along the Belt and Road showed an average HHI of 3972, and the HHIs of 21 countries were above this average level. Furthermore, 35 countries were of the high oligopoly I type, and showed an HHI of above 9000. These countries included Bhutan, Tajikistan, Montenegro, Uzbekistan, Nepal, Laos, Kyrgyzstan, and Georgia. Fifteen countries were of the high oligopoly II type, and their external supply was susceptible to influence by the export policies of a single country. Taking the import ratios of main cereals into account, 8000 of the food import of Bhutan, Nepal, and Maldives in South Asia was from India. Above 8000 of the food import of five countries in Central and Eastern Europe (including Georgia, Armenia, and Azerbaijan) was from Russia. Nearly 10,000 of the food import of Tajikistan, Uzbekistan, and Kyrgyzstan in Central Asia was from Kazakhstan (Figure 7c).
Analysis of the pandemic risk, countries along the Belt and Road showed an average pandemic risk value of 53.28, slightly higher than the global average in the same period (50.23). According to the classification based on risk levels, there were 23 high-risk countries, 27 medium-risk countries, five low-risk countries, three very low-risk countries, and no very high-risk ones at all. In terms of spatial distribution, the highest CRI were observed in Central and Eastern Europe and West Asia, in particular, Montenegro, Armenia, Moldova, The Republic of North Macedonia, Albania, Bosnia, and Herzegovina. All of them showed CRI above 70, and their food supply chains were exposed to a significant potential influence by the pandemic. East Asia and Indo–China Peninsula were mainly distributed with very low-risk and low-risk countries; and other regions were dominated by medium-risk countries (Figure 7d).
4.3. Food Security Risks
The average FSRI of countries along the Belt and Road is 17.76, and the FSRI of 17 countries has exceeded this average value. To be more specific, there are nine very high-risk countries, mainly with low PERCI values, distributed in Central and Eastern Europe and Central Asia, including Montenegro, Armenia, Georgia, and Tajikistan; and 25 high-risk countries, mainly distributed in Southeast Asia, South Asia, West Asia, and North Africa. Furthermore, there are 15 medium-risk and 13 low-risk countries, which are scattered all over the world; and no very low-risk countries. Comparative analysis of situations considering and without considering the influence of the pandemic, indicates that, after the influence of the pandemic is taken into consideration, 15 countries have seen their FSRIs becoming more than doubled, and 12 countries have seen their FSRIs increasing by 50–88%.
Investigation from the perspective of risk constitution indicates that 40% of the countries are facing dual risks; 25% of them are severely affected by the pandemic; and more than 15% of them are exposed to compound risks. Among the high and very high level countries, seven countries (Armenia, Tajikistan, Azerbaijan, Maldives, Israel, Kuwait, and Iraq) are dominated by the compound risk; six countries (Turkmenistan, Mongolia, East Timor, Kyrgyzstan, Nepal, and Uzbekistan) are dominated by the domestic supply risk and the HHI risk. Moreover, ten countries (Bosnia and Herzegovina, Afghanistan, Albania, Slovenia, Egypt, Philippines, Bangladesh, Indonesia, Iran, and The Republic of North Macedonia) are dominated by the domestic supply risk and the pandemic risk. Besides, Jordan and Oman are dominated by the EDI risk. Georgia is dominated by the HHI risk and the pandemic risk. Montenegro is mostly affected by the HHI risk and the EDI risk. India and Pakistan, two populous countries, are dominated by the domestic supply risk (Figures 8 and 9).
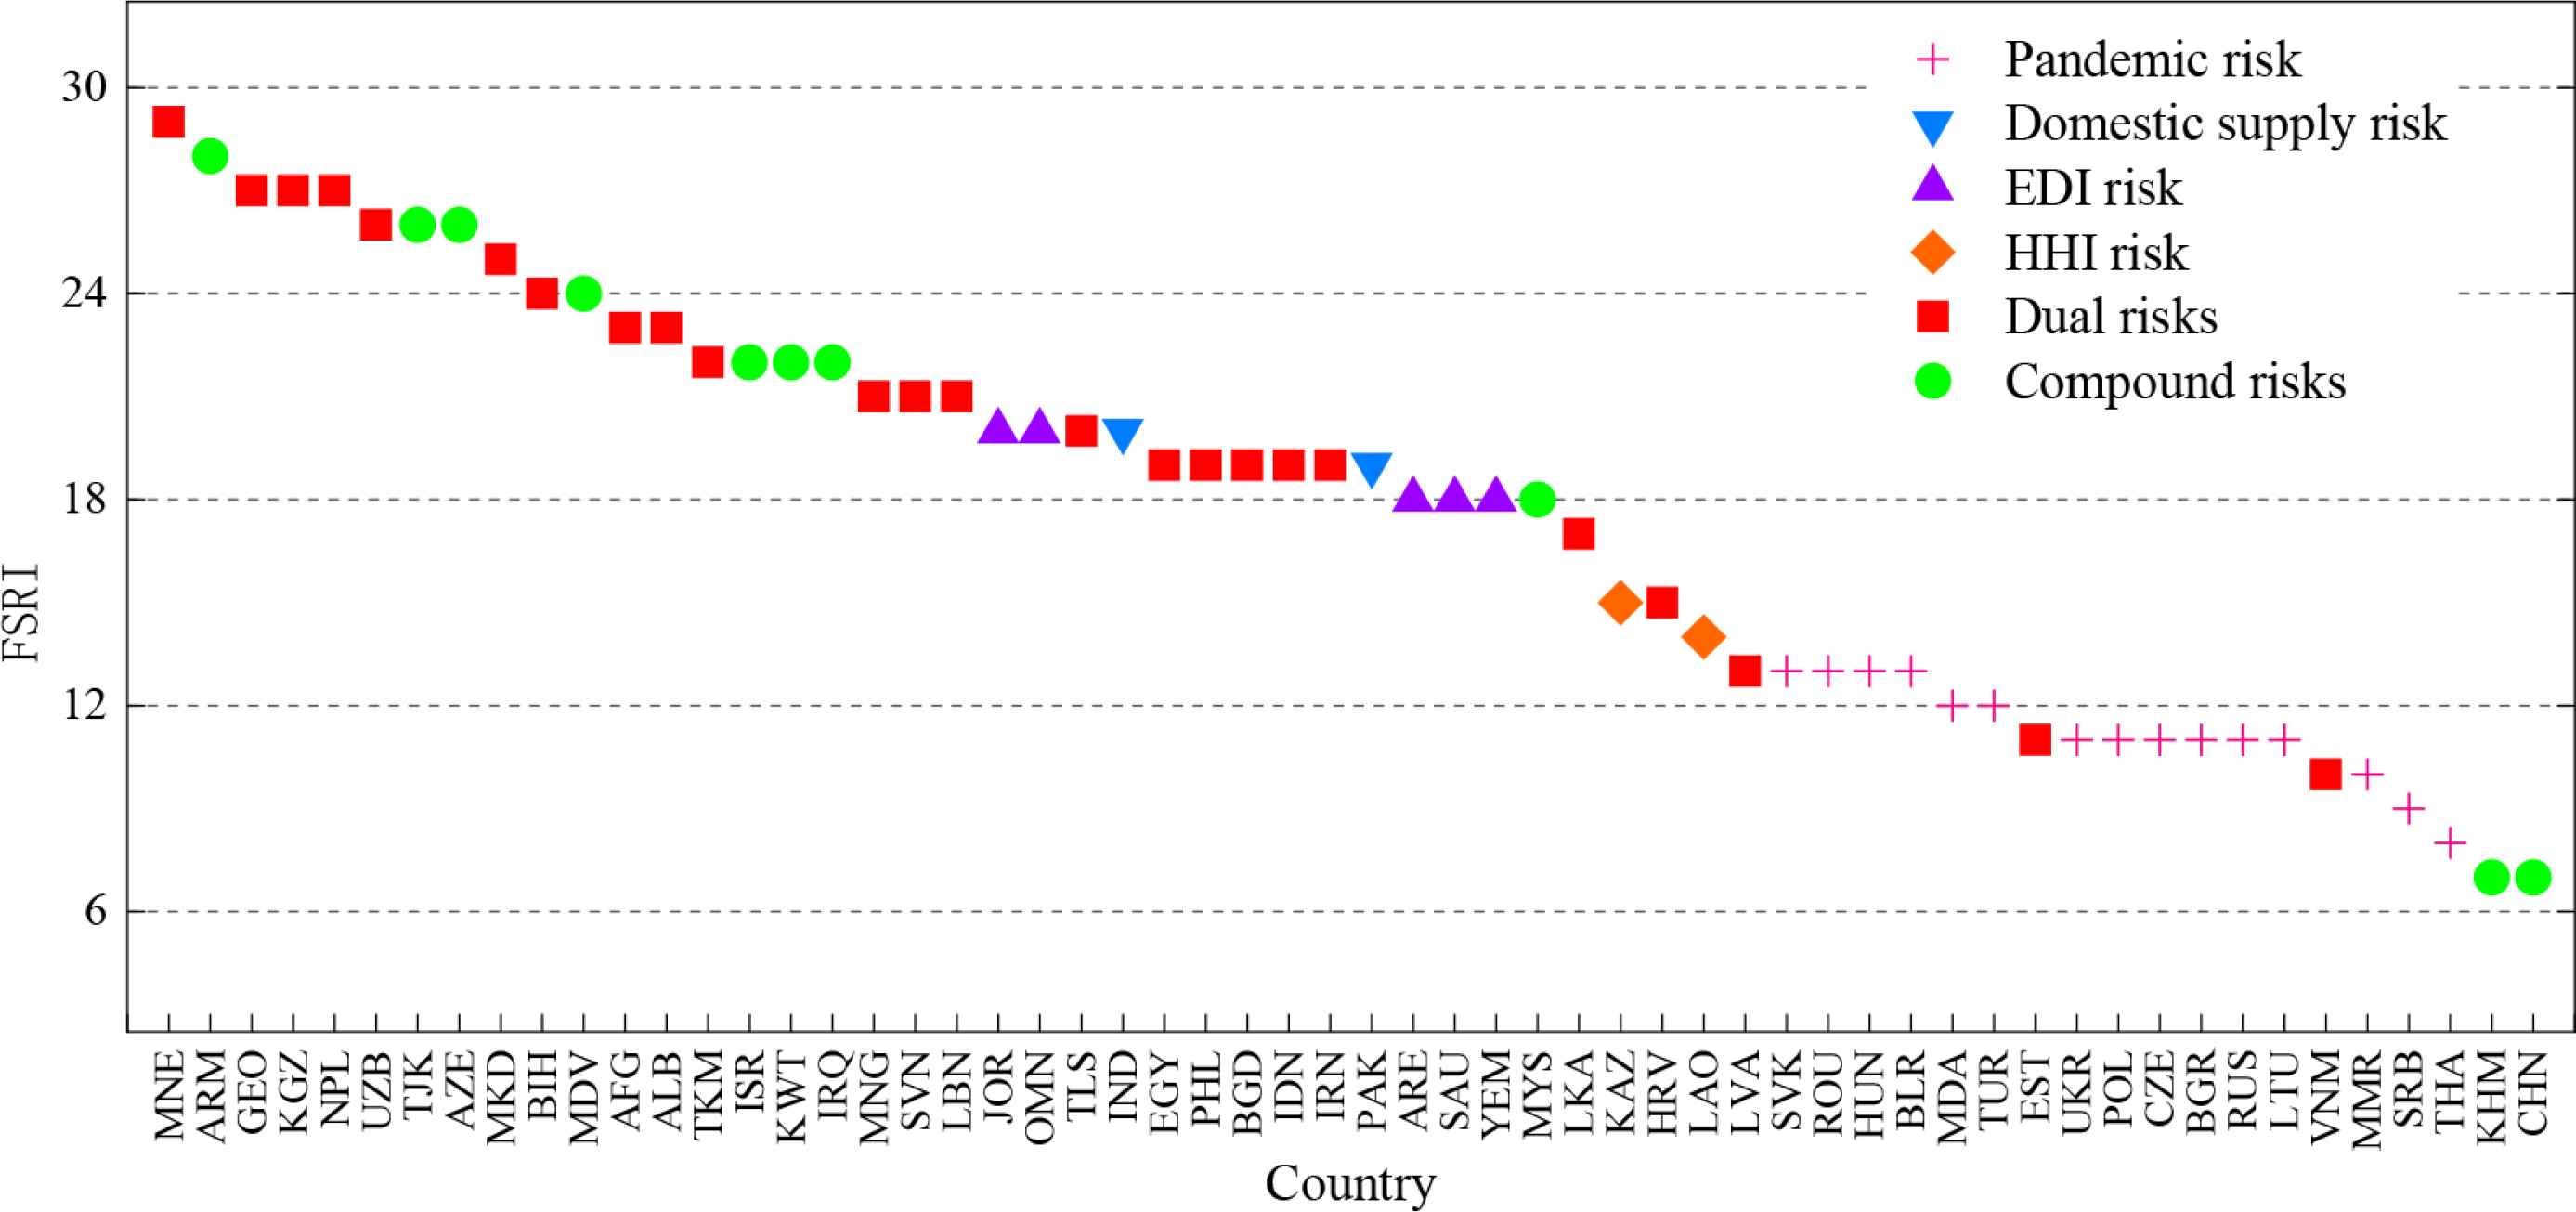
FSRI and dominant risk types of food security of countries along the Belt and Road.
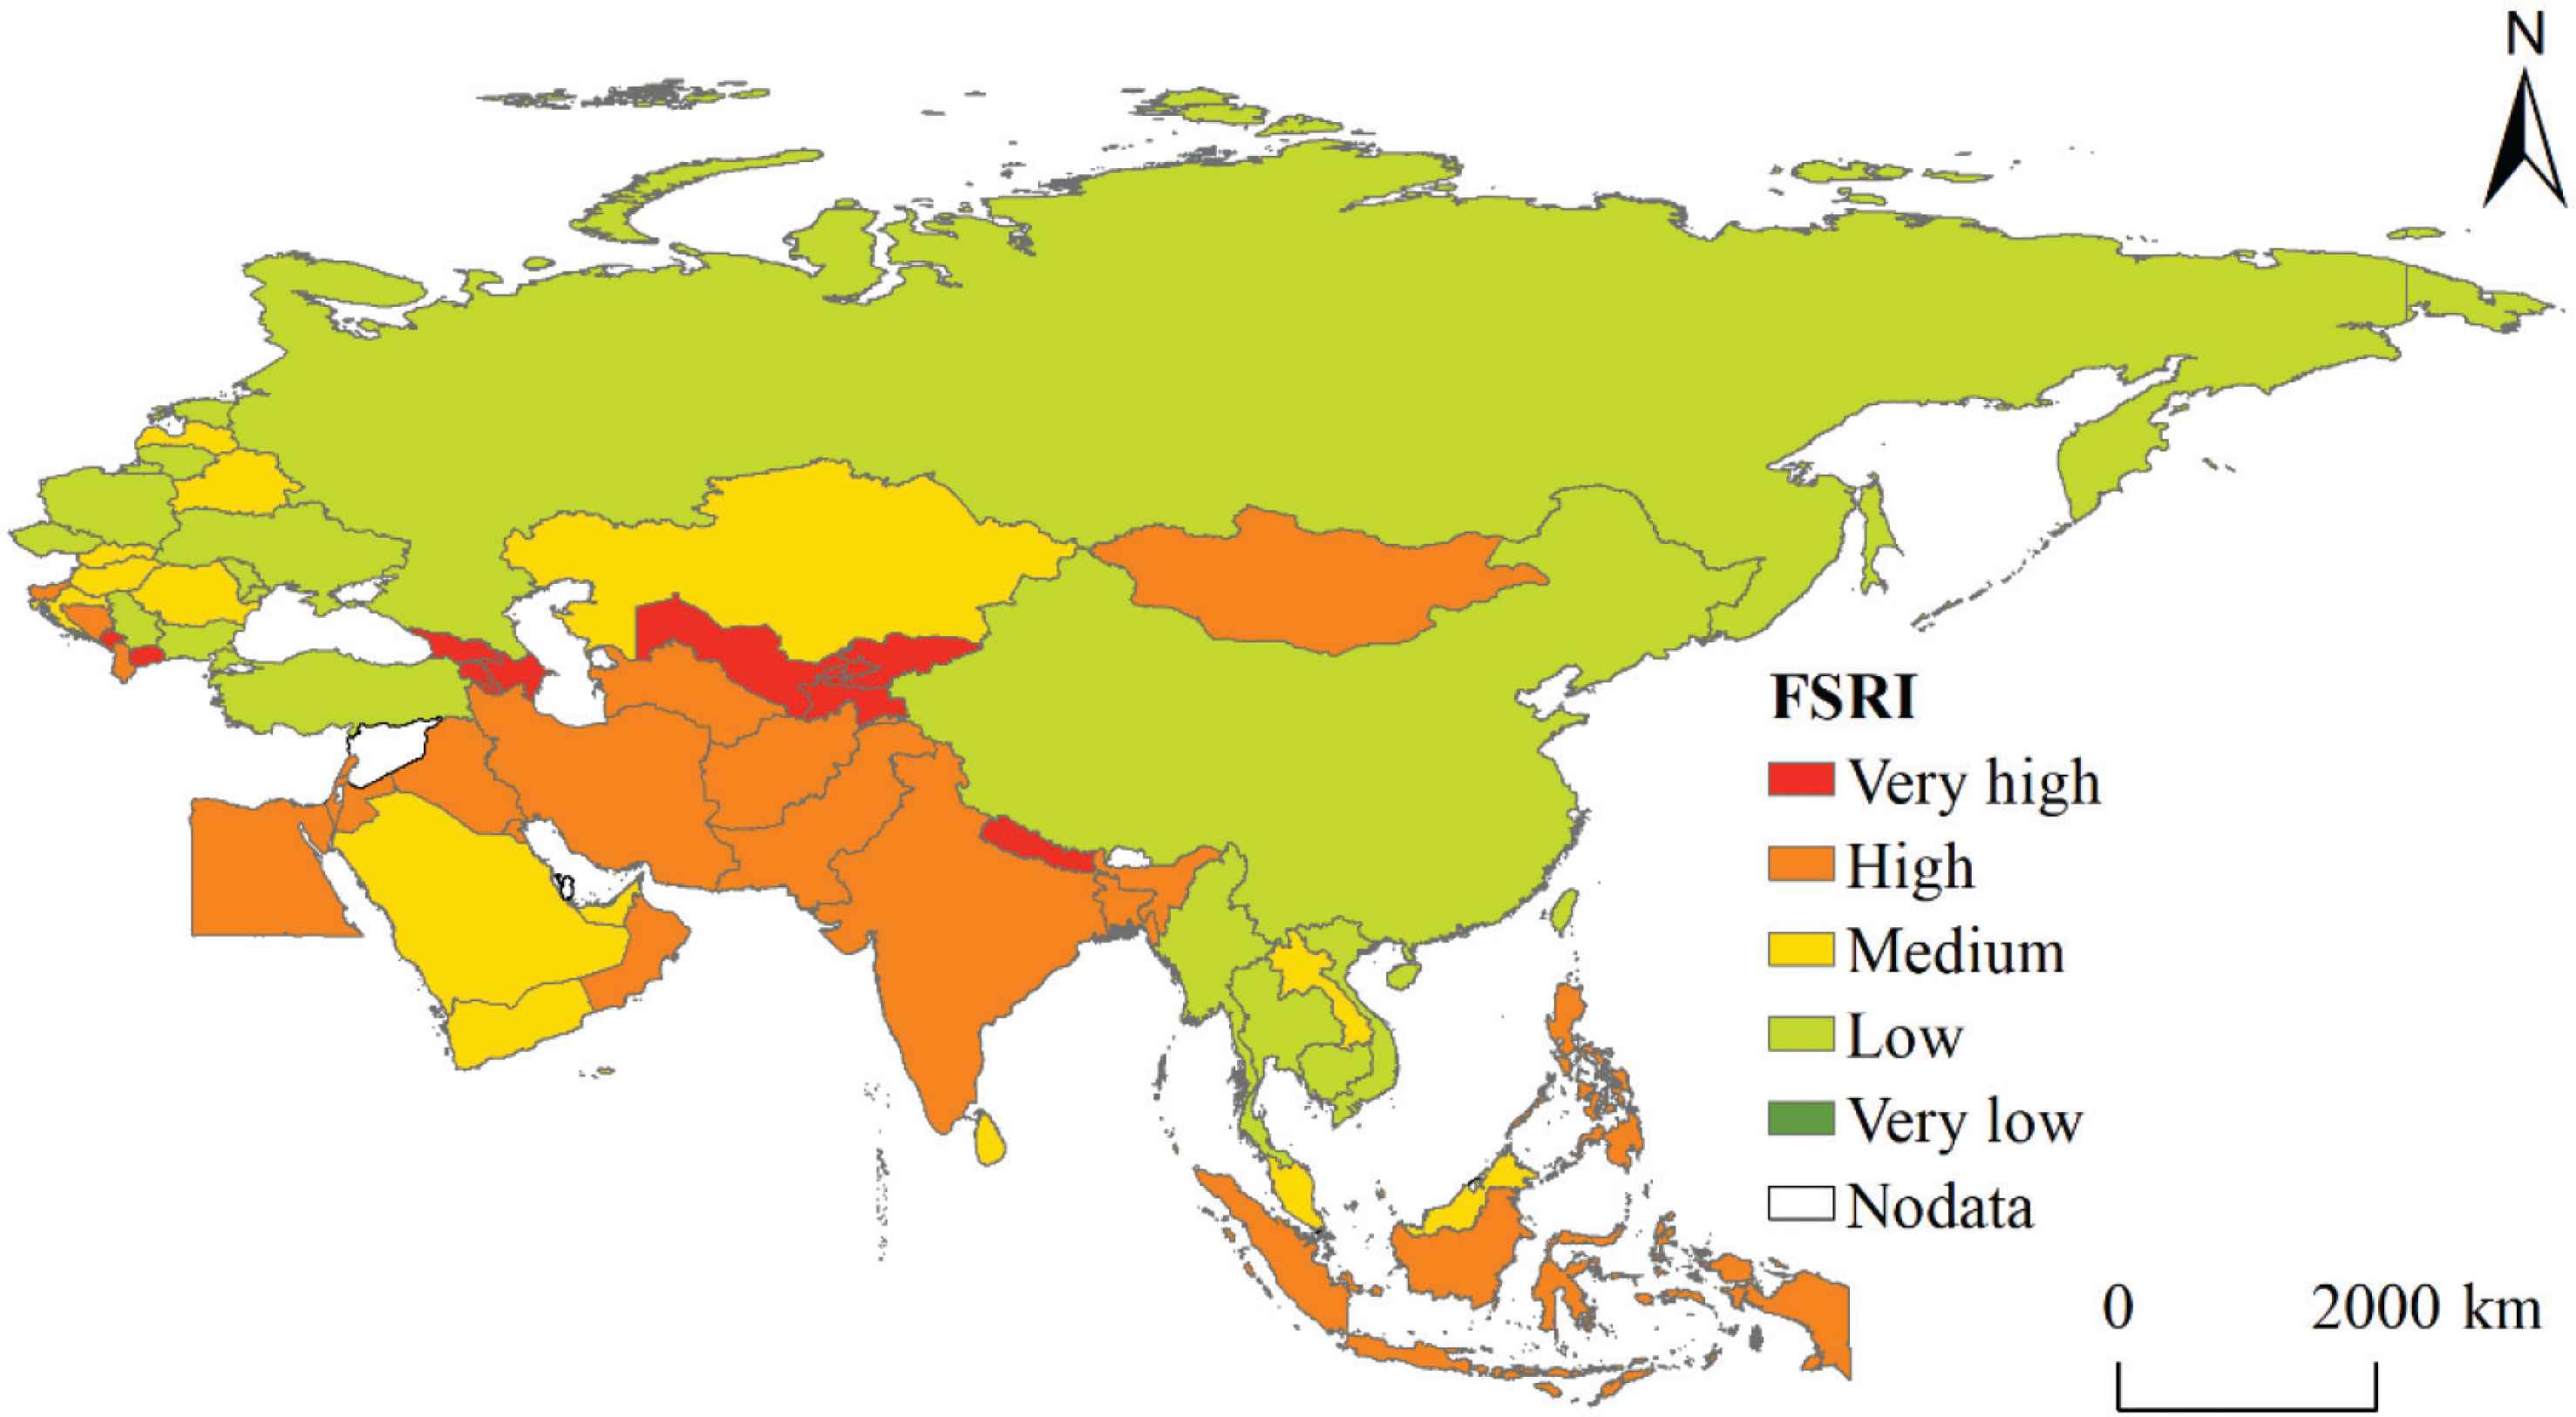
FSRI of countries along the Belt and Road.
5. CONCLUSION AND DISCUSSION
Based on the food-related data from FAO’s food balance sheets and trade matrix and the pandemic data of different countries, this study first analyzes the influence path of the pandemic on food security. Then, it identifies the features and risk nodes of the MCTN of countries along the Belt and Road via complex network analysis. Finally, it builds an integrated food security risk assessment model for the comprehensive assessment of the food security risks and determination of dominant risk types in countries along the Belt and Road. The novelty is that, comparing with resource occupancy and political risk in risk of resource security [34] to assess the risk of resource security, this study adds the COVID-19 risk in the food security risk model basing the context of a global COVID-19 pandemic, for instance, the possibility of export controls and trade interruptions.
- (1)
The COVID-19 pandemic adds to the uncertainty of food security. Since the initiation of the pandemic, the food production, trade, and economic growth of the world have declined as predicted, together with a significant drop in the stability of international food trade. Food prices have risen up to the highest point after 2014, adding to the uncertainties and complexities of the global food market. Pandemic prevention and control measures are undeniably required. However, they not only cause the interruption of food supply chains and break the relatively stable state of food supply and consumption, but also highlight the importance of domestic supply and expose the vulnerability of external dependence, further aggravating the situations of food insecurity in many countries.
- (2)
The MCTN exhibits a strong effect of dominance by major countries. Among the countries connected along the Belt and Road, those ranked top ten in terms of import and export, account for about 70% of the total trade flow. Furthermore, the trade network, formed under dominance by major food exporters such as Russia, Ukraine, and the US, presents typical scale-free features and its connectivity is significantly affected by core countries. However, with the ongoing spread of the pandemic in several core countries and the reduction in the stability of food production and trade policies, potential risks may be posed by these countries to the global food market in the future.
- (3)
The per capita cereals possession of countries along the Belt and Road amounts to only about 90% of the global average. Moreover, 19 countries along the Belt and Road have a per capita cereals possession of below 200 kg; thus, short domestic supply is the root cause of food insecurity in these countries. Nine countries show an EDI of above 90%, and eight countries have an HHI of above 90%, indicating that external supply has a significant influence on food security. Moreover, affected by the pandemic, 15 countries have seen their FSRIs becoming more than doubled, and 12 countries have seen their FSRIs increasing by 0.5–1 times.
- (4)
Roughly 25%, 40%, and 15% of the countries are dominated by the pandemic risk, dual risks, and compound risks, respectively. About half the number of countries shows a very high or high FSRIs. Among the high and very high level countries, seven countries (including Armenia, Tajikistan, and Azerbaijan) are dominated by the compound risk; ten countries (including Bosnia and Herzegovina, Afghanistan, and Albania) are dominated by the domestic supply risk and the pandemic risk; and six countries (including Turkmenistan, Mongolia, and East Timor) are dominated by the domestic supply risk and the concentration risk. Besides, Jordan and Oman are dominated by the external dependence risk. Georgia is mostly affected by the concentration risk and the pandemic risk. Montenegro is dominated by the concentration risk and the dependence risk. India and Pakistan, two populous countries, are dominated by the domestic supply risk.
The influence of the ongoing spread of the COVID-19 on food security may be persistent and long-lasting; therefore, the primary task before government agencies and international organizations all over the world is to contain the pandemic and guarantee food security. Thus, the results of this study indicate that, in the short term, stabilizing food production according to the farming seasons is essential for guaranteeing ample food supply across the globe. In the medium and long term, for countries significantly affected by the external supply risk, it is necessary to gradually improve upon the domestic food production capacity, increase the proportion of domestic food supply, and reduce the EDI of food. Furthermore, significant efforts should also be devoted to expanding food import channels and spread food import risks, realize the diversification of main cereals, enhance the resilience of the food system, and finally improve the ability to respond to trade and price fluctuations in the international market. Maintaining stable production and trade among the core countries in the trade network also offers an effective way of sustaining the connectivity of the trade network. Thus, for the sake of stabilizing the global food market, countries all over the world should answer the call of international organizations, comply with the rules of trade organizations, and avoid introducing restrictive trade policies that are likely to cause panic in the market. In fact, geographical distance significantly influences the trade network; and stable and smooth international main cereals is particularly important for maintaining regional food security under the pandemic crisis. In this regard, countries along the Belt and Road, which are geographically close to each other, enjoy prominent location advantages, thus their main cereals relationships can be promoted by factors such as “geographical proximity effect” and “free trade agreement” [35,36]. Guided by the concept of “a community of common destiny for all mankind”, countries along the Belt and Road should strengthen their internal cooperation and maintain the smooth flow of international trade along the Belt and Road under the cooperation mechanisms and frameworks of the FAO, the WFP, the BRI, and so forth, so as to jointly deal with this potential food crisis.
In this study, in combination with the confirmed cases of COVID-19, food production, trade data, from the perspective of internal and external supply factors, we analyzed the food security risks at a national scale along the “Belt and Road” in the context of the pandemic. More importantly, the COVID-19 pandemic has heavily impacted food prices, purchasing capacity, food supply chain [11] and the pattern of food flow and consumption [9]. In the future, using the food security risk assessment model and further integrated with the above-mentioned factors (e.g., purchasing capacity), the resilience of food systems and decision-making support will be investigated accordingly. Future studies can incorporate the above-mentioned micro-influencing factors into the food security risk assessment model, carry out the study on the resilience of the food systems, and provide policy support for improving the resilience of the food systems to respond to shocks. In the post-pandemic era, more efforts are urgent to put in to improve the food system and food security.
CONFLICTS OF INTEREST
The authors declare they have no conflicts of interest.
AUTHORS’ CONTRIBUTION
CZ contributed in clear conceptualization, method implementation, such as network analysis and food security risk assessment model, paper writing. YY contributed in ideas giving, supervision, editing. ZF contributed in ideas giving. TL contributed in trade data processing and curation. XW contributed in COVID-19 data processing and curation. YL contributed in visualization.
ACKNOWLEDGMENTS
This research was funded by the Strategic Priority Research Program of the Chinese Academy of Sciences (XDA20010201). The authors appreciate the time and effort of the editors and reviewers in providing constructive comments which have helped to improve the manuscript.
REFERENCES
Cite this article
TY  - JOUR
AU  - Chao Zhang
AU  - Yanzhao Yang
AU  - Zhiming Feng
AU  - Tingting Lang
AU  - Xiufen Wang
AU  - Ying Liu
PY  - 2021
DA  - 2021/05/17
TI  - Food Security Risks of Countries along the Belt and Road in the Context of the COVID-19 Pandemic
JO  - Journal of Risk Analysis and Crisis Response
SP  - 45
EP  - 56
VL  - 11
IS  - 2
SN  - 2210-8505
UR  - https://doi.org/10.2991/jracr.k.210503.001
DO  - 10.2991/jracr.k.210503.001
ID  - Zhang2021
ER  -