
Hemodynamic investigation of intraluminal thrombus effect on the wall stress in a stented three-layered aortic aneurysm model under pulsatile flow
- DOI
- 10.1016/j.artres.2015.01.002How to use a DOI?
- Keywords
- Aneurysm; Stent; Intraluminal thrombus; Fluid-structure interaction; Numerical analysis
- Abstract
Purpose: Aortic aneurysms occurs when the wall stress exceeds the strength of the vascular tissue. Intraluminal Thrombus (ILT) may absorb tension and reduce the aortic aneurysm wall stress. The purpose of this study is to test the hypothesis that the presence and growth of ILT alters the wall stress in a stented aneurysm.
Method: A virtual stented aneurysm model with ILT is created to study the flow and wall dynamics by means of Fluid-Structure Interaction (FSI) analysis. Wall stresses are determined by two-dimensional axisymmetric finite element analysis. Calculations are performed as thrombus elastic modulus increased from 0.1 to 2 MPa and calculations are repeated as thrombus depth is increased in 10% increment until thrombus fills the entire aneurysm cavity.
Results: The blood flow velocity, pressure, and maximum wall stresses are compared to the aforementioned models. The maximum stress reduction of 46% occurs at the time of peak flow and 28% at the time of peak pressure when thrombus elastic modulus increases from 0.1 to 2 MPa. In addition, as the thrombus depth increased from 10% to 100 %, the wall stress at the time of peak flow and peak pressure decreased almost 25% and 20%.
Conclusions: The findings of this study may have implications not only for understanding the wall stress in ILT but also for providing more detailed information about aortic aneurysm with intraluminal thrombus.
- Copyright
- © 2015 Association for Research into Arterial Structure and Physiology. Published by Elsevier B.V. All rights reserved.
- Open Access
- This is an open access article distributed under the CC BY-NC license.
Introduction
Aneurysm is an irreversible bulge in weak parts of an artery which its occurrences in the abdominal aortic is more common than other parts of the vascular system. Abdominal Aortic Aneurysm (AAA) is a focal, balloon-like dilation of the terminal aortic segment that occurs gradually over a span of years.1,2 This condition is growing in commonness in the aged people, with approximately 150,000 new cases being diagnosed every year.3,4
These aneurysms tend to enlarge over years but rupture abruptly when wall stress exceeds wall strength. These injuries are common in the aging population and, consequently, are increasingly responsible for morbidity and mortality.5–9 Although the pathogenesis is still not well understood, there is an abundance of biological, clinical, histopathological, and mechanical data on AAAs, and there has been considerable improvement in the biomechanical modeling of these lesions.10
Excessive expansion of aneurysm eventually leads to its rupture, which is the thirteenth cause of mortality in the United States alone.11 The traditional treatments for this problem include open surgery, cutting the damaged artery and its replacement with polyester graft. However, minimally invasive technique such as endovascular stent graft has been substituted nowadays.12 Di Martino et al.13 investigated a real three-dimensional abdominal aortic aneurysm and their results provided a quantitative local evaluation of the stresses due to local structural and fluid dynamic conditions. The structural and fluid dynamic conditions for aortic aneurysm were investigated by Liber et al.14 They also considered thrombus and the interaction between thrombus and fluid and also investigated the influence of the stent filament size on the intra aneurysmal flow dynamics in a sidewall aneurysm model in vitro. Their result showed that the stenting procedure would significantly reduce the intra-aneurysmal vorticity and the mean circulation inside the aneurysm diminished reduced to less than 3% of its value before stenting.15
Wang et al. reconstructed realistic three-dimensional (3D) aortic aneurysm geometries, including both wall and ILT for four patients with ILT surface ratios that ranged from 0.29 to 0.72 and ILT volume ratios that ranged from 0.12 to 0.66. Their result showed that the peak wall stress reduces for all models with ILT include as compared with models with no ILT. Mower et al.16 investigated a 2D axisymmetric finite element analysis to test the hypothesis that intraluminal thrombus can significantly reduce Abdominal Aortic Aneurysm (AAA) wall stress and their results indicated that the maximum stress reduction of 51% occurred when the thrombus with elastic modulus of 1.0 MPa filled the entire AAA cavity in comparison with a non-thrombus model. Furthermore, stresses were reduced by only 25% as modulus decreased to 0.2 MPa. Sun et al.17 investigated the hemodynamic effect of stent struts on renal arteries in patients with abdominal aortic aneurysms. The stent wire thickness was simulated with a diameter of 0.4, 1.0, and 2.0 millimeters. In their results, the flow velocity was reduced by 20–30% in most of the situations when the stent struts thickness increased to 1.0 and 2.0 millimeters, respectively. A complex mechanical interaction between pulsatile blood flow and wall dynamics in the three-layered aortic arch model has been investigated by constructing three-dimensional model.18 The variations of mechanical stress along the outer wall of the arch during the cardiac cycle have been also considered and variations of circumferential stress were found very similar to those of pressure.18 The influence of arch aneurysm and wall stiffness on wall stress was considered in18 and the results showed that the stresses are much higher at inflection points in the aneurysm model than in non-aneurysm model, and the stresses at media in stiffened wall are higher than in unstiffened wall.
In the present study, the effect of Young’s modulus of thrombosis (Eth) and growth of thrombus depth on hemodynamic parameters and wall stress in a stented two-dimensional model of aneurysm is considered using Fluid-Structure Interaction (FSI) method. Other essential information and conditions to simulate this issue such as anatomy and geometry of model, mechanical properties of wall and flow are obtained using previous studies. The achievements of this study can help the researchers by providing more detailed information about aortic aneurysm with intraluminal thrombus.
Methods
Geometry and material
The simplified geometry based on the geometry in,18 which was applied to simulate abdominal aortic aneurysm is shown in Fig. 1. A two-dimensional axisymmetric model of stented three-layered aneurysm with ILT was constructed. The radii of inlet and outlet are the same and set to 12 mm and the maximum aneurysm radius was set to 30 mm. The thickness of the entire wall was chosen to be 2 mm and the thicknesses of the intima, media, and adventitia in aneurysm models were ti = 0.2 mm, tm = 1.2 mm, and ta = 0.6 mm, respectively.19 The vessel walls were modeled as a two-dimensional axisymmetric structure.
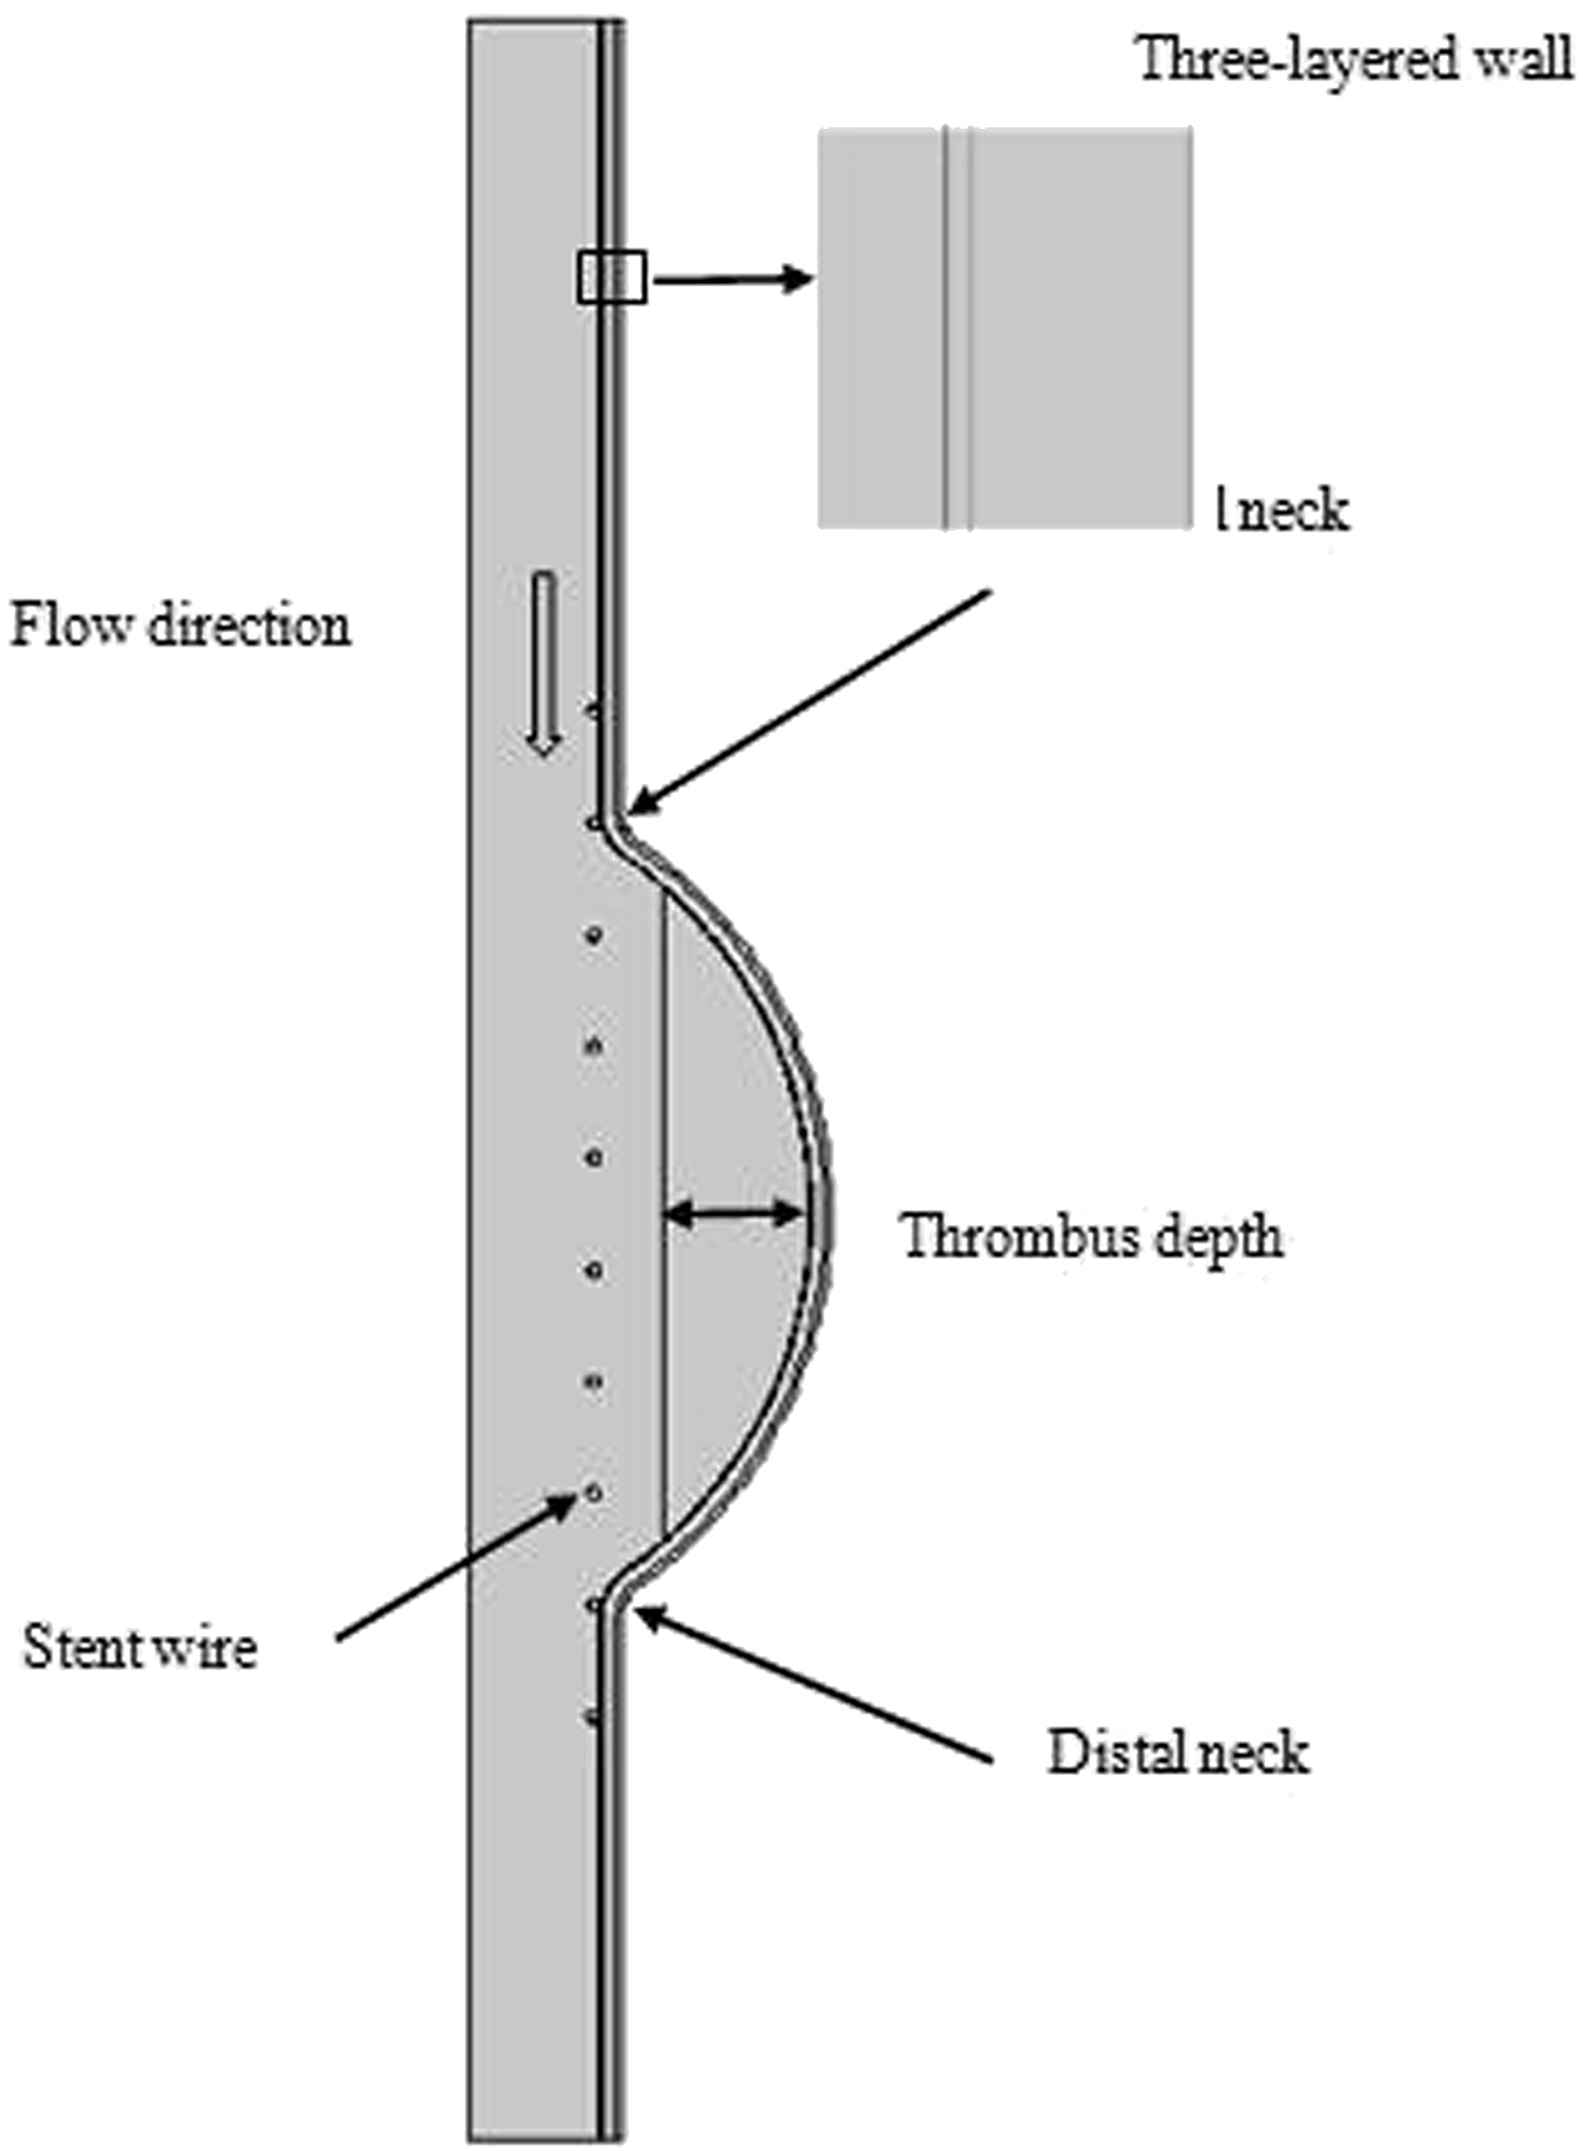
Two-dimensional axisymmetric aneurysm model with thrombus and three layered wall.
The stent wire diameter is 1 mm and has a total length of 90 mm and 10 braids. The center of stent was chosen to lie on the center of the aneurysm and the stent is assumed to be rigid and fixed.20
Blood was assumed to be Newtonian with a density of ρf = 1050 kg/m3 and a dynamic viscosity of μ = 0.0035 Pa.s and treats as laminar flow.2,21–23 The aneurysm wall was assumed to be an isotropic, linear, and elastic solid with a density of ρs = 2000 kg/m3, a Poisson’s ratio η = 0.45, and mean Young’s modulus E = 4.0 MPa. Young’s modulus values of the intima, media, and adventitia are 1.6, 4.8, and 3.2 MPa, respectively.24–27
Equation
The flow was assumed to be laminar Newtonian, viscous and incompressible.28–30 The Navier–Stokes equations in Arbitrary Lagrangian-Eulerian (ALE) formulation are given in Equation (1).23,26,31
Boundary conditions
A time-dependent flow was applied at the inlet and a pressure boundary was assigned at the outlet of aorta in Figs. 2 and 3.35 For the composite structure, the boundary conditions include fixed displacements at the inlet and the outlet, and free displacement of the wall. It should be noted that the composite layers are adhered and have no relative motion to each other. The stent is assumed to be rigid. This study is divided in two sections. In our first analysis the entire cavity is filled with thrombus in order to investigate the effect of change in modulus of elasticity on wall stress. Our second analysis includes nine subsequent sections with increasing intraluminal thrombus area by 10 percent until thrombus filled the entire cavity.

Flow waveform at the inlet of aorta.
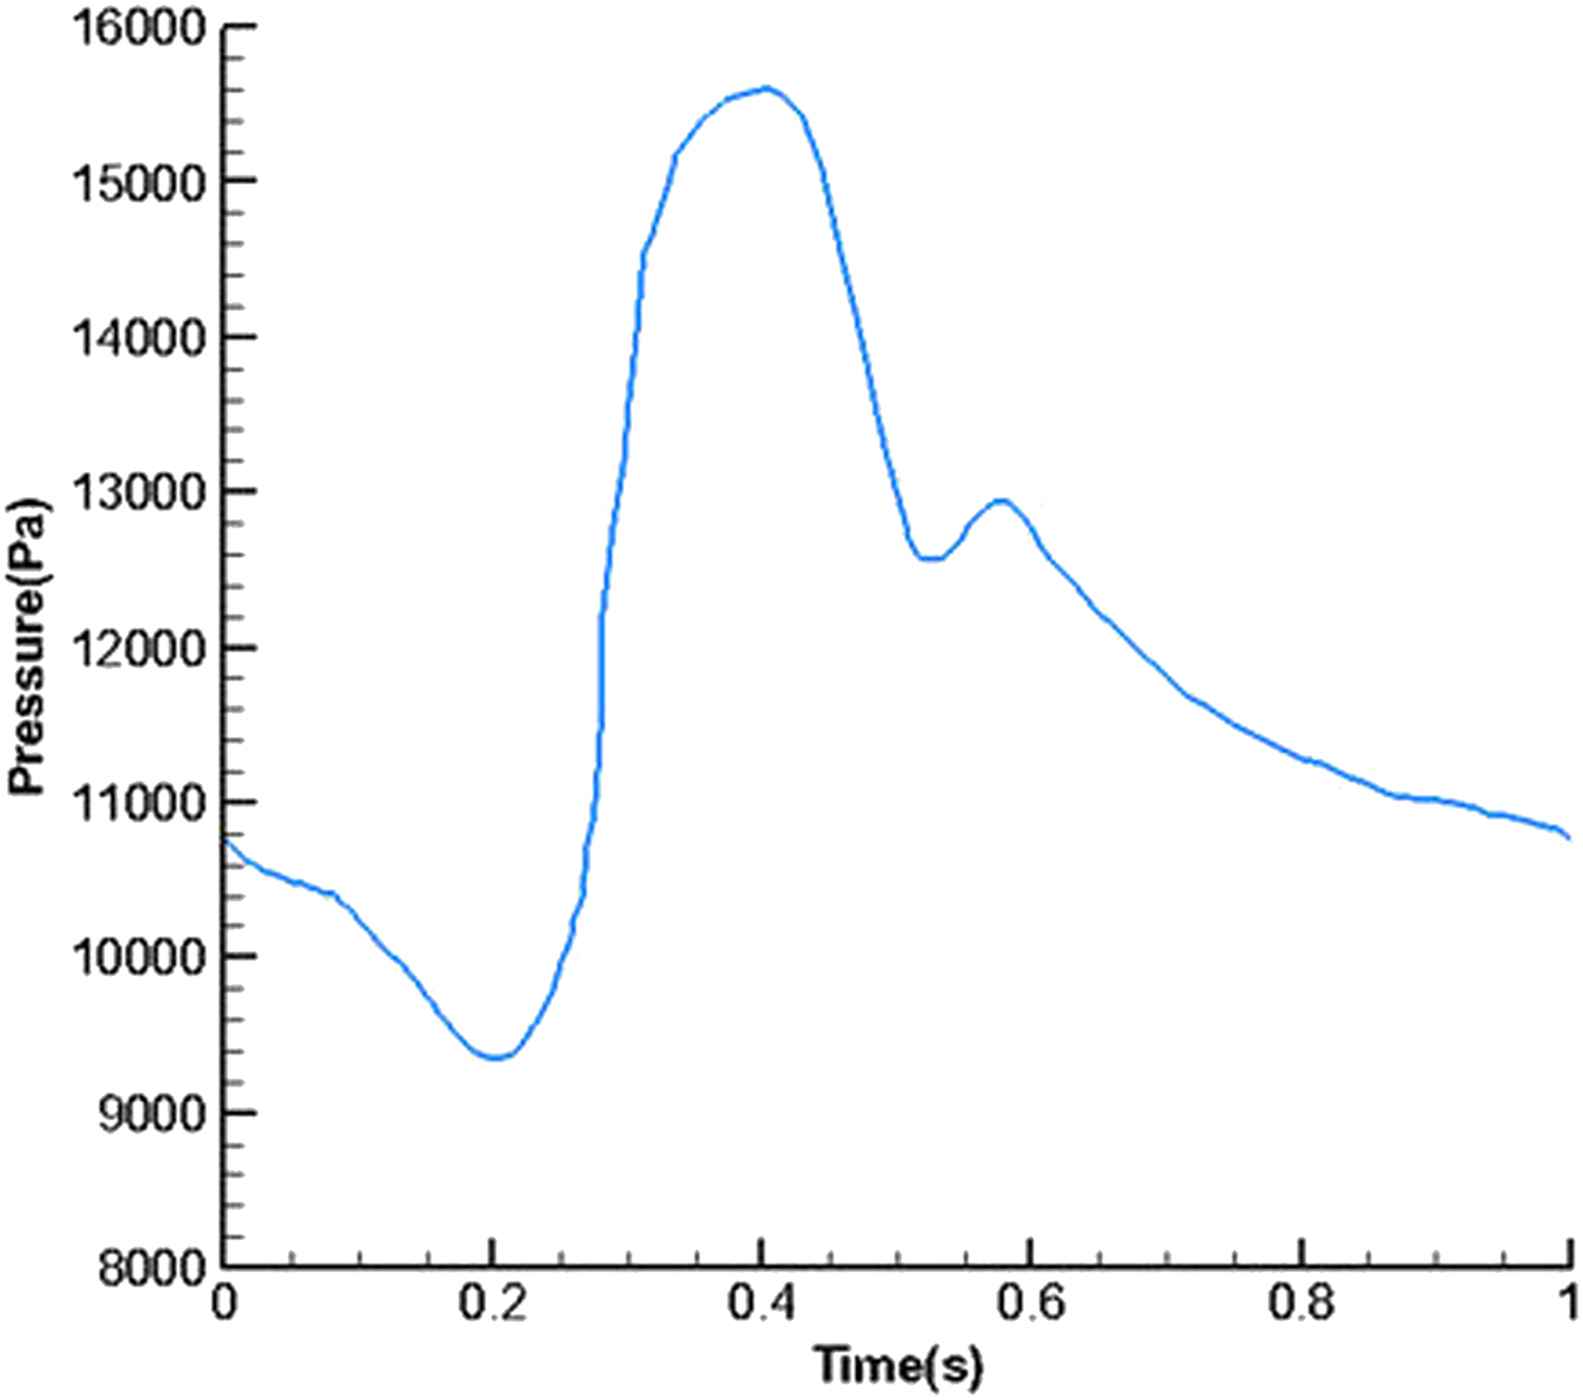
Pressure wave form at the outlet.
Simulation was performed using fully coupled fluid-structure interaction solving capability of commercial software COMSOL (United States VER 4.3b). For the solid and fluid model, four pulsatile cycle were computed, number of iteration per cycle and iteration tolerance is set to 1000 (each step equals to 0.001) and 0.001, respectively. To reach more accurate results, one common method is mesh refining until a convergent solution is obtained. With small elements the resultant computations converge to a stable value. In this case, we say that the problem has reached to the mesh independency. By shrinking the lattice with smaller elements, the accuracy of answers is not significantly changed, but we have more calculations. Therefore, the problem was solved for six times by mesh refining and our result converged and had no considerable change after step 4.
Results
Figure 4 shows the flow volume rate for the inlet and outlet in the stented aneurysm model. It is expressed by:
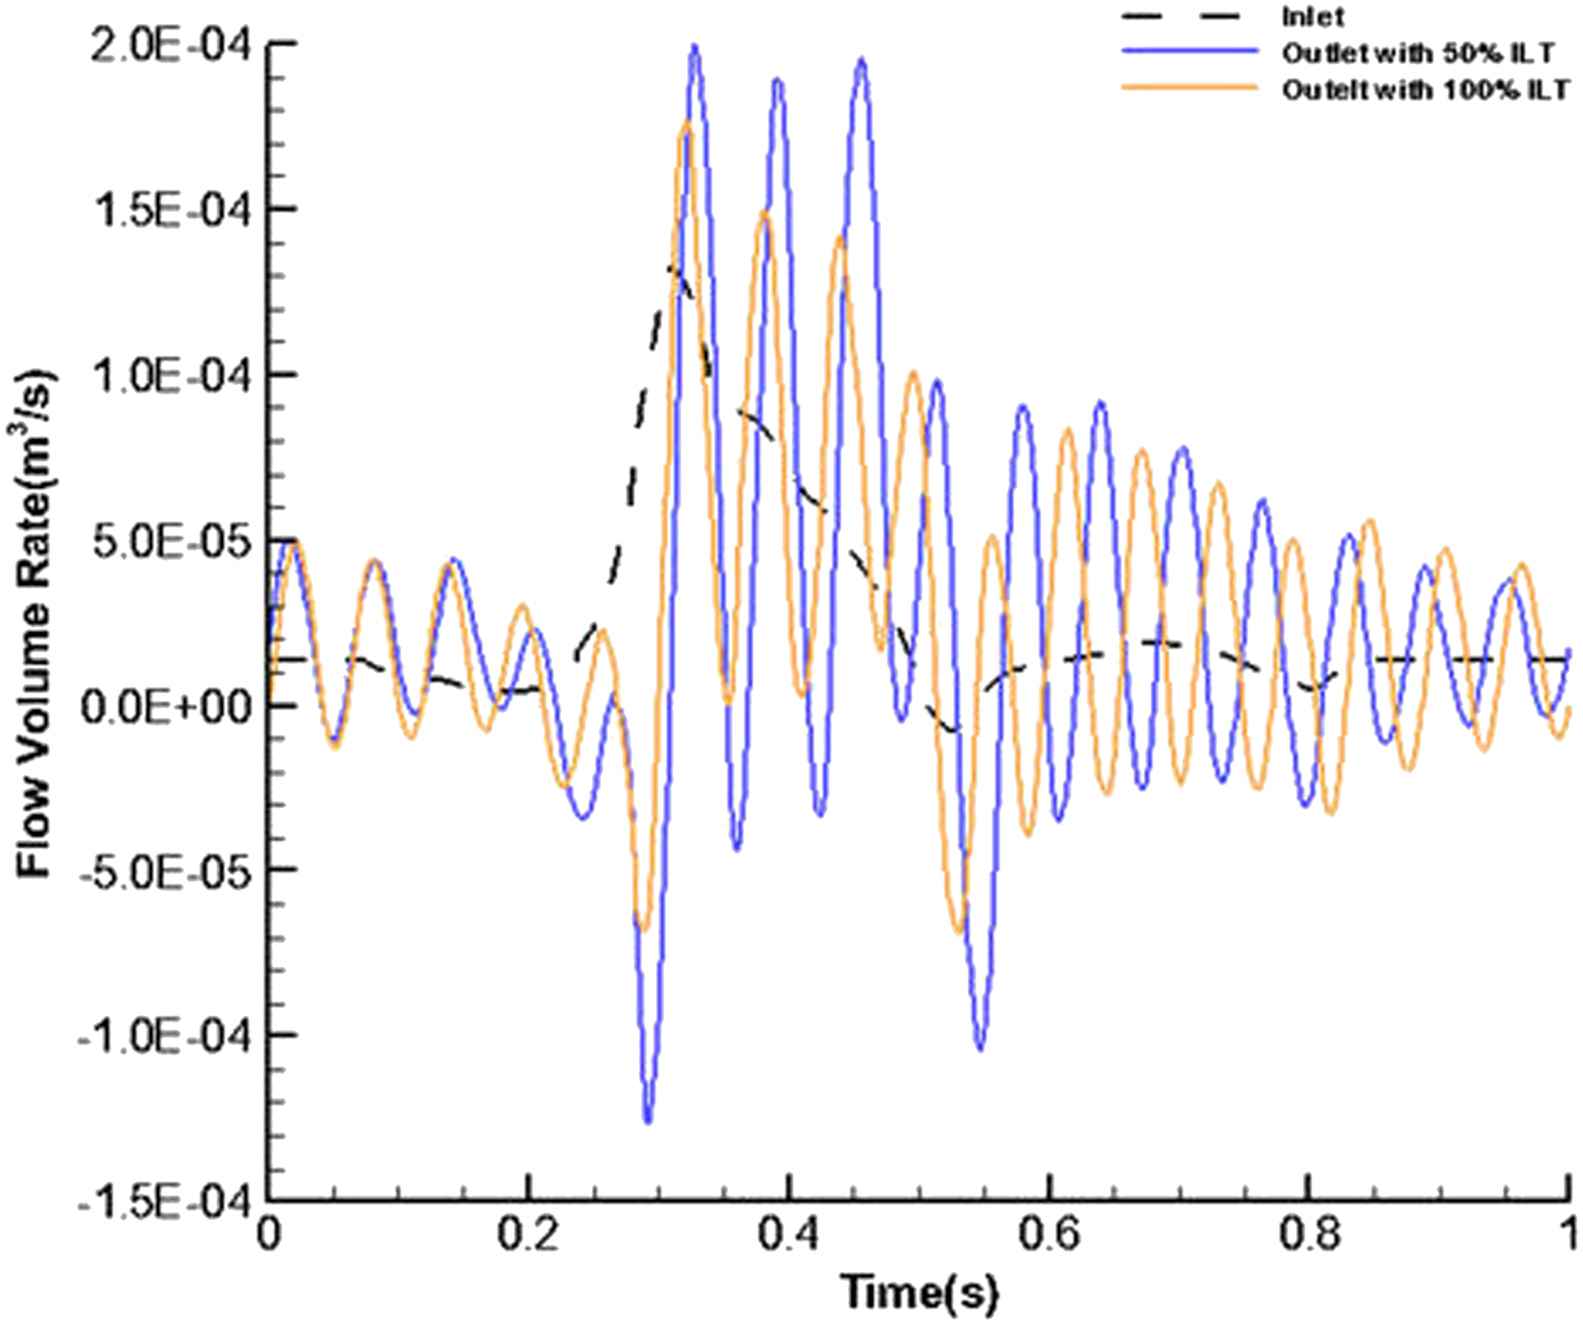
Temporal flow volume rate at the inlet and outlet for stented aneurysm with 50% and 100% of thrombus depth.
The contours of pressure change in fluid domain for six different values of intraluminal thrombus elasticity modulus in case of filled cavity at the time of peak pressure have been depicted in Fig. 5. Modulus of elasticity of thrombus was increased with the values of 0.1, 0.15, 0.2, 0.5,1, 2 MPa for parts a, b, c, d, e, f, respectively.
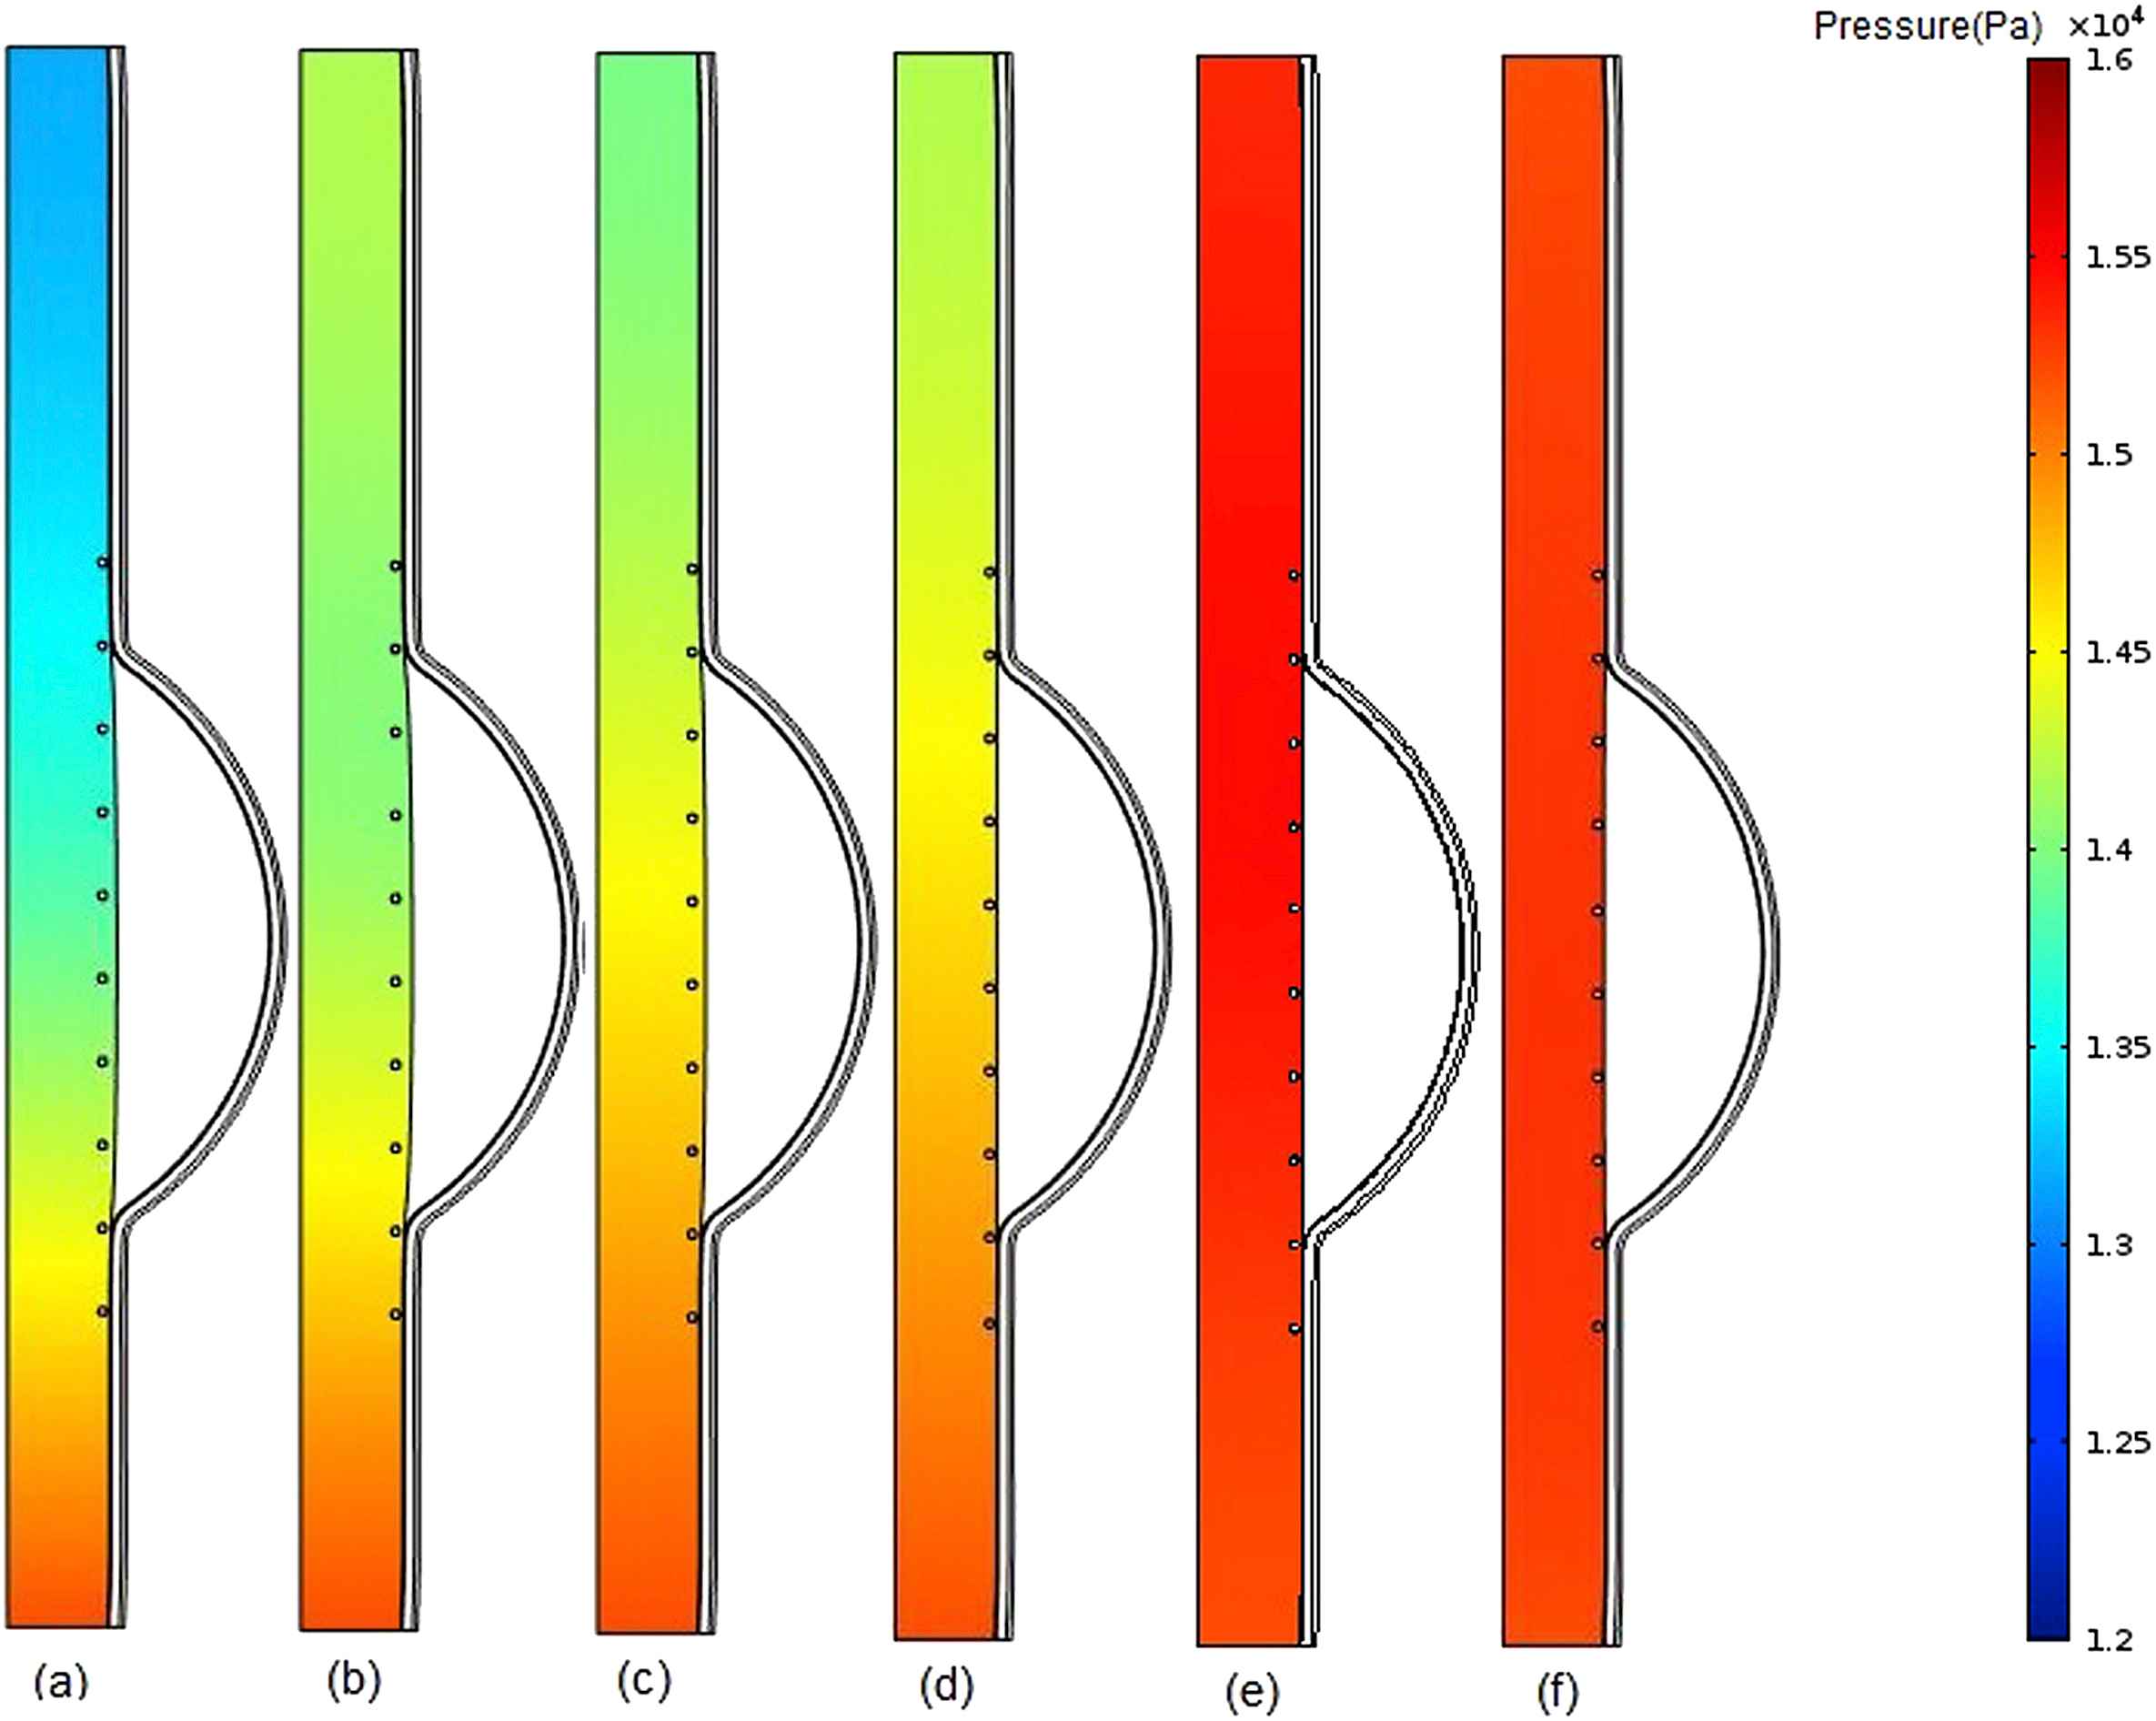
Comparison of pressure in stented aneurysm model in the case of filled cavity with ILT and changing thrombus modulus of elasticity (Eth) at the time of peak pressure for a) Eth = 0.1 MPa, b) Eth = 0.15 MPa, c) Eth = 0.2 MPa, d) Eth = 0.5 MPa, e) Eth = 1 MPa, f) Eth = 2 MPa.
The blood flow velocity contours for the stented aneurysm model with different aforementioned intraluminal thrombus elastic modulus at the time of peak flow, have been illustrated in Fig. 6. As shown in part (a), because of lower elastic modulus and higher displacement for the thrombus compared to those of intima, the blood flow velocity is decreased as we move from the inlet to the outlet due to increase in cross-sectional area at the thrombus region.
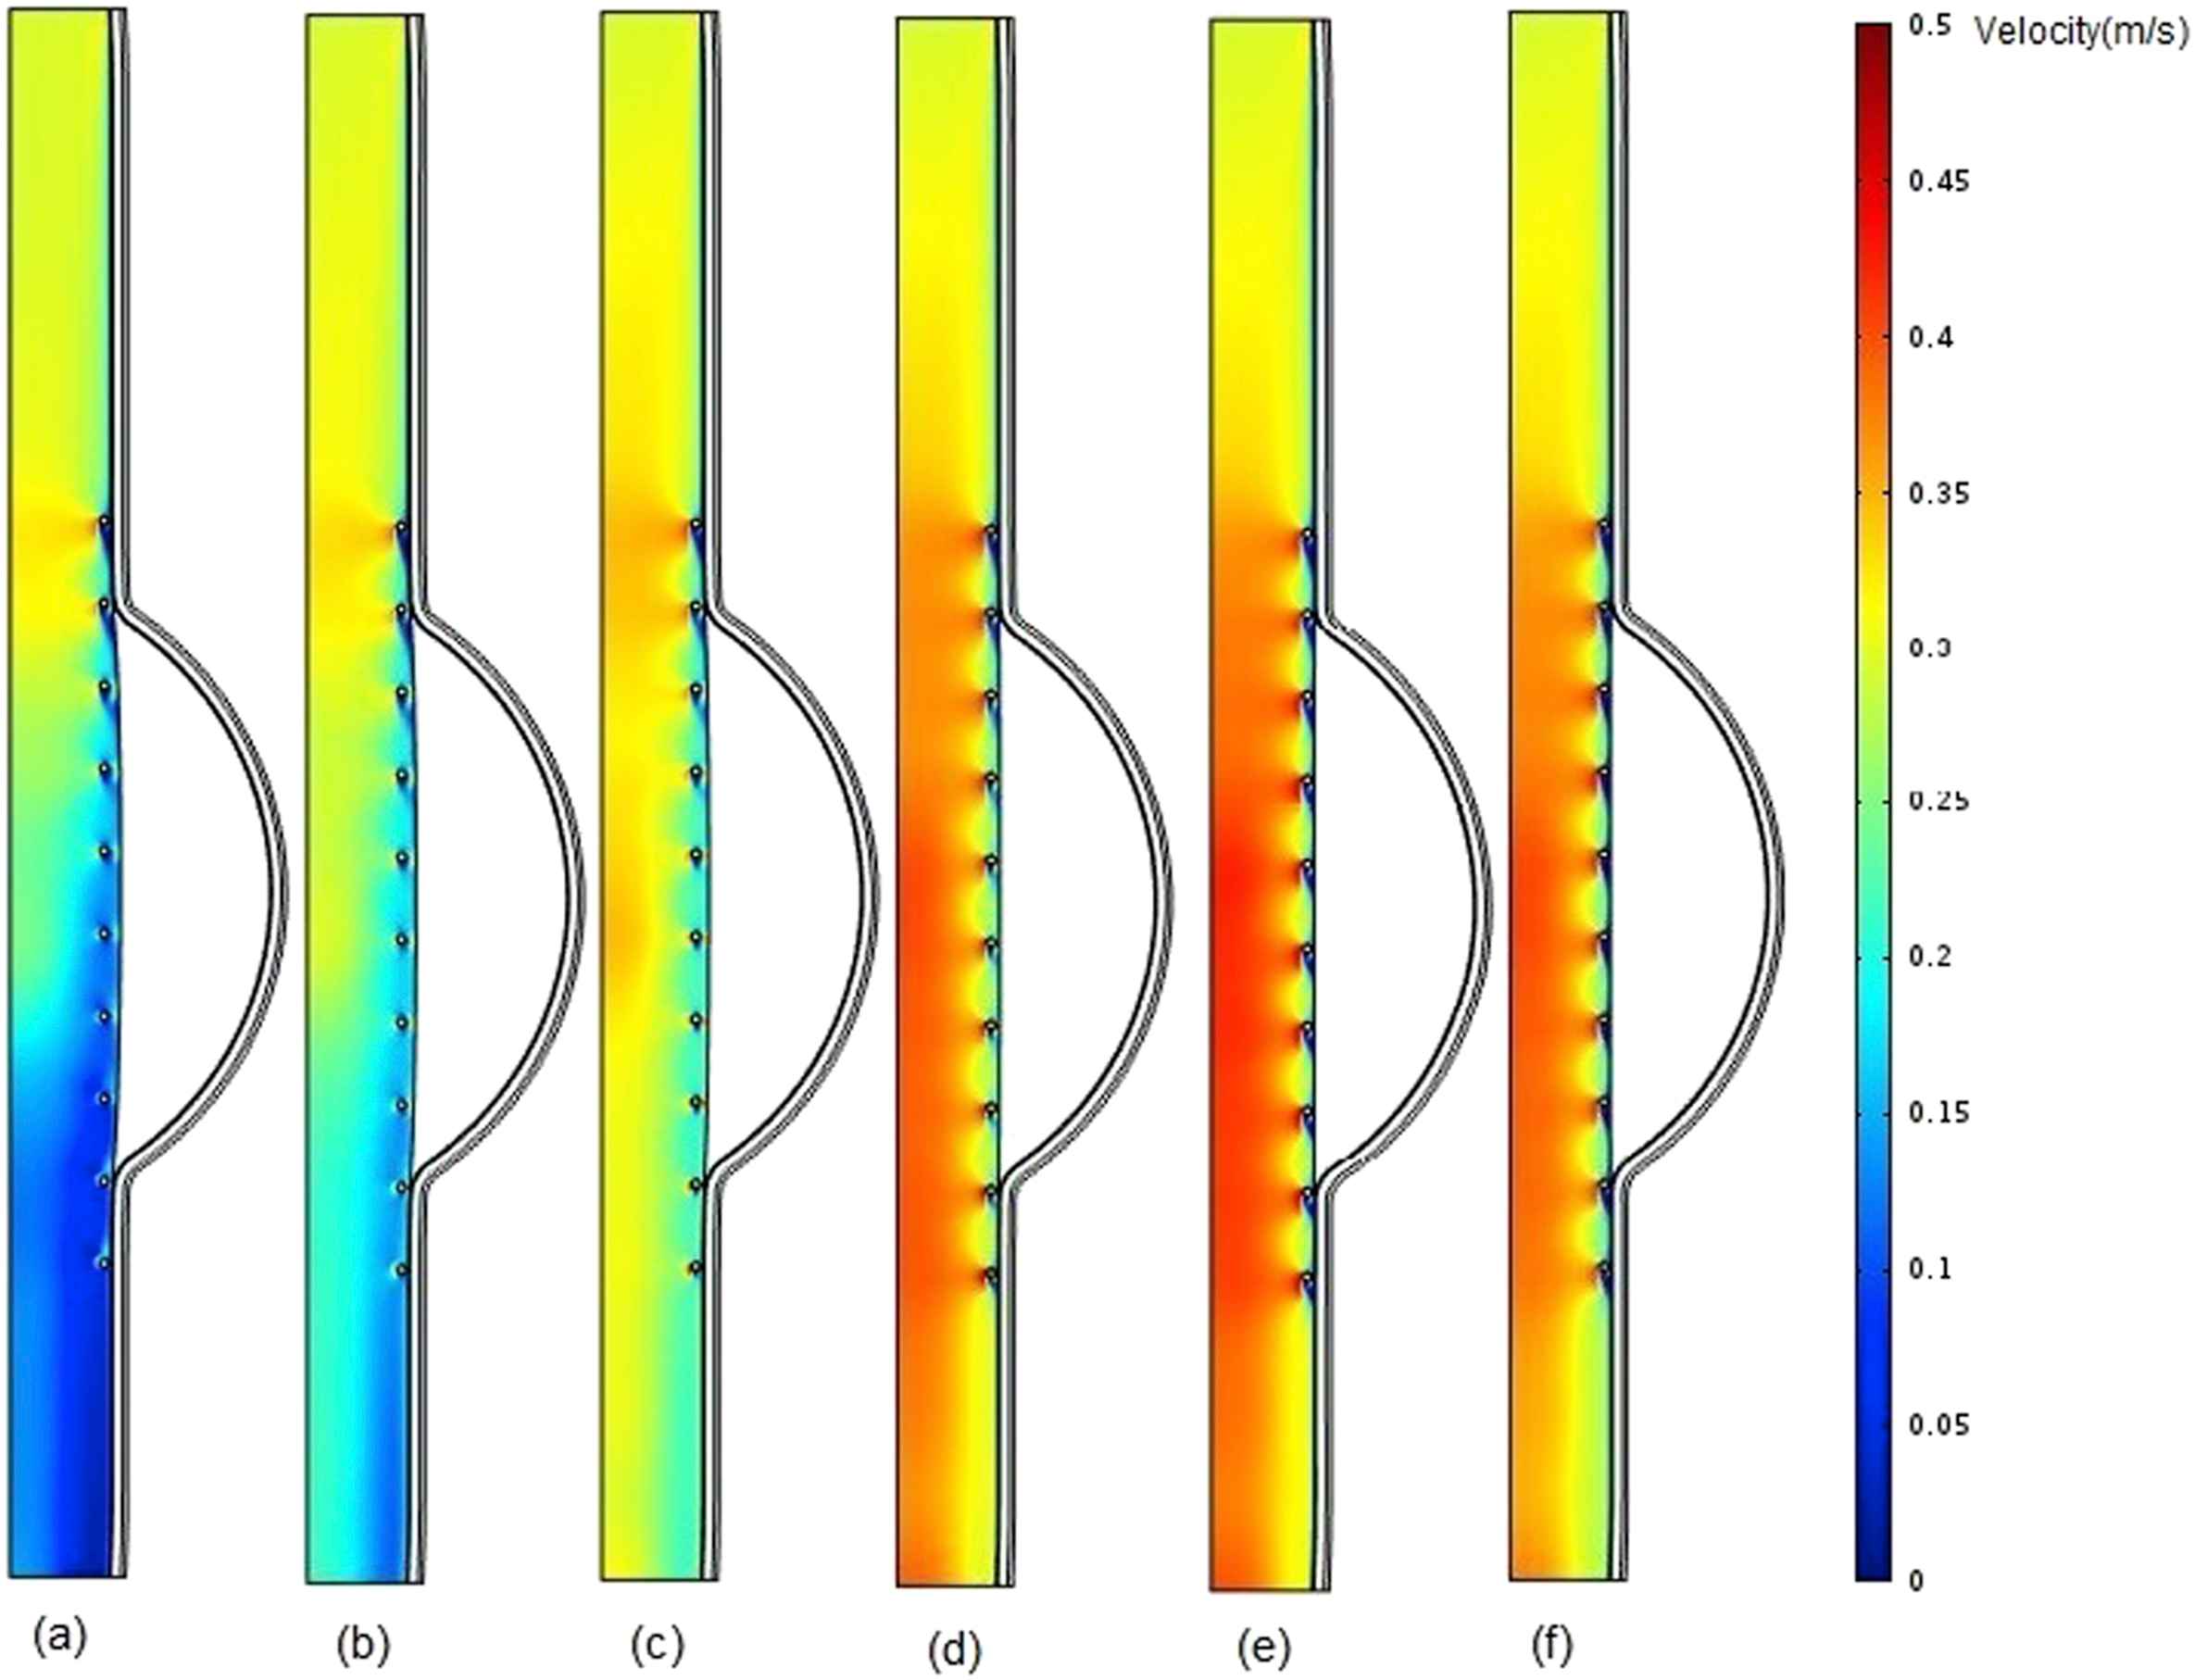
Comparison of pressure in stented aneurysm model in the case of filled cavity with ILT and changing thrombus modulus of elasticity (Eth) at the time of peak flow for a) Eth = 0.1 MPa b) Eth = 0.15 MPa, c) Eth = 0.2 MPa, d) Eth = 0.5 MPa, e) Eth = 1 MPa, and f) Eth = 2 MPa.
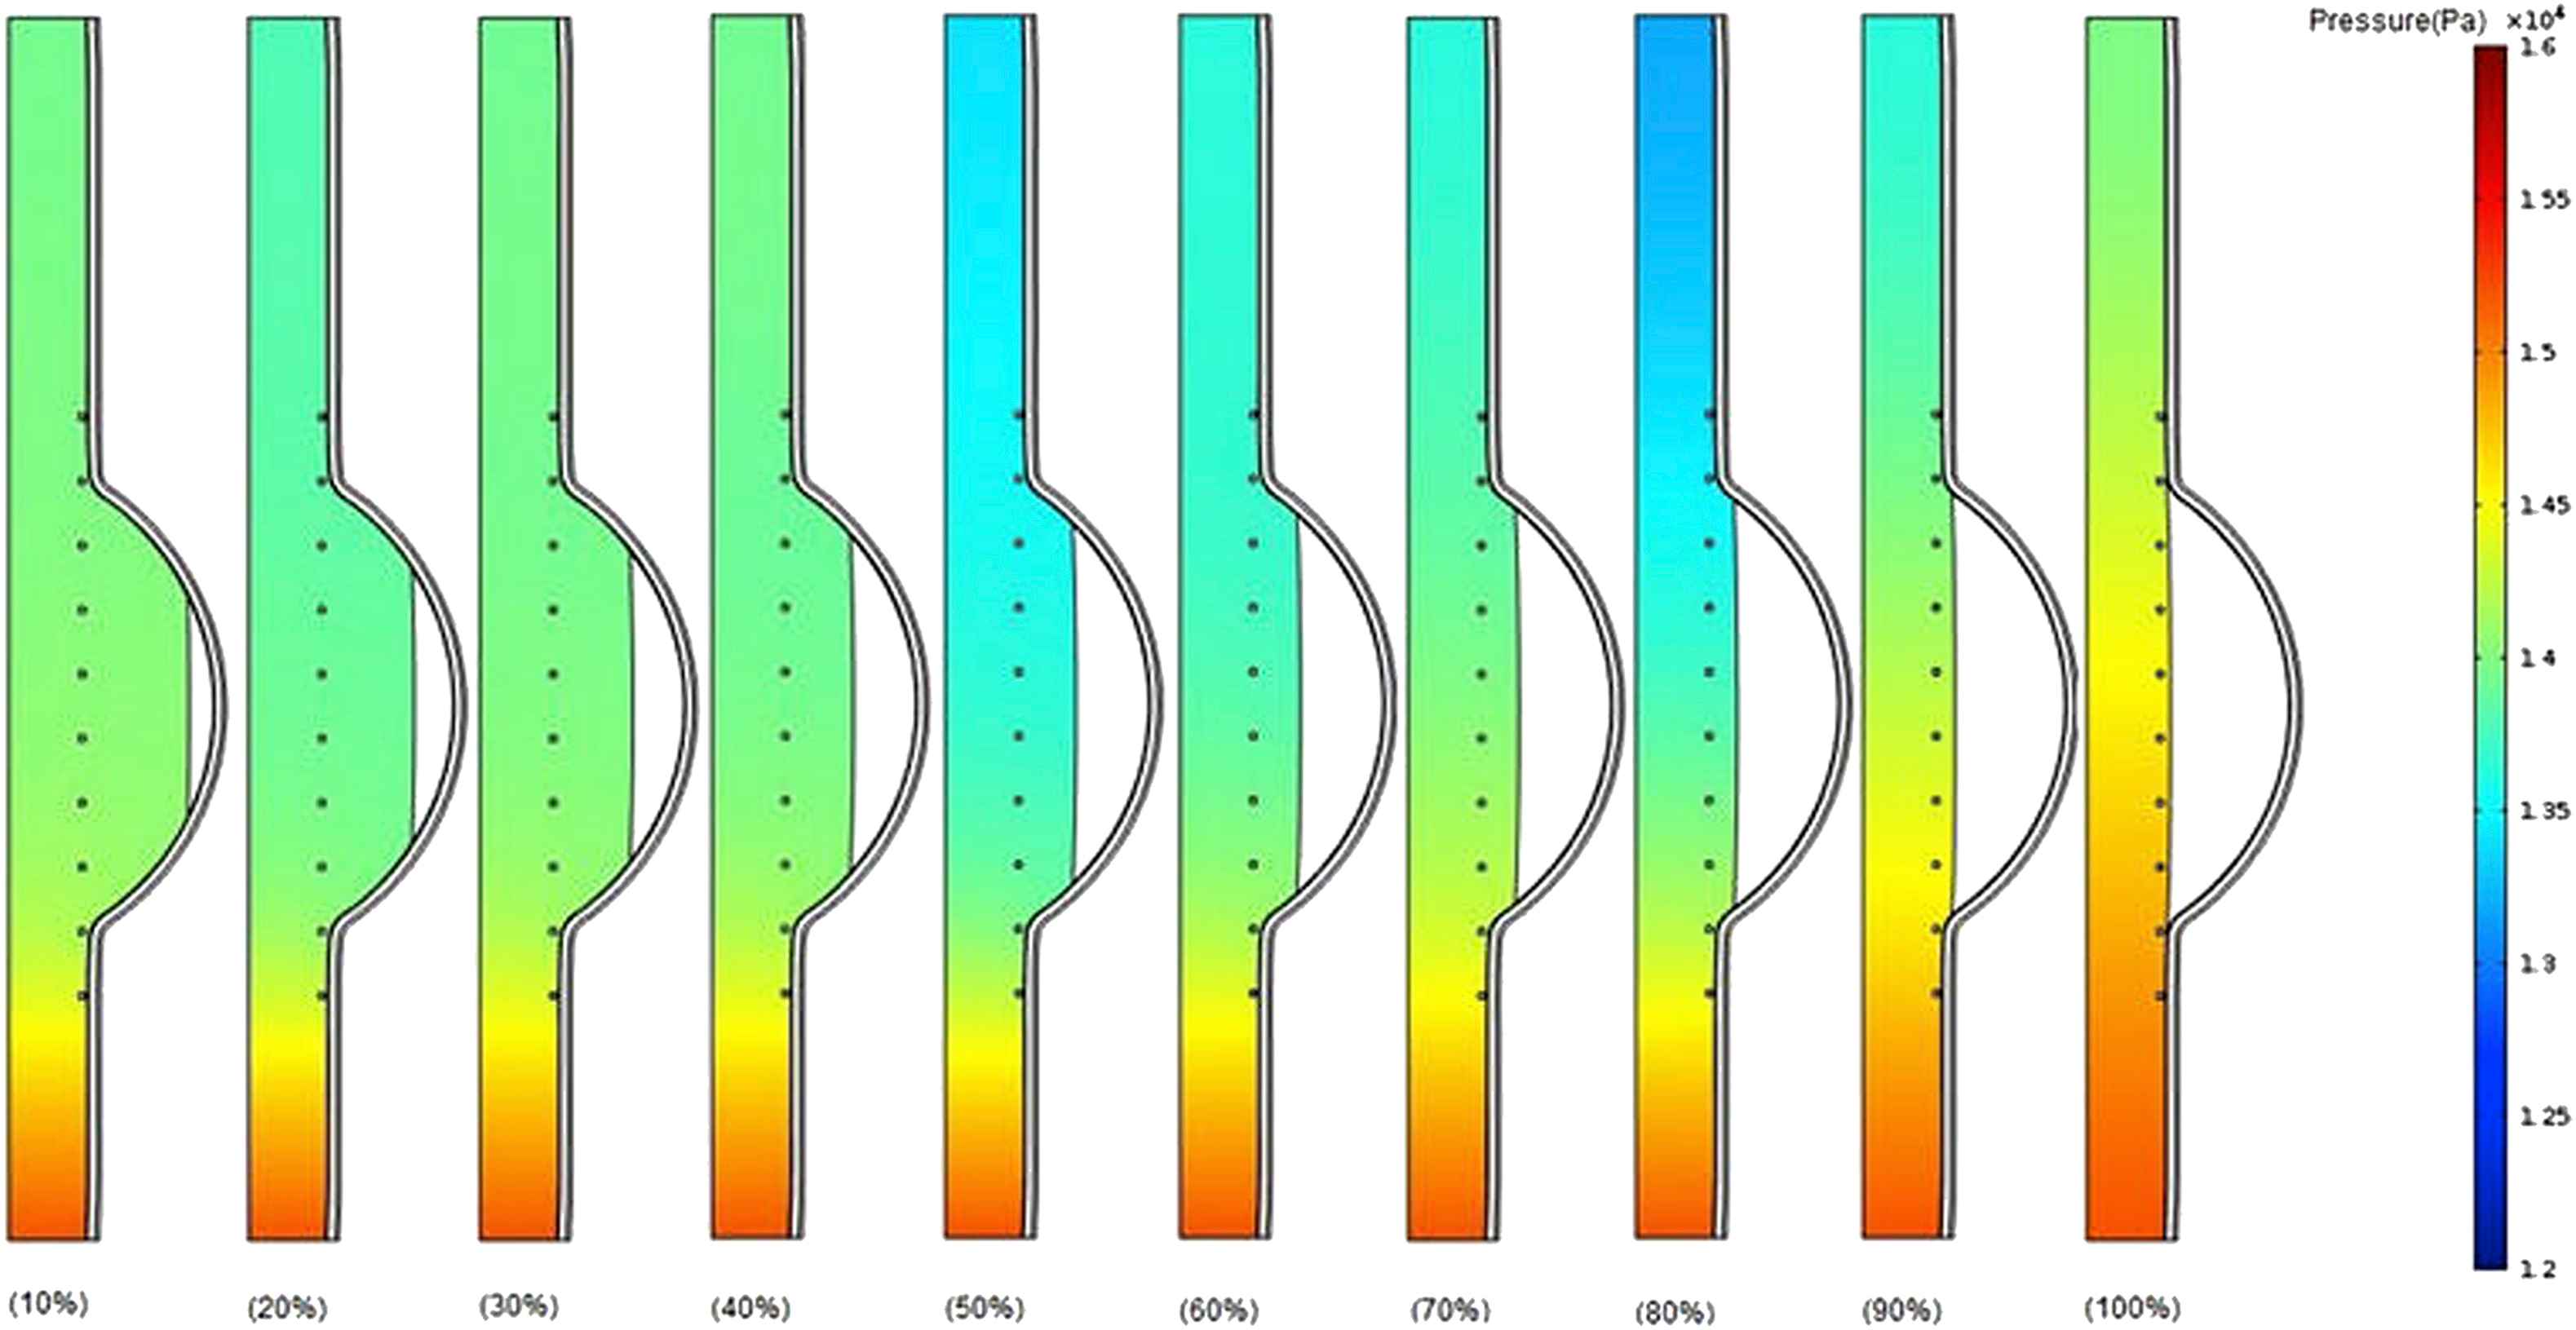
Figure 7 shows pressure contours for the different thrombus depth percentage increased from 10% to 100% with the elastic modulus of 0.2 MPa at the time of peak pressure.36 Although there is no notable considerable difference between the pressure values at the upstream before reaching to the thrombus region for all cases (10%–100% thrombus depth), an increase takes place in pressure values at the downstream after thrombus region particularly from 80% to 100% thrombus depth. It can be concluded that the increase in thrombus depth even approximately up to 50% has not significant effect on pressure change. The effect of thrombus on pressure may be dominant from 50% to 100% depth.
Comparison of pressure in the case of changing thrombus depth grows from 10% to 100% of aneurysm cavity with constant thrombus modulus of elasticity (Eth = 0.2 MPa) at the time of peak pressure.
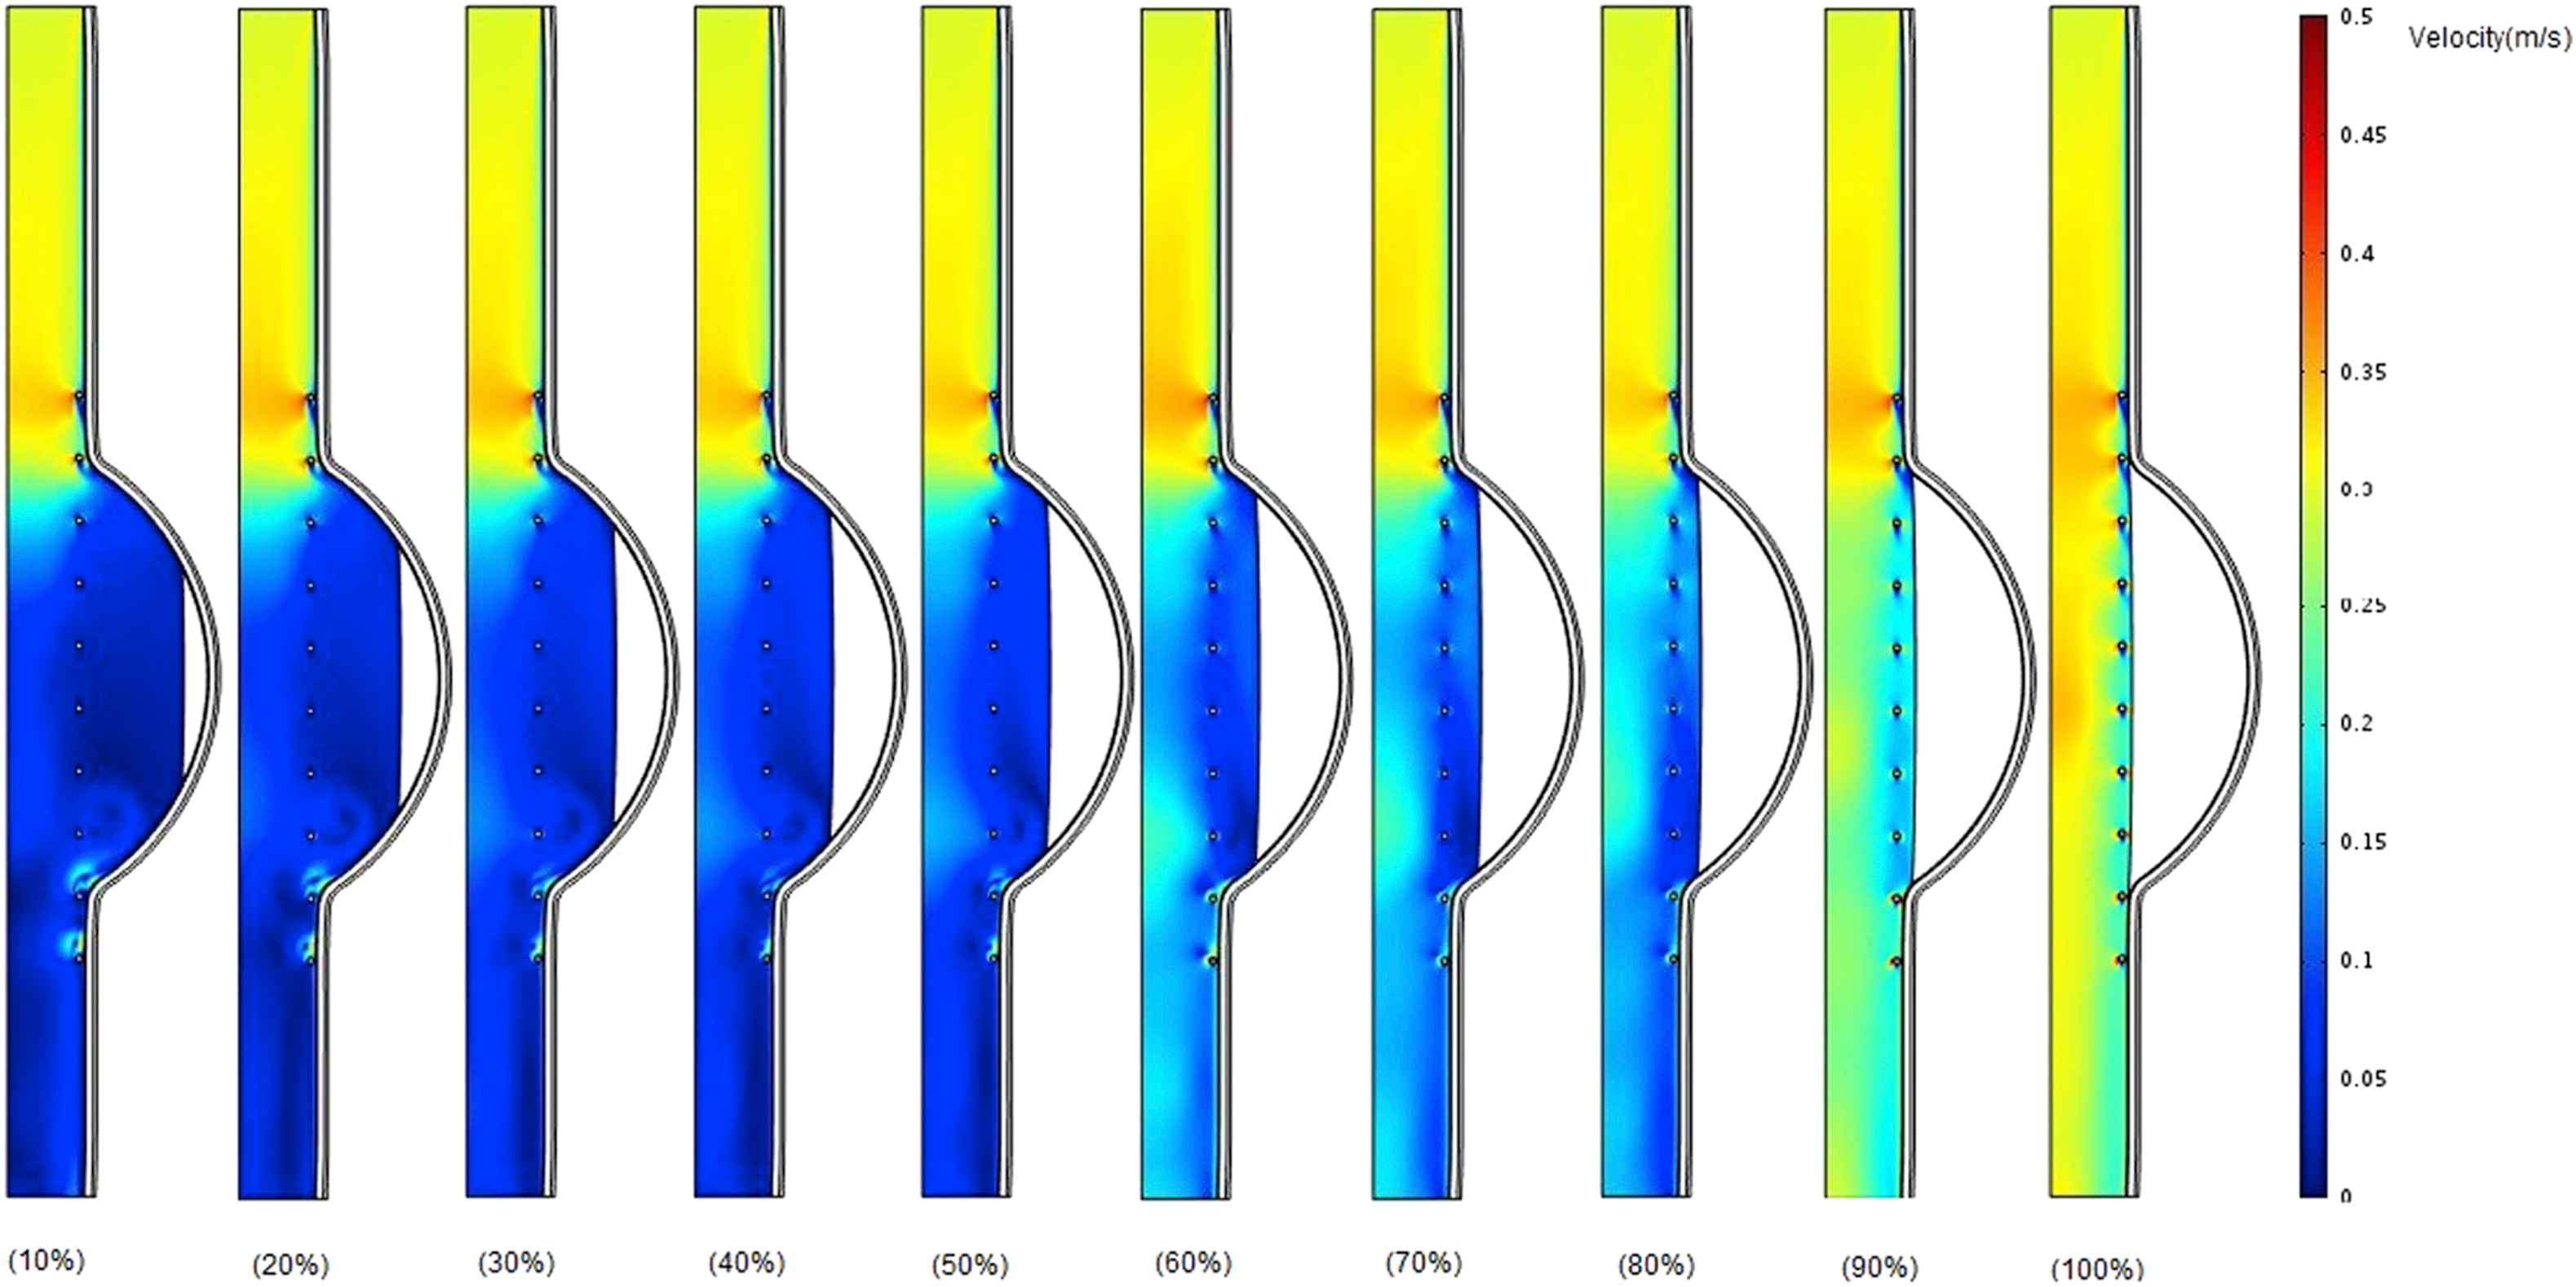
Figure 8 shows velocity contours for stented aneurysm model with different thrombus depth that varies from 10% to 100% at the time of peak flow when Eth = 0.2 MPa. At the entrance of the aneurysm, the blood flow velocity is much higher than that of downstream.
Comparison of velocity in the case of changing thrombus depth grows from 10% to 100% of aneurysm cavity with constant thrombus modulus of elasticity (Eth = 0.2 MPa) at the time of peak flow.
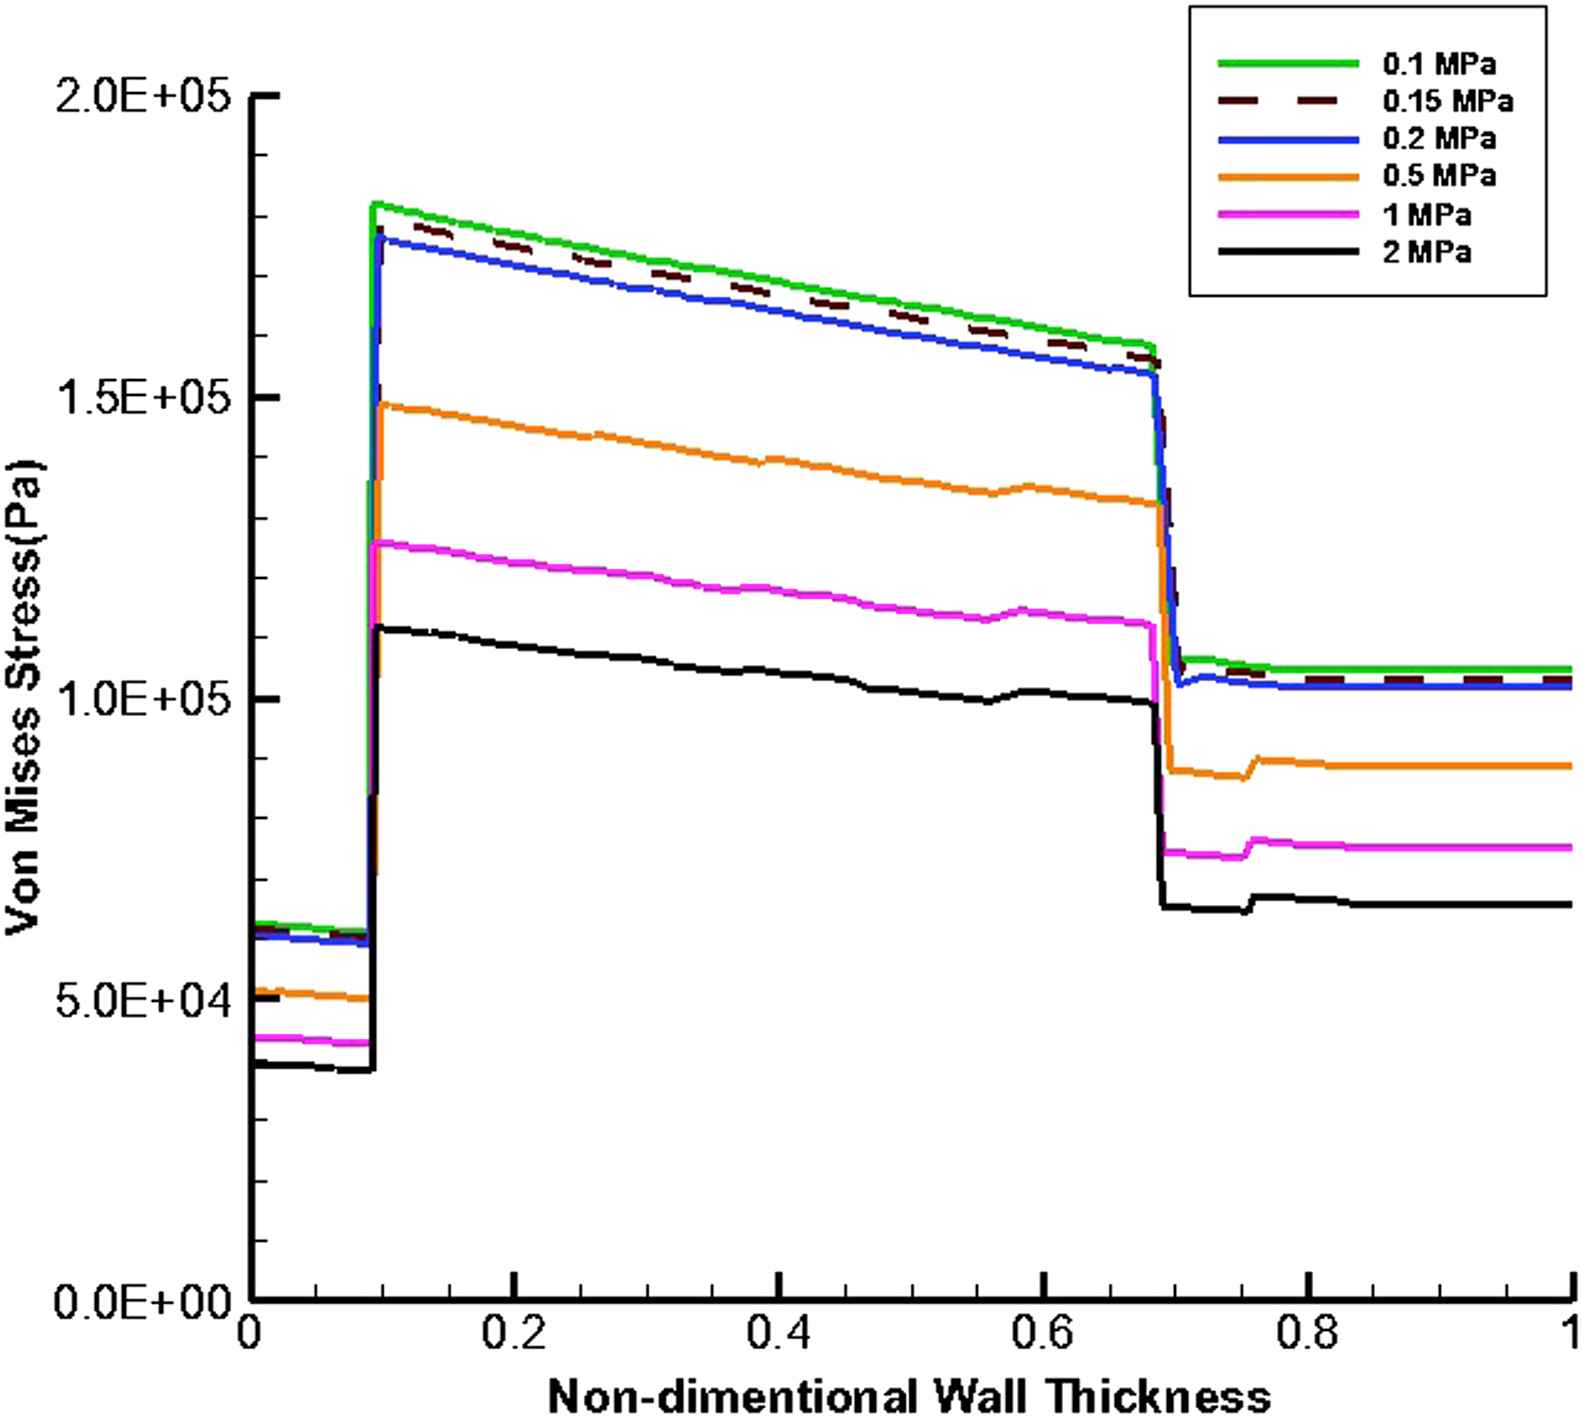
Figures 9 and 10 present the von Mises stress distribution along the wall thickness at the inflection points when entire cavity of aneurysm is filled with thrombus at the time peak flow and peak pressure, respectively.
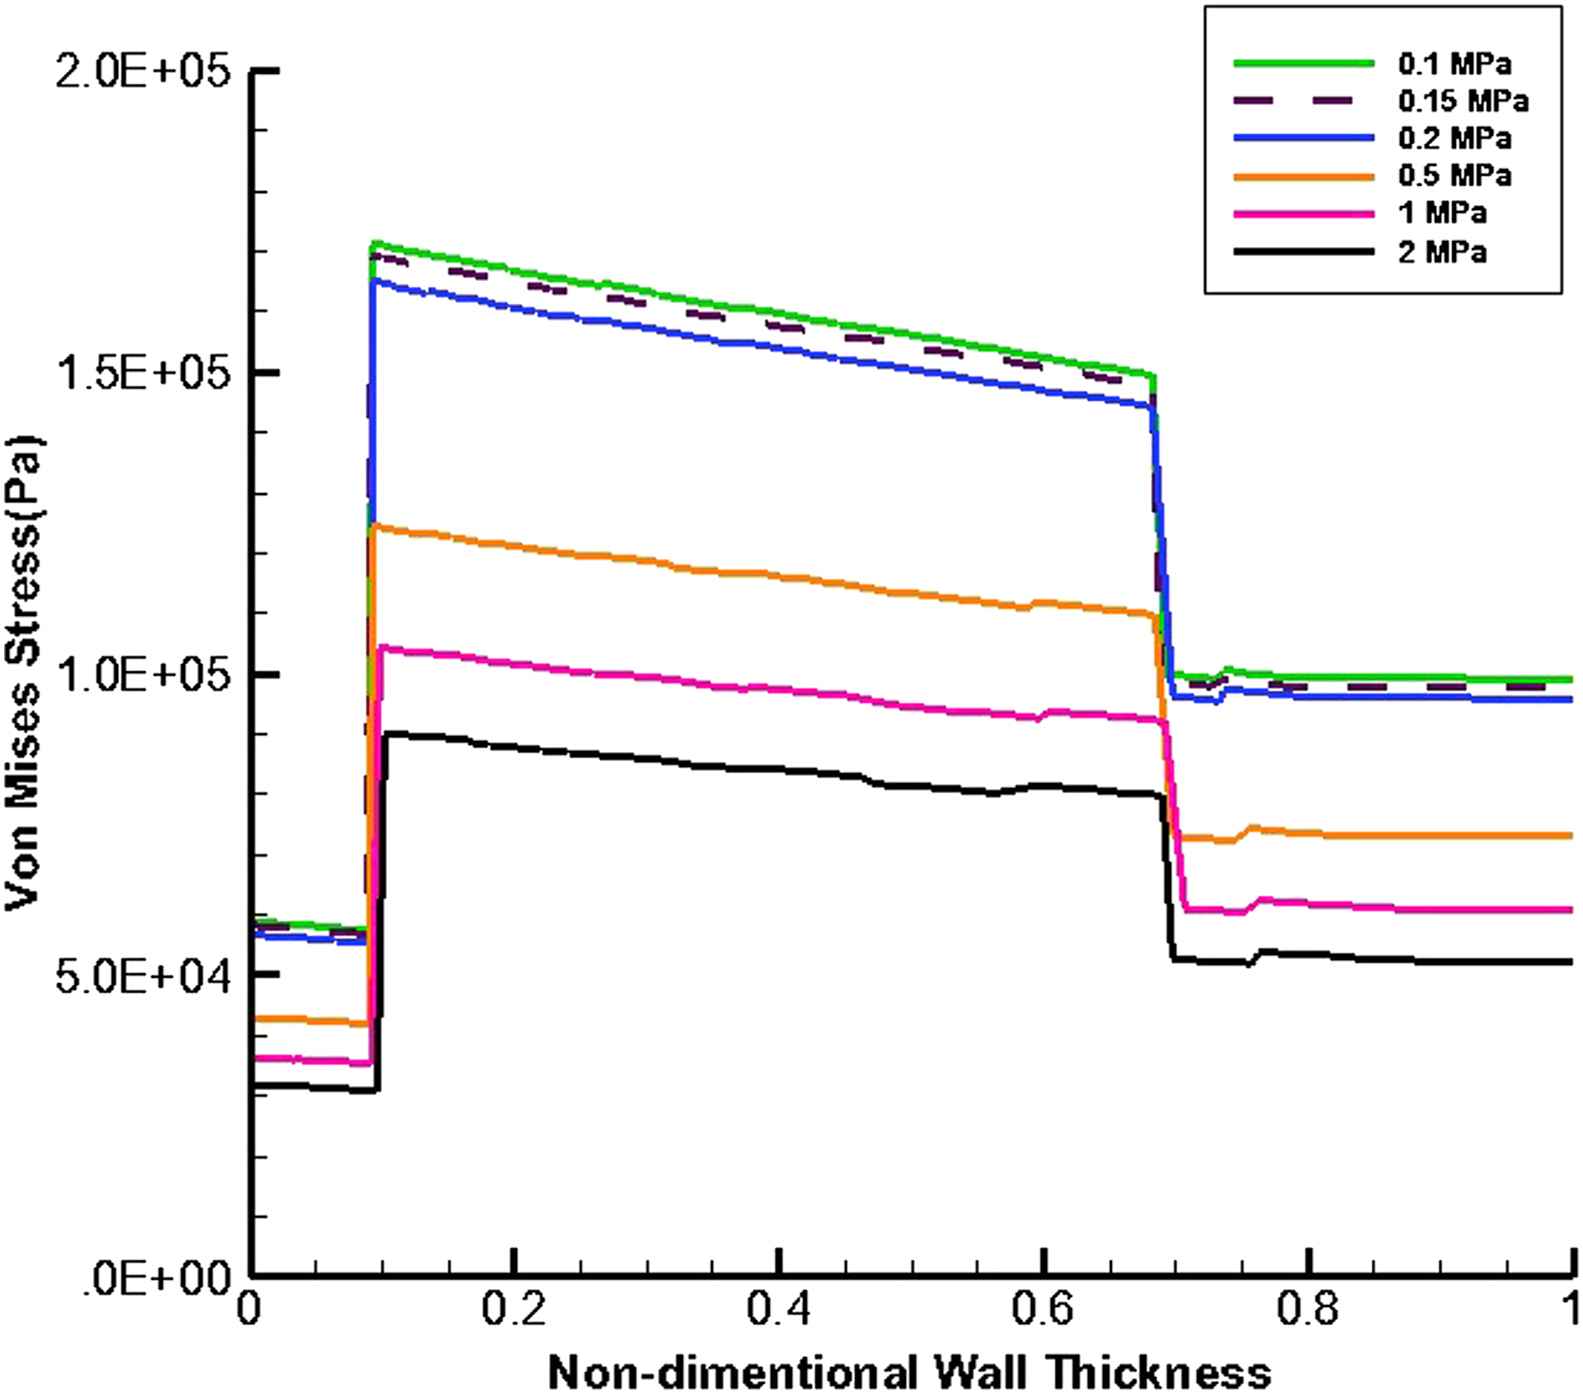
von Mises stress distribution along the wall thickness at the inflection points in the case of filled aneurysm cavity with thrombus at the time of peak flow.
von Mises stress distribution along the wall thickness at the inflection points in the case of filled aneurysm cavity with thrombus at the time of peak pressure.
Figures 11 and 12 show von Mises stress distribution along the wall thickness as the thrombus depth with the elastic modulus of 0.2 MPa fills 10%–100% of the entire cavity at the time of peak flow and peak pressure, respectively.
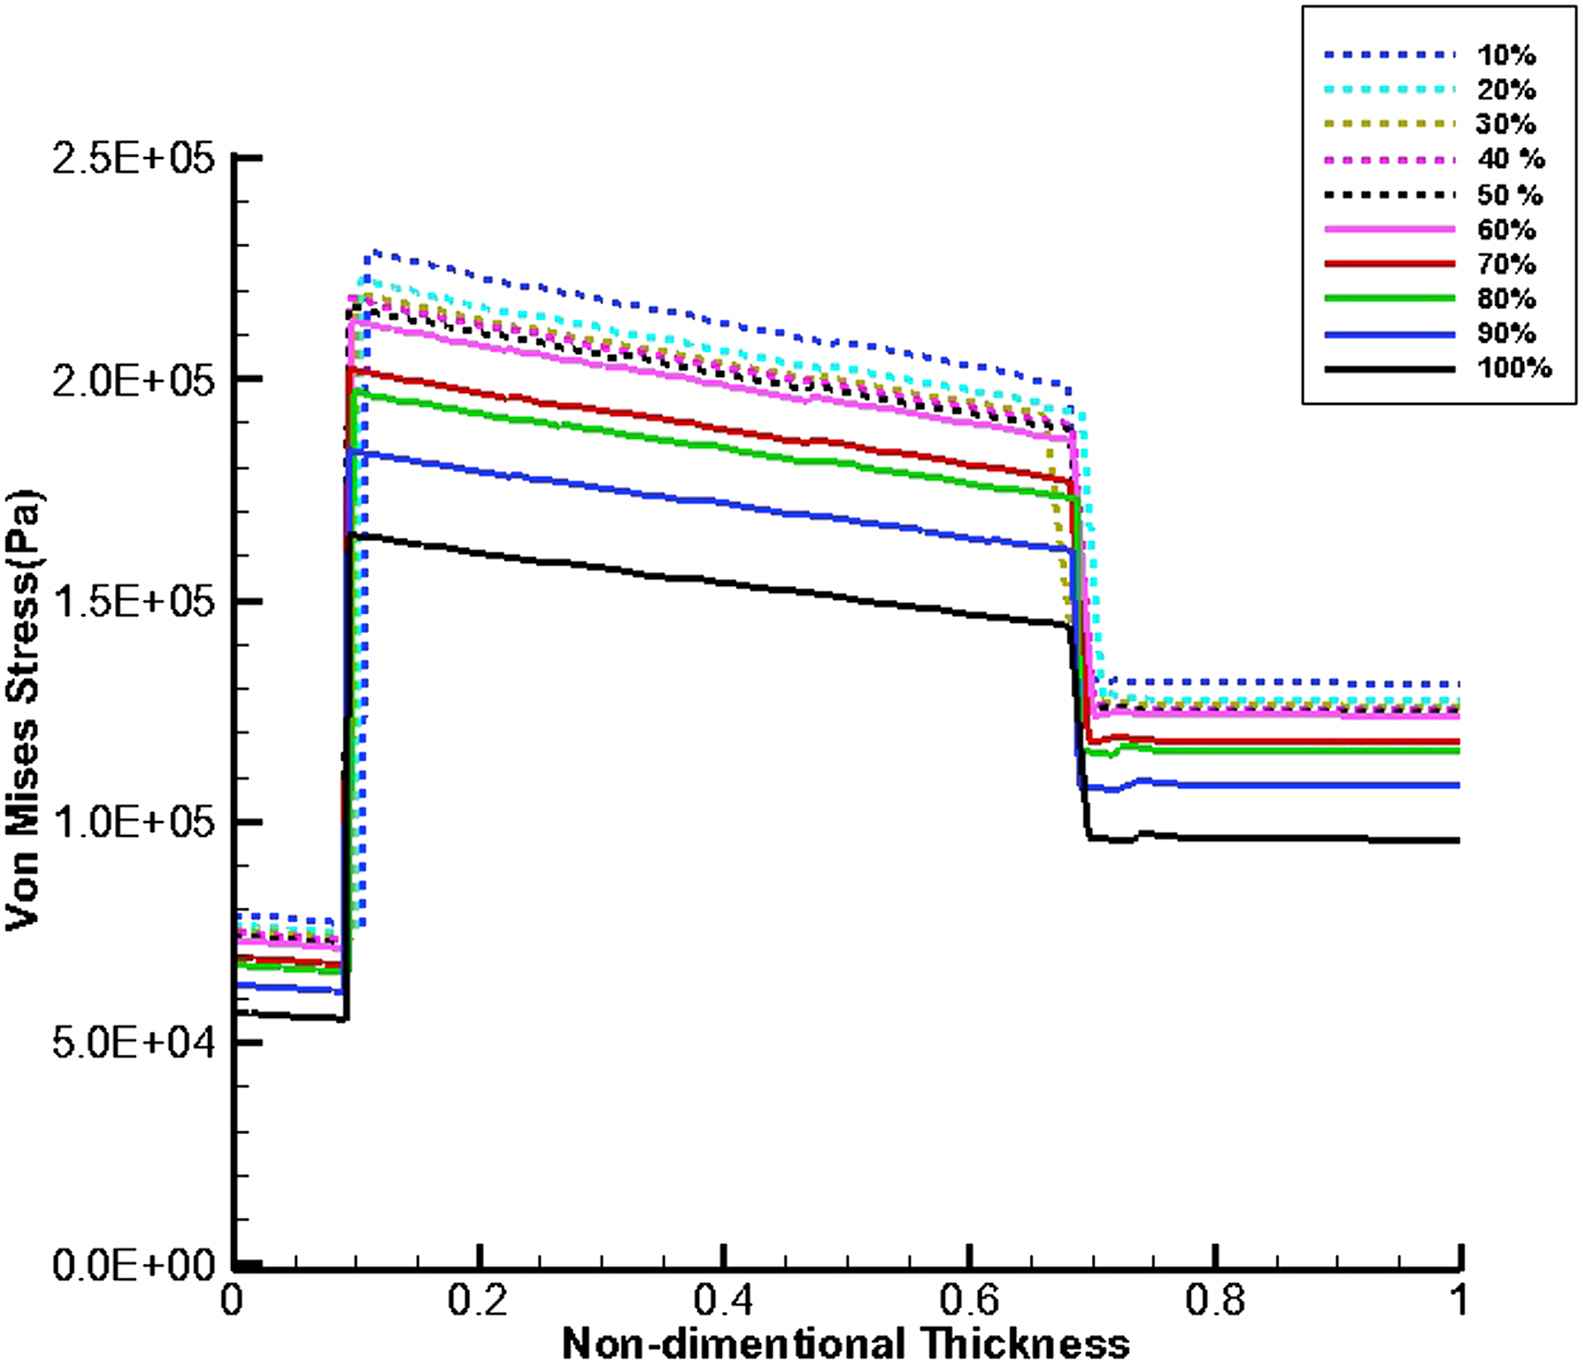
von Mises stress distribution along the wall thickness at the inflection points when thrombus depth grows from 10% to 100% of aneurysm cavity and elastic modulus of thrombus is constant (Eth = 0.2 MPa) at the time of peak flow.
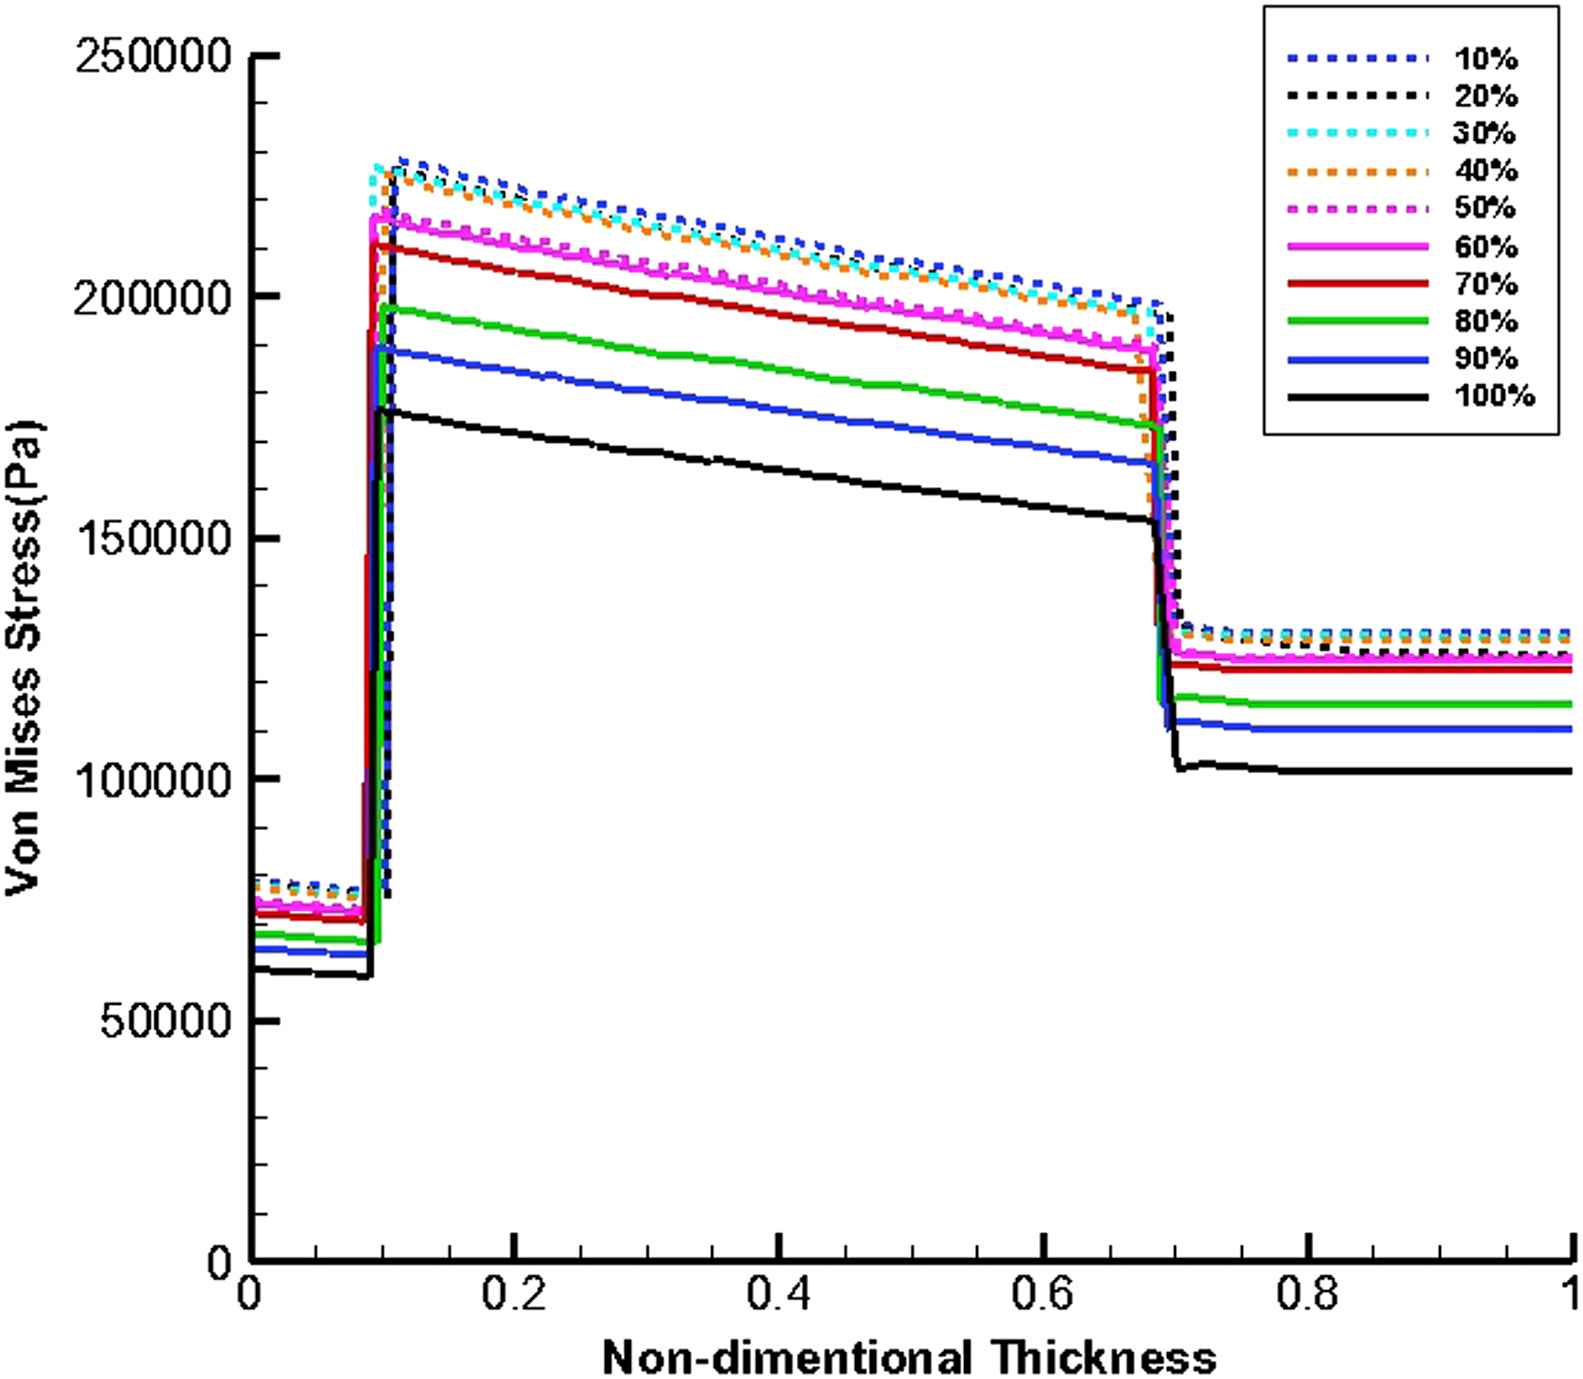
von Mises stress distribution along the wall thickness at the inflection points when thrombus depth grows from 10% to 100% of aneurysm cavity and elastic modulus of thrombus is constant (Eth = 0.2 MPa) at the time of peak pressure.
Discussion
According to the Fig. 5a, the blood pressure increases with moving from the inlet toward to the outlet. This is because the thrombus has the lower modulus of elasticity and consequently higher displacement than the intima. Therefore, the cross-sectional area of the vessel increases at the proximal neck of thrombus which makes the blood flow velocity to be decreased which in turn causes the blood pressure to be increased. As the modulus of elasticity of thrombus increases, the difference between pressure values of the inlet and outlet decreases. Since the difference between elasticity modulus of thrombus and intima has the minimum value in part (e), the lowest pressure change occurs in this part but in general the pressure magnitude has been increased and is about that of normal person,37 in comparison with previous parts of Fig. 5. As appeared in part (f), the pressure magnitude is lower than that of part (e). This may be due to a higher thrombus elastic modulus compared to that of the intima, which makes the blood to be uniformly.
It can be understood from the blood flow velocity contours (Fig. 6.) that the increase in thrombus elastic modulus causes the blood flow velocity to be increased. This is due to decrease in thrombus wall displacement. It is worth mentioned to say blood flow velocity for part (f), is lower than that of part (e). It may conclude that the highest velocity is obtained in the presence of uniform modulus of elasticity along the vessel.
The thrombus depth can affect the change in pressure if the thrombus depth is approximately more than 50% of cavity. Furthermore, it can be seen that the velocity increases by the growth of thrombus depth and this may be due to reduction in cross-sectional area at the distal neck.
At the time peak flow and peak pressure with the cavity-filled thrombus the media layer has the highest stress among three layers. Furthermore, the wall stress decreases by the value of 46% at the time of peak flow and 38% at the time of peak pressure as the elastic modulus of thrombus increases from 0.1 to 2 MPa. By increasing thrombus depth the wall stress is reduced. This reduction is considerable when the thrombus depth is higher than 60%. moreover, the wall stress decreases by the value of 27% at the time of peak flow and 22% at the time of peak pressure as thrombus depth grows from 10% to 100%.
Conclusion
The purpose of present study was to investigate hemodynamic parameters like blood flow velocity, pressure and wall stress distribution through a stented aortic aneurysm with intraluminal thrombus. A two-dimensional axisymmetric model of aortic aneurysm with various both depth and elastic modulus of thrombus in the presence of pulsatile flow with considering fluid-solid interaction was simulated. The results revealed that the wall stress decreases by the growth of thrombus elastic modulus for both times of peak flow and peak pressure and the difference between pressure values of the inlet and outlet at the time of peak pressure decreases in the case of reduction in difference between elastic modulus of intima and thrombus. Furthermore, at the time of peak flow as the thrombus elastic modulus closes to that of intima, the blood flow velocity increases. The amount of thrombus depth has significant effect on wall stress at both times of peak flow and peak pressure in such a way by increase in thrombus depth, the wall stress can be decreased and when thrombus depth is approximately higher than 50% of entire cavity, the pressure and velocity increases at the peak pressure and velocity times, respectively. Our results also show that the media layer is subjected to higher loads than other layers and that the stresses are much higher in the media layer in all cases. The achievements of this study can help the researchers by providing more detailed information about aortic aneurysm with intraluminal thrombus.
Conflicts of interest
We declare that we have no conflicts of interest.
Acknowledgments
The authors acknowledge the Iran University of Science and Technology for funding this project.
References
Cite this article
TY  - JOUR
AU  - Mohammad Alagheband
AU  - Shahrokh Rahmani
AU  - Mansour Alizadeh
AU  - Alireza Karimi
AU  - Mahdi Navidbakhsh
PY  - 2015
DA  - 2015/02/11
TI  - Hemodynamic investigation of intraluminal thrombus effect on the wall stress in a stented three-layered aortic aneurysm model under pulsatile flow
JO  - Artery Research
SP  - 11
EP  - 19
VL  - 10
IS  - C
SN  - 1876-4401
UR  - https://doi.org/10.1016/j.artres.2015.01.002
DO  - 10.1016/j.artres.2015.01.002
ID  - Alagheband2015
ER  -