
In vivo Modulatory Effect of Coffee (Coffea canephora var. Robusta) on the Expression Levels of Murine microRNA-124-3p Associated with Antioxidant Defenses
- DOI
- 10.2991/efood.k.190802.001How to use a DOI?
- Keywords
- Epigenetics; Coffea canephora var. Robusta; in vivo study
- Abstract
Antioxidant activity is one of the most studied properties of coffee as a beverage, and is mainly ascribed to its polyphenol content, although there is limited scientific literature regarding its mechanism of action at the molecular level. In recent years, epigenetics has been featured as a promising approach in many studies for explaining the mechanisms of action involved in its effects on health exerted by foods and food components. To investigate such an epigenetic contribution toward the antioxidant properties of coffee, an in vivo study was performed on healthy C57BL/6 mice fed with a normal diet supplemented with a low-molecular-weight (MW) fraction (MW < 3500 Da) obtained from regular and decaffeinated coffee. Regular coffee supplementation induced a downregulation of microRNA-124-3p, and its validated target, mRNA coding for glutathione peroxidase (GPX), was upregulated. Decaffeinated coffee was not found to induce any significant changes in the expression levels of microRNA-124-3p and its validated target mRNA. It may be concluded from the results that regular intake of coffee exerts its antioxidant activity through an epigenetic mechanism of action, at least in part, being able to influence the expression levels on a miRNA and an mRNA involved in antioxidant defenses, with caffeine playing a crucial role.
- Copyright
- © 2019 International Association of Dietetic Nutrition and Safety. Publishing services by Atlantis Press International B.V.
- Open Access
- This is an open access article distributed under the CC BY-NC 4.0 license (http://creativecommons.org/licenses/by-nc/4.0/).
1. INTRODUCTION
Coffee is the third most consumed beverage worldwide, following water and tea [1]. The genus Coffea includes about 125 different species, with the most commonly consumed being Coffea arabica, widely appreciated for its high quality and typical aroma and taste, and Coffea canephora var. Robusta, known to impart a stronger and bitterer taste and exert greater health properties, as it contains higher amounts of chlorogenic acid derivatives and caffeine [2–7]. In addition to these compounds, the other bioactive components present in coffee beans are theobromine, theophylline, diterpenes (i.e., cafestol and kaweol) and micronutrients, such as magnesium, potassium, and vitamin B3, which are derived from trigonelline present before the roasting process [8,9]. The concentrations of these compounds and the biological activities ascribed to drinking coffee depend on several factors such as variations in the plant itself (species, origin, and genetic characteristics), cultivation and harvesting techniques, storage conditions, degree and type of roasting process, type of coffee, and its method of preparation (boiled, unfiltered, filtered, or espresso). Drastic roasting may lead to the loss of 95% of the chlorogenic acids. Despite this, coffee is the only beverage richest in chlorogenic acids with a single cup of espresso coffee containing between 24 and 423 mg of these polyphenols [10].
The antioxidant activity of coffee is well known, but scientific literature is poor in in vivo studies demonstrating the antioxidant effects of coffee consumption. To the best of our knowledge, only six in vivo studies on the antioxidant activity of coffee have been published during the past decade, of which only one was a clinical trial. A 2008 study on C57BL/6J mice evaluated the antioxidant effects of coffee (present in drinking water containing coffee at a concentration of 35 g/L) and its components [caffeine (400 mg/L), chlorogenic acid (150 mg/L) and caffeic acid (10 mg/L)] by measuring lipid peroxidation through the quantification of total hydroxyoctadecadienoic acid in mouse plasma and liver samples by gas chromatography–mass spectrometry. The study showed that a significant antioxidant effect was found only in the group treated with a normal diet with the addition of coffee [11]. In 2011, Abreu et al. demonstrated the antioxidant effects of coffee and caffeine on the brain of rats treated with a diet supplemented with 3% and 6% coffee and 0.04% and 0.08% caffeine for 80 days against control. In rats that received diets supplemented with coffee and caffeine, authors observed a decrease in thiobarbituric acid reactive substances of 38% and an increase in the levels of glutathione reductase, superoxide dismutase, and glutathione (56%, 54%, and 60% increase, respectively) [12]. Recently, Choi et al. [13] published a research article on the antioxidant and anti-inflammatory activities of coffee with four different degrees of roasting in C57BL/6 mice. Mice were pretreated with coffee (300 mg/kg body weight) by oral gavage for 10 days, followed by an intraperitoneally administered dose of lipopolysaccharide (LPS – 15 mg/kg body weight). To assess the antioxidant effect of coffee, glutathione levels were determined in liver samples and the mRNA expression levels of enzymes involved in glutathione synthesis were quantified. Before the administration of LPS, mice pretreated with light roasted coffee showed the highest concentrations of glutathione levels, which decreased with the increasing degrees of roasting. These results have been confirmed with an analysis of mRNA expression levels related to the enzymes involved in glutathione synthesis, such as glutathione synthetase, glutamate-cysteine ligase catalytic and modified subunit, and glutathione peroxidase (GPX) enzyme. Contrary to the authors’ expectations, the results obtained following the administration of LPS did not reveal a significant beneficial effect of coffee pretreatment, considering all the degrees of roasting [13]. Three other research articles investigating the effects of coffee supplementation on antioxidant enzyme expression levels in rats have been published during the last decade, of which two articles showed a significant increase in superoxide dismutase, catalase, and GPX synthesis in hepatic tissue after both a single dose (2 mL) or multiple doses (2 mL/die for 28 days) of coffee, whereas the third article showed an insignificant increase in antioxidant enzyme synthesis in the anterior tibialis muscular tissue after strenuous exercise in rats treated with 3.8 mL/kg/die of coffee for 21 days [14–16].
Growing evidence suggests that coffee exerts epigenetic effects. Four research articles on the epigenetic activity of coffee and its antioxidant bioactive compounds were published between 2016 and 2017. These articles include two cohort studies on potential links between coffee consumption and blood DNA methylation levels with conflicting results [17,18]. A research article on Caco-2 human colon carcinoma cell cultures elucidates the epigenetic mechanisms of coffee in the prevention of colon carcinoma, via the upregulation of expression of two microRNAs (miR-30c and miR-96), which target Kristen rat sarcoma oncogene gene, inhibiting the synthesis of the proto-oncogene involved in cancer development in a dose-dependent manner [19]. Wang et al. [20] found that chlorogenic acid inhibits schistosomiasis-induced liver fibrosis in both hepatic stellate LX2 cell lines and in schistosoma-infected mice, through interleukin 13/miR-21/Smad7 signaling interactions.
In view of the above, the increasing body of evidence suggesting that coffee acts through epigenetic mechanisms indicates that epigenetic studies may be a valid approach to investigate the mechanisms of the antioxidant activity of coffee, both in in vitro and in vivo systems. In the last decade, only one study on the in vivo antioxidant activity of coffee, indirectly underlying its epigenetic activities, was published in the scientific literature. This was an in-depth study by Kalthoff et al. investigating the mechanism by which coffee exerts protective effects against oxidative stress induced by benzo[α]pyrene (BaP), a polycyclic aromatic hydrocarbon with cytotoxic, carcinogenic, and mutagenic activities, found in large concentrations in tobacco smoke. Mice were treated with coffee (150 mL of coffee beverage prepared with 6 g of ground coffee) for 18 days (the form of administration was left unspecified) with BaP or corn oil (125 mg/kg body weight) administered intraperitoneally during the last 3 days of treatment. On the 19th day, mice were culled and organs collected. The results demonstrated that coffee exerts protective effects against BaP-induced ROS- and H2O2-production by upregulation of UGT1A expression. An epigenetic approach was used to better understand the mechanisms underlying the results obtained in vivo. Hepatocarcinoma and esophageal squamous carcinoma cell lines were cultured in the presence of BaP. The coffee beverage was diluted into the growth medium at a concentration of 12%. Part of the cell cultures were treated with siRNA to induce UGT1A silencing. Results show that the coffee-mediated reduction of ROS production was significantly impaired following siRNA treatment, compared with cell cultures with no siRNA treatment. The in vitro epigenetic analyses confirmed the results obtained in vivo, as per the authors’ hypothesis; furthermore, the epigenetic approach better demonstrates that UGT1A expression levels are directly modulated by coffee under oxidative stress induced by BaP [21].
Because of the poor evidence underling the in vivo antioxidant activity of coffee and its mechanisms of action, 36 healthy C57BL/6 mice were used to investigate the epigenetic effect of Robusta coffee (Coffea canephora Pierre ex A. Froehner var. Robusta) supplementation (both regular and decaffeinated) on the enzymes involved in antioxidant defenses. Low-MW (MW < 3500 Da) coffee fractions obtained from decaffeinated and regular coffee were chosen to focus the attention on polyphenols, on which the antioxidant activity of foods and beverages are generally ascribed, and caffeine, excluding the possible influence of melanoidins known to possess antioxidant activity but have low bioavailability due to their high molecular weight. Coffee fractions, incorporated in the mice feed pellets, were previously characterized by HPLC–PAD–ESI–MSn to find a correlation between the registered in vivo effects and the composition of the standardized coffee extract.
2. RESULTS
2.1. HPLC–PAD–ESI–MSn Analysis
To evaluate the in vivo epigenetic effects, regular and decaffeinated low-MW Robusta coffee fractions (MW < 3500 Da) were prepared according to the protocol described in the “Materials and Methods” section to obtain a polyphenol-rich fraction.
Our study started with the characterization of sample composition by means of the HPLC–PAD–ESI–MSn method. In agreement with the evidence cited in the “Introduction” section, regarding the in vivo antioxidant activity of coffee and its components, the chemical characterization of the regular and decaffeinated coffee fractions is crucial in understanding whether the biological activity of coffee can be ascribed to caffeine, or to polyphenols. Retention times, UV–Vis and MS spectra were used to identify the main polyphenol compounds occurring in the coffee fractions: 17 hydroxycinnamic acid derivatives were identified in the regular coffee fraction, together with an organic acid (dihydroxybenzoic acid), as shown in Figure 1a and Table 1; the decaffeinated coffee fraction only yielded 12 hydroxycinnamic derivatives, again with dihydroxybenzoic acid Figure 1b and Table 2.
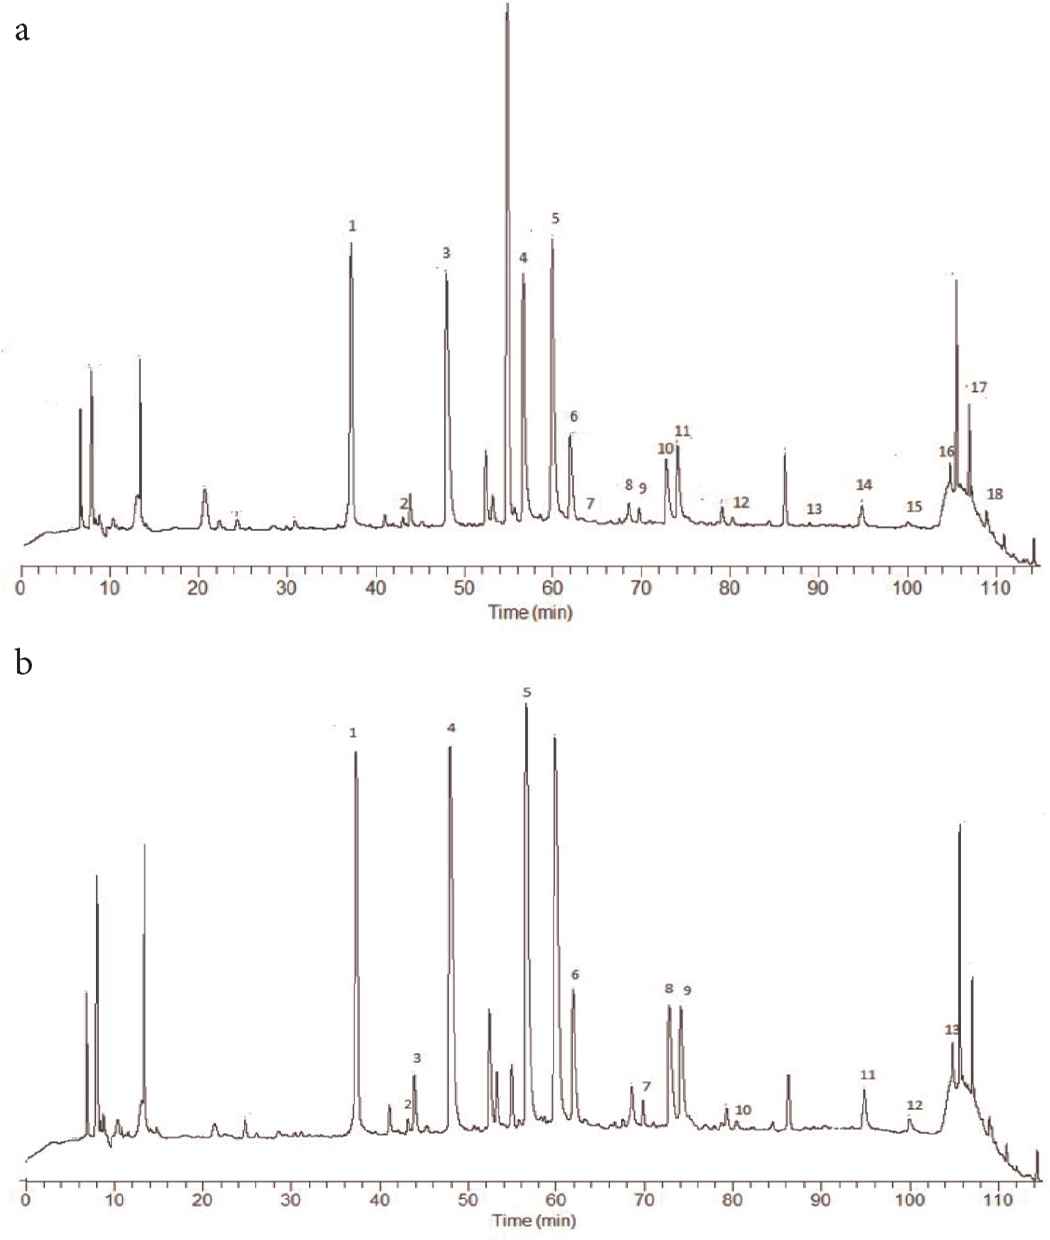
Chromatogram resulting from RP-HPLC–UV–PAD analysis shows the polyphenolic profile of the fraction with a MW < 3500 Da obtained from: (a) regular coffee; (b) decaffeinated coffee.
| Peak | Retention time (min) | m/z [M − H]− | m/z fragment ions (% of the base peak) | λmax (nm) | Proposed structure |
|---|---|---|---|---|---|
| 1 | 37.18 | 153 | 191 (100), 82 (2), 48 (2) | 258 | Dihydroxybenzoic acid |
| 2 | 43.98 | 353 | 179 (100), 135 (20) | 324 | Cis-3-CQA |
| 3 | 48.10 | 353 | 191 (100), 179 (58), 135 (10) | 325 | 3-CQA |
| 4 | 56.81 | 353 | 191 (100), 179 (10) | 325 | 4-CQA |
| 5 | 60.00 | 353 | 191 (100), 179 (10), 135 (5) | 325 | 5-CQA |
| 6 | 62.00 | 367 | 193 (100), 191 (2) | 324 | 3-FQA |
| 7 | 63.48 | 533 | 359 (100), 191 (20), 255 (10), 370 (5) | 325 | 3-H-caffeoyl-4-caffeoylquinic |
| 8 | 66.81 | 515 | 353 (100), 335 (25) | 325 | 1,3-diCQA |
| 9 | 70.17 | 337 | 173 (100), 160 (38) | 324 | 4-pCoQA |
| 10 | 72.83 | 367 | 191 (100), 173 (2) | 324 | 5-FQA |
| 11 | 74.90 | 367 | 173 (100), 191 (85) | 324 | 4-FQA |
| 12 | 80.16 | 193 | 149 (100), 178 (50), 134 (15) | 292 | Ferulic acid |
| 13 | 91.49 | 515 | 353 (100), 203 (5), 191 (5) | 324 | 4,5-diCQA |
| 14 | 94.87 | 515 | 353 (95), 335 (8), 299 (5), 255 (2), 2103 (2), 179 (10), 173 (10) | 324 | 3,4-diCQA |
| 15 | 100.33 | 515 | 353 (100), 335 (8), 317 (10), 299 (18), 255 (15), 203 (25), 179 (5) | 325 | 1,4-diCQA |
| 16 | 104.75 | 529 | 367 (95), 335 (8), 349 (5) | 324 | CFQA-2 |
| 17 | 107.42 | 543 | 349 (100), 367 (20) | 270 | 3,4-Di-O-feruloylquinic acid |
| 18 | 107.92 | 543 | 367 (100), 349 (25) | 270 | 3,5-Di-O-feruloylquinic acid |
CFQA, caffeoyl-feruloylquinic acid; CQA, caffeoylquinic acid; FQA, feruloylquinic acid; pCoQA, p-coumaroylquinic acid.
Chromatographic and spectrophotometric data obtained by HPLC analysis of regular coffee fraction (MW < 3500 Da)
| Peak | Retention time (min) | m/z [M − H]− | m/z fragment ions (% of the base peak) | λmax (nm) | Proposed structure |
|---|---|---|---|---|---|
| 1 | 37.31 | 153 | 109 (100), 82 (2), 67 (2) | 258 | Dihydroxybenzoic acid |
| 2 | 44.02 | 353 | 179 (100), 173 (10), 135 (20) | 324 | Cis-4-CQA |
| 3 | 44.67 | 353 | 191 (100), 179 (5) | 325 | 4-CQA |
| 4 | 47.85 | 353 | 191 (100), 179 (80), 135 (10) | 325 | 3-CQA |
| 5 | 56.48 | 353 | 191 (100), 179 (5), 135 (2) | 325 | 5-CQA |
| 6 | 61.90 | 367 | 193 (100), 191 (2) | 324 | 3-FQA |
| 7 | 70.20 | 337 | 173 (100), 163 (15) | 324 | 4-pCoQA |
| 8 | 72.77 | 367 | 191 (100), 173 (2) | 324 | 5-FQA |
| 9 | 74.60 | 367 | 173 (100), 191 (15) | 324 | 4-FQA |
| 10 | 80.20 | 193 | 149 (100), 178 (30), 134 (15) | 292 | Ferulic acid |
| 11 | 94.88 | 515 | 353 (100), 335 (5), 299 (2), 255 (5), 203 (3), 173 (8) | 324 | 3,4-diCQA |
| 12 | 99.52 | 515 | 353 (100), 317 (2), 299 (20), 255 (2), 203 (20), 179 (5) | 330 | 1,4-diCQA |
| 13 | 104.80 | 529 | 367 (100), 335 (15), 349 (5) | 324 | CFQA-2 |
CFQA, caffeoyl-feruloylquinic acid; CQA, caffeoylquinic acid; FQA, feruloylquinic acid; pCoQA, p-coumaroylquinic acid.
Chromatographic and spectrophotometric data obtained by HPLC analysis of decaffeinated coffee fraction (MW < 3500 Da)
Then, using a calibration curve prepared using standard solutions of caffeine and 5-caffeoylquinic acid in a concentration range between 50 and 250 μg/mL [22], the quantification of the chlorogenic acid derivatives, expressed as the 5-caffeoylquinic acid and caffeine occurring in the samples, was carried out. The total amount of chlorogenic acids in the regular coffee were found to be 236 mg/g of the lyophilized fraction (MW < 3500 Da) whereas their concentration in decaffeinated coffee was found to be 270 mg/g. The concentrations of caffeine were 52 and 1.7 mg/g in freeze-dried regular and decaffeinated coffee fractions, respectively Table 3.
| Coffee fraction | Chlorogenic acid derivatives (mg of 5-caffeoylquinic acid equivalents/g) | Caffeine (mg/g) |
|---|---|---|
| Regular | 236 | 52 |
| Decaffeinated | 270 | 1.7 |
Quantification of chlorogenic acid derivatives, expressed as 5-caffeoylquinic acid and caffeine in lyophilized coffee fractions (MW < 3500 Da)
2.2. Real-Time PCR of miRNA and mRNA
Once their composition was determined, the freeze-dried fractions were mixed into the mouse bolus (0.2% w/w). The coffee supplementation dose was chosen to mimic a moderate coffee consumption in humans (about three cups/day). More specifically, coffee dry residues were 8.70 and 11.25 g/1000 mL, for decaffeinated and regular coffee, respectively. The average consumption of coffee was considered to be three cups a day (300 mL/day of coffee obtained with the infusion method). So, the daily consumption ranges from 2610 mg/day (for decaffeinated coffee) to 3375 mg/day (for regular coffee). The human equivalent dose (HED) ranges from 37 to 48 mg/kg, for a 70 kg person. The extrapolation of the animal dose to a human dose was performed through normalization to body surface area (BSA) using the following formula:
In this way, the animal doses should range from 460 to 594 mg/kg. The average body weight of a C57BL/6 male mouse (8 weeks of age) is 22 g [24]. Therefore, the daily intake of coffee should range from 10.12 to 13.07 mg. In our experimental conditions, mice received a daily coffee fraction intake of 10 mg [5 g of pellet/day/mouse containing 0.2% (w/w) of coffee fraction], lower than those corresponding to a moderate regular coffee consumption. As far as bioactive components are concerned, mice receiving the regular coffee fraction-enriched diet, received about 2.36 mg of chlorogenic acids and 0.52 of caffeine, whereas mice treated with the decaffeinated coffee fraction-enriched diet took a similar amount of chlorogenic acids (2.70 mg) and 0.017 mg of caffeine.
Mice were finally culled for the collection of their blood, from which RNA was extracted for the final qPCR. First of all, the expression levels of miR-124-3p were evaluated. A significant decrease in miR-124-3p was detected in mice fed with regular coffee compared with the other two groups (p < 0.01) (Figure 2). This miRNA targets the mRNA coding for GPX enzyme, involved in the maintenance of the redox equilibrium in the cell. Consequently, a reduction in miR-124-3p could suggest a possible antioxidant effect for regular coffee.
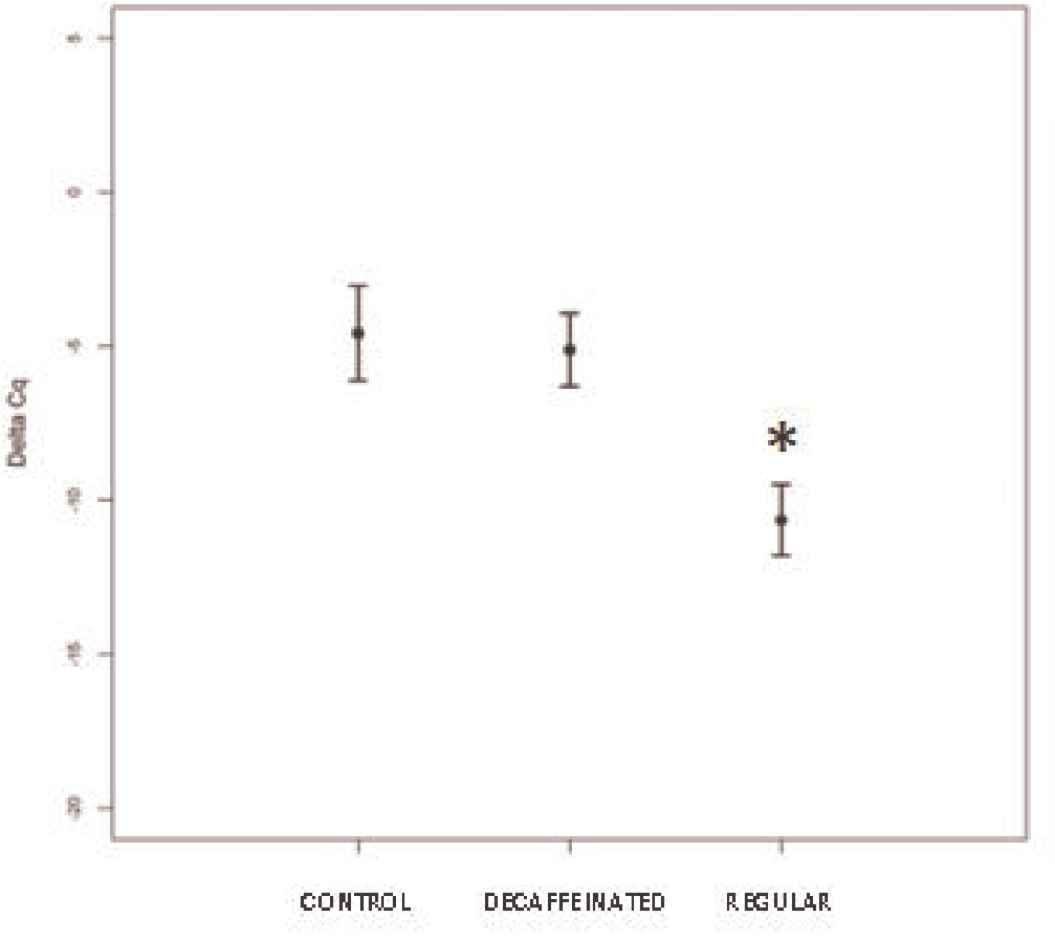
Expression levels of miR-124-3p are given in terms of ΔCq in rats fed with bolus enriched with decaffeinated coffee extract (MW < 3500 Da) or regular coffee extract, compared with the control group. Statistical analysis reveals a significant reduction of miR-124-3p levels following daily assumption of regular coffee (p < 0.01).
To further confirm this last hypothesis, the expression levels of GPX mRNA were defined by qPCR. Our results indicate a significant increase in this mRNA in the group fed with regular coffee compared with the control (p < 0.01), whereas no significant differences were found for the decaffeinated coffee, in accordance with the variation of miR-124-3p described earlier Figure 3.
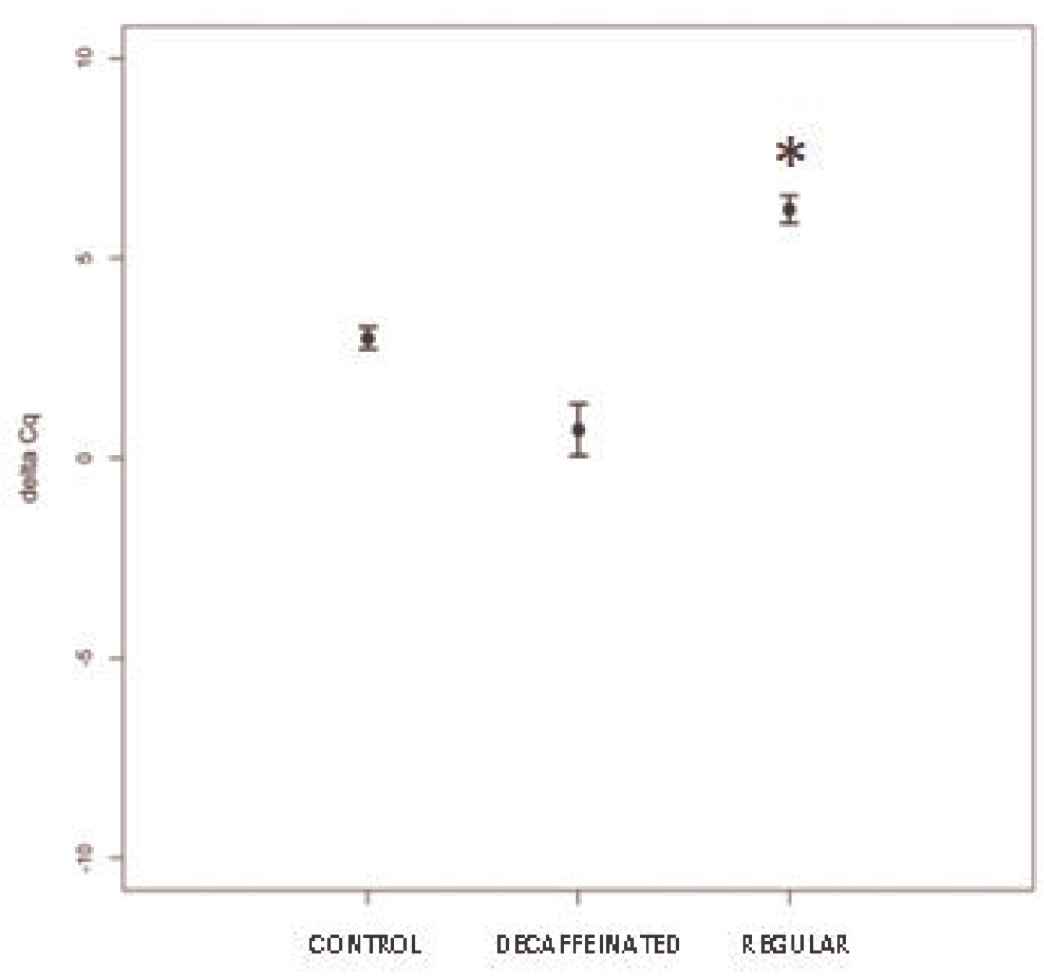
Expression levels of GPX mRNA are presented in terms of ΔCq in rats fed with bolus enriched with regular coffee extract (MW < 3500 Da) is significantly increased compared with the control group (p < 0.01).
3. DISCUSSION
To the best of our knowledge, this is the first study on the in vivo antioxidant effects mediated by an epigenetic mechanism in healthy mice fed with a diet supplemented with a low-MW coffee fractions obtained from decaffeinated or regular coffee beverage. The regular coffee fraction was found to decrease the expression levels of miR-124-3p, and increase the expression levels of mRNA, validated target of miR-124-3p coding for GPX, one of the most important endogenous antioxidant defenses because of its enzymatic removal of oxygen peroxide. These findings could be considered an explanation for the literature data showing that GPX (and other enzymes involved in glutathione synthesis) was significantly increased in mice treated with coffee extracts under physiological conditions (for 10 days by oral gavage at the dose of 300 mg/kg body weight) [25].
It is noteworthy to underline that the expression levels of the selected miRNA and mRNA were found to be insignificantly different from the control, following the intake of the low-MW decaffeinated coffee fraction, containing about the same amount of chlorogenic acid derivatives. These results suggest that caffeine may play a role and may be considered responsible for the in vivo modulation of miR-124-3p expression levels registered after the treatment of mice with regular coffee.
The antioxidant activity of caffeine has long been a topic of investigation. In vitro studies have shown that caffeine exerts an antiradical activity, mainly ascribed to scavenging properties toward the OH· radical [25]. Prasanthi et al. [26] showed that caffeine (30 mg/die, 12 weeks) reduced ROS levels and reverted glutathione depletion in rabbits treated with a cholesterol-enriched diet. More recently, a clinical trial carried out by Metro et al. showed that the ingestion of pure caffeine, in 15 healthy volunteers, was found to improve plasma levels of antioxidant markers after a 7-day treatment period. Total antioxidant capacity, glutathione, oxidized glutathione, glutathione/oxidized glutathione ratio, lipid hydroperoxides, and malondialdehyde, all considered indicators of oxidative status, were found to have improved from measurements taken prior to administration of caffeine, changing from −41% for oxidized glutathione to −70% for lipid hydroperoxides levels, and +106% for glutathione levels to +249% for the glutathione: oxidized glutathione ratio. These results were taken on a dose of 5 mg/kg body weight/die, corresponding in mice to 61.6 mg/kg body weight/die, using the same formula mentioned above (Animal dose = Human Equivalent Dose × Human Km/Animal Km) [27].
In our study, we registered antioxidant activity at a caffeine dose three times lower (20.8 mg/kg body weight, estimating a mean mouse weight of 25 g) than that used in the Metro et al. study.
Our study suggests that it is important to continue investigating the effects of regular coffee on miRNA expression involved in antioxidant defenses to better understand its functional properties and their underlying molecular mechanisms of action.
Finally, these findings, despite being promising, should be confirmed in humans. In fact, more studies are required to confirm the epigenetic effects of coffee in humans and the possible involvement of caffeine in epigenetic mechanisms.
4. MATERIALS AND METHODS
4.1. Sample Preparation
Two coffee samples of C. canephora var. Robusta (Parchment AB) grown in India, regular and decaffeinated, were toasted in a pilot coffee roaster with a capacity of 2 kg. The roasting process was performed at a temperature range of 170–180°C for 9–10 min. Both samples were characterized as medium roaster grade in relation to the weight lost after the roasting procedure, which was 14.50% for the regular and 16.85% for the decaffeinated samples.
4.1.1. Beverage preparation
The coffee beverages were prepared following a widely validated protocol as described by Daglia et al. [22]. Briefly, aliquots of 2500 mL Millipore Grade water were brought to the boiling point following the addition of 15 g of coffee powder. The solutions were maintained under agitation for 15 min during the boiling procedure, and the final solutions were filtered using 47 mm nitrocellulose filters (0.45 μm), then frozen to be subsequently fractionated.
4.1.2. Coffee fraction preparation
To obtain a coffee fraction with high polyphenol content, dialysis was conducted using a cellulose ester membrane SPECTRA/por (Biotech) with a molecular cut-off of 3500 Da. Twelve different aliquots of 200 mL were submitted to dialysis in 5000 mL Millipore Grade water for 24 h at 4°C. The dialysate (MW < 3500 Da) was first brought to the initial volume using a rotary evaporator. The process was performed in the dark at temperatures below 30°C. Following this procedure, the entire solution was freeze dried and the residue was weighed; 21.313 g (yield %: 14.21) of dialysate were obtained from the decaffeinated and 26.946 g (yield %: 17.96) from the regular coffee. The freeze-dried samples were subsequently analyzed with the HPLC–DAD–ESI–MSn method and used to prepare pellets for the mouse feeding.
4.2. HPLC–PAD–ESI–MSn Analysis
The analyses were conducted using a Termo Finnigan Surveyor Plus HPLC system equipped with a quaternary pump, one Surveyor UV–Vis PDA and one trap ionic mass LCQ Advantage Max Spectrophotometer (Thermo Fisher Scientific, Waltham, MA, USA) through an ESI source. The separation was performed using a chromatographic column AERIS PEPTIDE 3.6 μm XB (C18 250 × 4.6 mm2 i.d., 3.6 μm) with an Ultra Cartridge C-18 Peptide Security Guard Column (4.6, i.d.) (Phoenomenex, Torrance, CA, USA). The mobile phases used for the study were Millipore Grade HPLC water acidified at 0.1% with formic acid (eluent A) and acetonitrile (eluent B) Table 4. The flow rate was set at 3 mL/min for a total of 180 min for each run, the volume of the injection was 10 μL. To preserve all the samples the autosampler was maintained at 4°C, and the temperature of the column during the analysis was set at 25°C. All the chromatograms were registered between 324 and 270 nm and the spectra were obtained in the range 200–800 nm. The ionic trap operated in the data dependent and full scan (1000–2000 m/z) setting, and a collision energy of 35% was applied to obtain the desired fragmentation. The ESI source parameters, based on negative ion revelation, were set during a previous analysis using chlorogenic acid at a concentration of 100 ppm dissolved in a 30:70 v/v solution of methanol and acid water at 0.1%. The voltage of the ion trap was set at 4.52 kV with 19.48 arbitrary units of sheath gas flow rate and 49 arbitrary units of auxiliary gas flow rate; the capillary temperature was set to 200°C.
| Time (min) | Eluent A (%) | Eluent B (%) |
|---|---|---|
| 0 | 97 | 3 |
| 90 | 70 | 30 |
| 100 | 3 | 97 |
| 110 | 3 | 97 |
| 130 | 97 | 3 |
Gradient elution used during HPLC–DAD–ESI/MS analysis
4.3. Animals
For this study 36 wild-type C57BL/6 mice (Charles River Laboratories, Wilmington, Massachusetts, United States) were used. The experimental animals were subdivided into two mice/cage at 20–22°C with 12–12 h light–dark cycle. All the animals were kept with food and water ad libitum for 1 week before the start of the treatment, according to the “Guide for Care and Use of Laboratory Animals.” The current research was endorsed by the Pavia University Ethic Committee, according to the European law (n. 86/609/CEE) and the Italian law (n. 116/92, 8/94). At the age of 8 weeks the mice were divided into three groups and fed with three different diets. The control group (CTRL) was fed a normal diet, while the treated ones were fed with the normal diet supplemented with the low-MW fractions obtained from the decaffeinated and regular coffee at 0.2% (w/w) Table 5. After 8 weeks of supplementation, all the animals were culled with sodium thiopental (200 mg/kg IP) and blood samples were collected on beating heart.
| Experimental feed components (%) | S1120-E078 | S1120-E070/-E075 | |
|---|---|---|---|
| AIN mod. control | AIN & compound | ||
| Casein | 20.000 | 20.000 | |
| Wheat starch | 62.950 | 62.750 | |
| Cellulose | 5.000 | 5.000 | |
| 0.300 | 0.300 | ||
| Vitamins AIN mod. | 1.000 | 1.000 | |
| Mineral Premix AIN mod. | 3.500 | 3.500 | |
| Choline Cl | 0.250 | 0.250 | |
| Caffeine/Decaffeinated Coffee | – | 0.200 | |
| Corn oil | 7.000 | 7.000 | |
| Protein | 17.6 | 17.6 | |
| Fat | 7.1 | 7.1 | |
| Fiber | 5.0 | 5.0 | |
| Ash | 3.1 | 3.1 | |
| Sugar | 1.2 | 1.2 | |
| Starch | 57.9 | 57.7 | |
| Calcium | 0.56 | 0.56 | |
| Phosphorus | 0.37 | 0.37 | |
| Sodium | 0.17 | 0.17 | |
| Magnesium | 0.10 | 0.10 | |
| Potassium | 0.55 | 0.55 | |
| Fatty acid (% in the diet) | |||
| C14:0 | 0.01 | 0.01 | |
| C16:0 | 0.80 | 0.80 | |
| C18:0 | 0.14 | 0.14 | |
| C18:1 | 1.83 | 1.83 | |
| C18:2 | 3.87 | 3.87 | |
| C18:3 | 0.07 | 0.07 | |
| ME (At water) | MJ/kg | 15.6 | 15.6 |
| Kcal/kg | 3727 | 3727 | |
| Protein | Kcal% | 19 | 19 |
| Fat | Kcal% | 17 | 17 |
| Carbohydrates | Kcal% | 64 | 64 |
Reports the feed composition used for the mice diet. The first column displays the composition of the standard feed and the second the composition of standard feed with the addition of decaffeinated and regular freeze-dried coffee
4.4. RNA Extraction and Real-Time PCR of miRNA and mRNA
The total RNA was extracted from blood samples using the miRNeasy Mini kit (Qiagen, Hilden, Germany), following the procedure outlined by the manufacturers. The quality of the RNA was evaluated though electrophoresis in denaturant conditions on agarose gel 1.2%. The quantitative analysis of RNA was evaluated through the fluorimetric method using a Qubit R (Invitrogen, CA, Grand Island, NY, USA) with the Quan-iT RNA assay, according to the manufacturer’s procedure. To detail, an aliquot of 2 μL of RNA was added to 198 μL of the working solution, obtained by mixing 1 μL of Qubit reagent with 199 μL of Qubit RNA buffer for each sample. After quantification, retrotranscription process was performed using the miRCURY LNA TM Universal RT micro RNA PCR kit. The retrotranscription protocol required the preparation of a mix made up of 4 μL of total RNA (5 ng/μL), 4 μL of 5× reaction buffer, 2 μL of enzyme mix, 1 μL of synthetic spike, and 9 μL of nuclease free water. The PCR reaction occurred in a total volume of 10 μL containing 4 μL of diluted cDNA (1:80), and 5 μL of SYBR, using the following reaction conditions: 1 cycle at 95°C for 10 min, 45 cycles of amplification at 95°C for 10 s, followed by a cycle of 60°C for 1 min. The endogenous control selected to normalize the miRNA expression levels in this study was the small nuclear RNA U6 (snU6). Every assay was conducted in triplicate and the levels of the relative expression of the miRNA were calculated using the 2−ΔΔCq method. The instrument used in the experiment was the Eco TM Real-Time PCR. For the study of mRNA levels, the SYBR Premix Ex Taq (Tli RNaseH Plus, Takara, Saint-Germain-en-Laye, France) kit was used, according to the instructions reported in the product manual. For the analysis of mRNA levels, the primers were designed using the Primer-BLAST software and were the following:
GPX4:
forward → 5′-CCCATTCCTGAACCTTTCAA-3′
reverse → 5′-GCACACGAAACCCCTGTACT-3′
Glyceraldehyde 3-phosphate dehydrogenase was used as an endogenous control to determine relative mRNA expression.
GADPH:
forward → 5′-GTGTTTCCTCGTCCCGTAGA-3′
reverse → 5′-TTCCCATTCTCGGCCTTGAC-3′
4.5. Statistical Analysis
The Cq values were analyzed using the R software (ver. 3.0.3, R Core Team, New Jersey, United States, 2014). The difference between the means of the different treatment groups were estimated using the one-way ANOVA followed by the post-hoc Tukey’s test. Only the values with a p < 0.05 were considered to be significant.
CONFLICTS OF INTEREST
The authors declare they have no conflicts of interest.
AUTHORS’ CONTRIBUTION
MD and MD contributed in conceptualization. VC, MV, MD, IM and MD contributed in data curation. VC and MV contributed in formal analysis. MD and MD contributed in investigation. VC, MV and MD contributed in methodology. MD and MD contributed in project administration and supervision. VC contributed in validation. AB, MD, IM and MD contributed in writing – original draft. AB and MD contributed in writing – review and editing.
ABBREVIATIONS
- MW,
molecular weight;
- tHODE,
total hydroxyoctadecadienoic acid;
- LPS,
lipopolysaccharide;
- GPX,
glutathione peroxidase;
- CpG,
cytosine–phosphate–guanine;
- KRAS,
Kristen rat sarcoma oncogene;
- BaP,
benzo[α]pyrene;
- UGT1A,
UDP-glucuronosyltransferase 1 family, polypeptide A cluster;
- HED,
human equivalent dose;
- BSA,
body surface area;
- GADPH,
glyceraldehyde 3-phosphate dehydrogenase.
Footnotes
REFERENCES
Cite this article
TY  - JOUR
AU  - Valeria Curti
AU  - Manuela Verri
AU  - Alessandra Baldi
AU  - Marco Dacrema
AU  - Irene Masiello
AU  - Maurizia Dossena
AU  - Maria Daglia
PY  - 2019
DA  - 2019/08/23
TI  - In vivo Modulatory Effect of Coffee (Coffea canephora var. Robusta) on the Expression Levels of Murine microRNA-124-3p Associated with Antioxidant Defenses
JO  - eFood
SP  - 140
EP  - 146
VL  - 1
IS  - 2
SN  - 2666-3066
UR  - https://doi.org/10.2991/efood.k.190802.001
DO  - 10.2991/efood.k.190802.001
ID  - Curti2019
ER  -