
Xanthine Oxidase Inhibitors Screening, Antioxidation, and DNA Protection Properties of Geranium wilfordii Maxim
Yi Liu and Shiyong Mei contributed equally to this work.
- DOI
- 10.2991/efood.k.190802.004How to use a DOI?
- Keywords
- Antioxidation; DNA damage; DPPH spiking; inhibitor; ultrafiltration; xanthine oxidase
- Abstract
Geranium wilfordii Maxim is a commonly used traditional medicine and as decoction pieces in drinks for treating acute and chronic rheumatalgia. Earlier research showed it could inhibit xanthine oxidase and had a strong antioxidative activity. In this study, four compounds namely, corilagin, geraniin, ellagic acid, and myricetrin were screened and identified as xanthine oxidase inhibitors and antioxidants using ultrafiltration combined liquid chromatography–mass spectrometry (LC–MS) and 1,1-diphenyl-2-picrylhydrazyl (DPPH) spiking combined LC–MS methods. Ellagic acid showed the greatest inhibition with IC50 of 0.018 ± 0.001 mM better than that of allopurinol. The kinetic parameters exhibited the mode of xanthine oxidase inhibitions by corilagin, geraniin, and myricetrin were the competitive types, whereas the ellagic acid was found as an uncompetitive inhibitor. In vitro DNA nicking assay showed these four compounds protected DNA from reactive oxygen species. Correlation analysis and partial least squares analysis showed there was a moderate correlation between ellagic acid and DPPH˙ scavenging activity. Our findings revealed four compounds in G. wilfordii Maxim contributed satisfied radicals scavenging, xanthine oxidase inhibition, and DNA damage protective activities. More comprehensive research on pharmaceutical applications and phytochemical profile of G. wilfordii Maxim could be further studied.
- Copyright
- © 2019 International Association of Dietetic Nutrition and Safety. Publishing services by Atlantis Press International B.V.
- Open Access
- This is an open access article distributed under the CC BY-NC 4.0 license (http://creativecommons.org/licenses/by-nc/4.0/).
1. INTRODUCTION
Geranium wilfordii Maxim is one of the most commonly used traditional Chinese medicines and decoction pieces used in daily drinks for treatment of acute and chronic rheumatalgia as well as enteritis [1]. Several recent studies showed that G. wilfordii Maxim contains flavonol glycosides, flavonoids, and hydrolyzable tannins. And the extracts of G. wilfordii Maxim were reported to have antihyperglycemic, antioxidant, anti-inflammatory, and antitumor activities. Corilagin and geraniin are the main components in G. wilfordii Maxim and reported as antioxidants [2,3]. Because of these functions, many decoction pieces and drinking products containing G. wilfordii Maxim were sold in markets, and people believed they would get health benefits by drinking them. However, there is only limited information available on the detailed composition of G. wilfordii Maxim. Earlier research in our lab also demonstrated that the ethanol extract of G. wilfordii Maxim could effectively inhibit xanthine oxidase and exhibit strong antioxidation activity. Further systematical research on G. wilfordii Maxim to elucidate the molecular mechanisms underlying its efficacy was needed.
As a complex molybdoflavoenzyme widely distributed in mammalian tissues, xanthine oxidase catalyzed the oxidation of hypoxanthine to xanthine and then to uric acid [4]. It was an important enzyme in the pathogenesis of hyperuricemia and Reactive Oxygen Species (ROS) [5]. Hyperuricemia could lead to gout as a result of the deposition of urate monohydrate crystals mainly around joints and kidneys [6,7]. Xanthine oxidase also played a crucial role in various forms of ischemic and other types of tissue and vascular injuries, inflammatory diseases, and chronic heart failure [8]. Xanthine oxidase inhibitors including allopurinol and febuxostat were commonly used in therapies against gout and hyperuricemia [9]. However, their use was limited due to adverse effects such as nephropathic reactions. The research for novel xanthine oxidase inhibitors from natural resources is in demand [10].
Reactive oxygen species was a family of free radicals containing an unpaired electron, which was generated from oxygen and other highly reactive forms of oxygen such as hydrogen peroxide, superoxide anion radical, and singlet oxygen. It has harmful effects on the human body [11,12]. High level of ROS was associated with oxidative stress that damages cell structures and triggers DNA mutations, lipid oxidation, and peroxidation of proteins [13,14]. The cumulative DNA damage caused by ROS, by-products of oxidative phosphorylation, was a key factor contributing to cell aging and predisposing to neoplastic transformation [15]. Furthermore, DNA oxidative damage might lead to genetic mutation, increase the possibility of mutagenicity and cause the expansion of cancer [16,17]. Many antioxidants such as polyphenols and flavonoids from herbs were reported to have antioxidant activity and showed defense against oxidative stress [18].
In this study, both xanthine oxidase inhibitors and antioxidants from G. wilfordii Maxim were screened and identified using ultrafiltration combined with liquid chromatography–mass spectrometry (LC–MS) and 1,1-diphenyl-2-picrylhydrazyl (DPPH) spiking LC–MS. After identification, the inhibition and antioxidation activities of screened bioactive compounds were verified and the kinetic parameters concerning inhibition on xanthine oxidase were proceeded. Moreover, the evaluations of antioxidant capacities for bioactive compounds were conducted by in vitro chemical scavenging assays and DNA nicking assays. Compared with in vitro chemical assays, in vitro DNA nicking assays are more biologically relevant and faster to screen potential in vivo antioxidant substances [19]. Based on the Fenton reaction, the DNA nicking assay mimics the in vivo biological situation, with the production of hydroxyl free radicals from endogenous entities such as intracellular iron. Finally, to evaluate the correlation between the breeds and bioactivities, the amounts of screened bioactive compounds as well as the related bioactivities in 20 G. wilfordii Maxim samples obtained in five provinces of China were determined.
2. EXPERIMENTAL
2.1. Reagents and Materials
Twenty G. wilfordii Maxim samples were bought from pharmacies in Anhui, Yunnan, Hebei, and Henan province. Especially, the G. wilfordii Maxim sample used for screening, antioxidation, and further analyses was bought in Bozhou city, Anhui province. Xanthine oxidase freeze-dried powder was purchased from Yuanye Biotechnology Co. (Shanghai, China). Geraniin, myricetrin, corilagin, and ellagic acid were gained from Alfa Aesar (Thermo Fisher Scientific, MA, USA). Acetic acid and Acetonitrile in HPLC grade, DPPH and 2,2′-azinobis-(3-ethylbenzthiazoline-6-sulphonate) (ABTS) were bought from Merck KGaA (Darmstadt, Germany). Ultrapure water (18.2 MΩ·cm resistivity) was obtained from an ELGA water purification system (ELGA Berkefeld, Veolia, Germany). All other reagents were purchased from Sinopharm Chemical Reagent Co., Ltd. (Shanghai, China) and were of analytical grade, unless otherwise stated.
2.2. Preparation of G. wilfordii Extract
About 10.0 g of G. wilfordii samples were transferred into a conical flask containing 100 ml of 90% ethanol solution (v/v, 90:10). The solution was extracted for 4 min in a microwave oven at 60% power. After extraction three times, the solvents were combined and evaporated with rotary evaporator under vacuum. Finally, 1.18 g of residue was redissolved in water and stored at 4°C for further use.
2.3. Screening of Xanthine Oxidase Inhibitors using Ultrafiltration
The screening was conducted using ultrafiltration according to our previous reports with some modifications [20]. About 200 μl of xanthine oxidase solution (1.0 mg/ml) and 200 μl of G. wilfordii extract (50 mg/ml) were mixed in a tube and shaken at 30°C for 30 min with a thermostatic oscillator. After incubation, the mixture was transferred into a centrifugal filter (YM-30, the molecular weight cut-off of 10 kDa) and centrifuged at 13,000 rpm for 20 min at 4°C (Beckman Coulter Allegra 64R, Brea, CA, USA). The filtrate was collected for further analysis and the inhibitors bound to enzyme were retained by a membrane. About 400 μl of buffer solution was added into the filter and the filter was centrifuged in the same conditions for the second time. Then, the filtrate was decanted and another 200 μl of 80% methanol solution was added into the filter. The filter was centrifuged at 13,000 rpm for 20 min at 4°C to elute bound inhibitors from enzymes and the filtrate named as eluent was collected for analysis. The control experiment was performed under the same condition with denatured enzyme after high temperature processing as a substitution.
2.4. Screening of Antioxidants using DPPH Spiking
The DPPH spiking was applied to screen active antioxidants in G. wilfordii extract according to an earlier report with some modifications [21]. Briefly, 0.1 ml of G. wilfordii extract (50 mg/ml) was mixed with 1.0 ml DPPH in methanol (2.0 mM) and incubated for 10 min in the dark. After reaction, the mixture was filtrated through a 0.45 μm filter and subjected to HPLC analysis.
2.5. HPLC and HPLC–MS Analyses
The qualitative and quantitative analyses of screening was achieved by HPLC–MS analysis on an Agilent 1260 HPLC combined Agilent 6460 Triple Quadrupole LC–MS system (Agilent Technologies Inc., Santa Clara, CA, USA). The HPLC separation was completed using a C18 reverse phase column (Waters Xbridge™, 250 × 4.6 mm2 i.d., 5 μm, Milford, MA, USA). A gradient elution program consisting of two mobile phases (A: water containing 0.1% acetic acid and B: acetonitrile) was used as follows: 0–5 min, 10% B; 5–35 min, 10–25% B. The flow rate was set at 0.8 ml/min and the column temperature was set at 25°C. The chromatogram was recorded at 254 nm. For mass spectrometry analysis, the electron spray ionization interface was used in both positive and negative ionization modes. The mass detection mode was set at full-scan mode from 100 to 1000 m/z.
2.6. Analyses of Screened Inhibitors
2.6.1. Xanthine oxidase inhibition assay
Xanthine oxidase activity and inhibition assay were performed spectrophotometrically. About 20 μl of xanthine oxidase solution (1 mg/ml in buffer solution) and 1 ml of water were mixed in a quartz cuvette (1.0 cm). Then, 1 ml of xanthine solution (1 mg/ml) was added to start the reaction, and the cuvette was rapidly moved into an UV–Vis Spectrophotometer (UV2700, Shimadzu, Kyoto, Japan). The increase of absorbance at 295 nm in 100 s was monitored.
For inhibition test, 20 μl of xanthine oxidase solution and 1 ml of sample with different concentrations were mixed in a quartz cuvette. Then, 1 ml of xanthine solution (1 mg/ml) was added to start reaction and the increase of absorbance at 295 nm in 100 s was recorded. Allopurinol was used as a positive control. Inhibition of xanthine oxidase was calculated by the following formula (1):
2.6.2. Determination of the kinetic parameters
Lineweaver–Burk and Dixon plot analyses were performed to determine inhibition mode, inhibition mechanism, and kinetic parameters for the enzymatic reaction with these four inhibitors. The kinetics were measured using increasing concentrations of xanthine as a substrate and various concentrations of inhibitors with 1.0 μM fixed xanthine oxidase concentration. Enzymic reaction was performed as described earlier in Subsection 2.6.1. The maximum reaction rate (Vmax) and the Michaelis–Menten constant (Km) were calculated by the double-reciprocal plot using the following formula (2):
2.7. Antioxidation Analysis
2.7.1. DPPH assay
The DPPH˙ scavenging test was measured according to the reported method with some modifications [22]. About 1.0 ml of sample with different concentrations was mixed thoroughly with 2 ml of DPPH working solution (0.05 mg/ml in methanol). The mixture was then kept in dark for 5 min. Finally, the absorbance of resultant solution was measured by a UV–Vis spectrophotometer at 517 nm. The same amount of ultrapure water was used as control. The scavenging activity of DPPH˙ was calculated by the following formula (3):
2.7.2. ABTS assay
The ABTS˙ scavenging activity test was measured using a procedure described earlier [23]. ABTS stock solution (7 mM) was mixed with 2.45 mM potassium persulfate solution (equal volume) and incubated for 12 h and diluted for use. About 1.0 ml of samples with different concentrations was mixed thoroughly with 2 ml of ABTS working solution. The mixture was then kept in the dark for 6 min. Finally, the absorbance of resultant solution was measured by a UV–Vis spectrophotometer at 734 nm. The same amount of ultrapure water was used as control and all experiments were performed in triplicate. The ABTS˙ scavenging activity of sample was calculated using the following formula (4):
2.8. DNA Nicking Assay
The DNA damage protective activity of inhibitors was evaluated using the modified method of Rathi Velusamy [12], which was performed using pUC19 DNA. Plasmid was isolated by the E.Z.N.A.® Plasmid mini kit (Omega Bio-Tek, Inc., Norcross, GA, USA). A mixture of 10 μl of sample and plasmid DNA (391.0 ng/μl) was incubated for 10 min at room temperature followed by the addition of 8 μl of Fenton’s reagent (30 mM H2O2, 50 mM ascorbic acid, and 80 mM of FeCl3). The final volume of mixture was made up to 20 μl and incubated for 30 min at 37°C. The DNA was analyzed on 1% agarose gel with Goldview staining and photographed in Geldoc 2000 system (Bio-Rad Laboratories, CA, USA). Quercetin (50 mM) was used as a positive control.
2.9. Statistical Analysis
The results were reported as mean values of three analyses along with the standard deviation. Data were subjected to statistical analysis using the SPSS program (SPSS 22.0, Chicago, IL, USA). The one-way analysis of variance followed by Duncan’s multiple range test was used to study the significance of differences between means. Values of p < 0.05 were considered statistically significant.
3. RESULTS AND DISCUSSION
3.1. Screening of Xanthine Oxidase Inhibitors and Antioxidants
To optimize the chromatographic conditions for analysis of G. wilfordii Maxim extract, different gradient elution programs, column temperatures, ratio of acid content, flow rates, injection volume, and detection wavelength were all tested. Finally, the HPLC analysis was achieved in 35 min with satisfied separation of main peaks and well presentation of peak shape. The chromatogram of G. wilfordii Maxim extract is shown in Figure 1a.
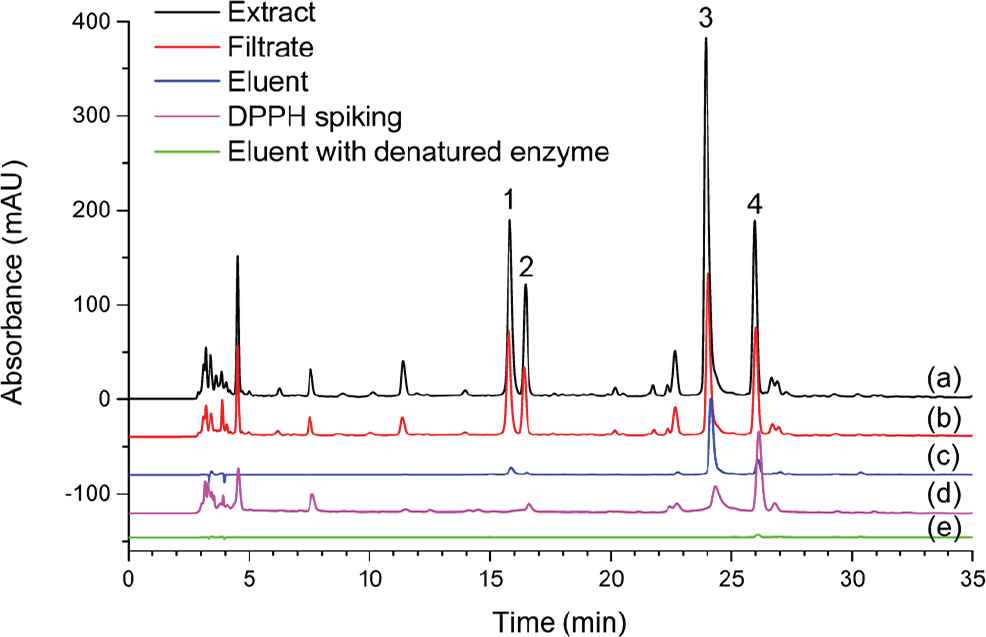
HPLC chromatograms of (a) Geranium wilfordii extract, (b) filtrate after ultrafiltration, (c) eluent after elution, (d) G. wilfordii extract after DPPH spiking, and (e) eluent with denatured enzyme. Four screened peaks were marked with numbers (1–4).
According to our previous inhibition test, the extract of G. wilfordii Maxim showed an apparent inhibition with IC50 value of 0.905 μg/ml, which indicated that it contains xanthine oxidase inhibitors and the screening and analysis of xanthine oxidase inhibitor were worthwhile. During ultrafiltration screening, the extract was incubated with xanthine oxidase to form protein–ligand complexes. As the holes of the membrane were smaller than xanthine oxidase molecules, the enzyme was retained by membrane together with binding ligands after ultrafiltration. Through the analysis of the filtrate, the peaks with reduced peak areas could be considered as ligands (potential inhibitors) [20]. The chromatogram of the filtrate after ultrafiltration is shown in Figure 1b, the peak areas of four main peaks marked with numbers were reduced obviously. Moreover, the retained complexes were eluted by an organic solution and the ligands could be obtained in eluent. As shown in Figure 1c, four peaks at the same retention time could be observed in the chromatogram of the eluent after elution. The screening with denatured enzyme was conducted as well. The chromatogram of the eluent showed no peak appeared in a 35-min analysis (Figure 1e), which confirmed that four peaks marked with numbers were specifically bound to enzyme and further identification and analysis were needed.
As antioxidants in the sample were reacted with DPPH in a spiking experiment, the peak areas of antioxidants would decrease or disappear due to the oxidation of antioxidants. Meanwhile, the peak areas of other compounds were seldom changed [24]. Therefore, DPPH spiking analysis could screen the individual antioxidants from natural extracts. After screened by the ultrafiltration method, the four screened ligands were selected as the target compounds to investigate the antioxidation in the DPPH spiking experiment. The obvious reduction of peak areas of four bioactive ligands was observed in the chromatogram G. wilfordii extract after DPPH spiking (Figure 1d). As a consequence, compounds with four peaks marked with numbers could be considered as potential antioxidants, and further identification antioxidation analysis were proceeded.
3.2. Identification of Screened Compounds
After the screening of xanthine oxidase inhibitors from G. wilfordii Maxim extract, HPLC–MS was applied for their structural identification and the related MS and UV data were shown in Table 1. Compounds 1 and 2 exhibited two absorbance bands at 220 and 270 nm, respectively. In the negative ion mode of MS analysis, compounds 1 and 2 showed the deprotonated molecular ion [M − H]− at 633 and 951 m/z, respectively. This information was in accordance with the UV absorbance of tannic acid and the molecular weights of corilagin and geraniin. Based on the reported UV and MS values, compounds 1 and 2 were identified as corilagin (1) and geraniin (2). Compound 3 exhibited the deprotonated molecular ion [M − H]− at 301 m/z in the negative ion mode and the protonated molecular ion [M + H]+ at 303 m/z in the positive ion mode of MS analysis. The molecular weight of compound 3 was confirmed as 302. Based on an earlier report, the UV absorbance of compound 3 showed the same absorbance at 255 and 370 nm [25]. Therefore, compound 3 was considered as ellagic acid (3). Compound 4 exhibited the molecular ions [M − H]− at 463 m/z and [M + H]+ at 465 m/z in two ion modes, which were observed as well. The molecular weight of compound 4 could be confirmed as 464. Fragment ions at 319 and 303 m/z corresponded to the presence of rhamnose sugar and further loss of oxygen atom [26,27]. Based on these characteristic fragments in MS spectrum, compound 3 was characterized as myricetrin (4). In addition, according to former analyses and result of comparing the retention times and MS spectra of authentic references with those of samples, these four compounds were identified and verified as corilagin (1), geraniin (2), ellagic acid (3), and myricetrin (4).
| Peak | Rt (min) | UV (nm) | Fragment ion | m/z | Formula | Identification |
|---|---|---|---|---|---|---|
| 1 | 15.80 | 215, 265 | [M − H]− | 633 | C27H22O18 | Corilagin |
| 2 | 16.45 | 220, 275 | [M − H]− | 951 | C41H28O27 | Geraniin |
| 633 | ||||||
| 3 | 23.94 | 255, 370 | [M − H]− | 301 | C14H6O8 | Ellagic acid |
| [M + H]+ | 303 | |||||
| 4 | 25.97 | 260, 350 | [M − H]− | 463 | C21H20O12 | Myricetrin |
| [M + H]+ | 465 | |||||
| [M – Rha + H]+ | 319 | |||||
| [M − Rha − O + H]+ | 303 |
Identification of screened compounds in G. wilfordii extract by LC–MS
3.3. Verification of Inhibitory Activity
After screened xanthine oxidase inhibitors were identified, xanthine oxidase inhibitory activities were evaluated in vitro. The inhibition results are illustrated in Table 2 as IC50 values; and, the IC50 values of corilagin, geraniin, ellagic acid, and myricetrin on xanthine oxidase were 0.140 ± 0.002, 0.177 ± 0.006, 0.018 ± 0.001, and 0.103 ± 0.001 mM, respectively. As a higher IC50 value indicated lower inhibition activity, the ranks of the screened inhibitors in inhibiting activity from the highest to lowest were ellagic acid, myricetrin, geraniin, and corilagin. Considering allopurinol was a commonly used inhibitor for xanthine oxidase, it was used as a positive control, and the IC50 value of allopurinol was 0.052 ± 0.005 mM. Ellagic acid exhibited greater xanthine oxidase inhibitory activities than other inhibitors. The xanthine oxidase inhibition of four inhibitors could be supported by earlier reports. Corilagin and ellagic acids from Cunonia macrophylla were reported to show xanthine oxidase inhibition [28]. The xanthine oxidase inhibition geraniin in Geranium sibiricum Maxim were tested by Wu et al. [29], and the inhibition of myricetin was reported by Paul with IC50 2.38 ± 0.13 μM [30]. The inhibitory type and inhibition kinetics constants might help explaining the difference between their inhibitory activities.
| Compounds | IC50 (mM) | [C] (mM) | Km (mM) | Vmax (mmol/min) | Ki (mM) |
|---|---|---|---|---|---|
| Corilagin | 0.140 ± 0.002 | 0 | 0.147 ± 0.015 | 0.095 ± 0.004 | 0.037 |
| 0.033 | 0.197 ± 0.025 | 0.099 ± 0.008 | |||
| 0.040 | 0.241 ± 0.029 | 0.096 ± 0.008 | |||
| 0.047 | 0.344 ± 0.014 | 0.094 ± 0.002 | |||
| Geraniin | 0.177 ± 0.006 | 0 | 0.123 ± 0.002 | 0.076 ± 0.001 | 0.029 |
| 0.033 | 0.158 ± 0.005 | 0.075 ± 0.001 | |||
| 0.040 | 0.226 ± 0.008 | 0.074 ± 0.002 | |||
| 0.047 | 0.322 ± 0.021 | 0.076 ± 0.003 | |||
| Ellagic acid | 0.018 ± 0.001 | 0 | 0.071 ± 0.001 | 0.088 ± 0.001 | 0.017 |
| 0.009 | 0.055 ± 0.002 | 0.047 ± 0.001 | |||
| 0.018 | 0.037 ± 0.003 | 0.024 ± 0.001 | |||
| 0.022 | 0.029 ± 0.002 | 0.016 ± 0.001 | |||
| Myricetrin | 0.103 ± 0.001 | 0 | 0.163 ± 0.004 | 0.112 ± 0.001 | 0.020 |
| 0.033 | 0.327 ± 0.035 | 0.118 ± 0.007 | |||
| 0.040 | 0.344 ± 0.041 | 0.110 ± 0.008 | |||
| 0.047 | 0.531 ± 0.022 | 0.108 ± 0.005 |
Inhibition of corilagin, geraniin, ellagic acid, and myricetrin on xanthine oxidase and kinetic parameters of enzymatic reactions
3.4. Kinetics Studies
To investigate the type of enzyme inhibition and the inhibition constants (Ki) for each inhibitor, the activity was assayed with different concentrations of substrates (0.067, 0.133, and 0.267 mM) and different concentrations of inhibitors (0.033, 0.040, and 0.047 mM for corilagin, geraniin, and myricetrin; 0.009, 0.018, and 0.022 mM for ellagic acid). The Lineweaver–Burk plot analysis shown in Figure 2 indicate that the mode of xanthine oxidase inhibition by corilagin, geraniin, and myricetrin was of the competitive type (Figure 2a, 2c, and 2g). The competitive type inhibition means the Michaelis–Menten constant (Km) was found to be increased and the maximum reaction velocity (Vmax) remained unchanged. It illustrated that the occupation by inhibitor prevented substrate from connecting to the active site of enzyme. And the competitive inhibitors were similar to the substrate [4]. Lin et al. [31] reported the inhibitory effect of several flavonoids including myricetin on xanthine oxidase activity, and they all performed as competitive inhibitors, whereas the ellagic acid showed an uncompetitive-type inhibition, which meant both Km and Vmax constants decreased with increasing inhibitor concentrations (Figure 2e). The uncompetitive mode showed that ellagic acid performed the inhibition by forming an enzyme–substrate complex reversibly with weak interactions at a site other than the active site [32]. The Ki values derived from secondary plots (Figure 2b, 2d, 2f, and 2h) for corilagin, geraniin, ellagic acids, and myricetrin were 0.037, 0.029, 0.017, and 0.020 mM, respectively. A smaller value of inhibition constant indicated stronger inhibition and the inhibitor–enzyme binding affinity exceeded the enzyme–substrate binding affinity [33].
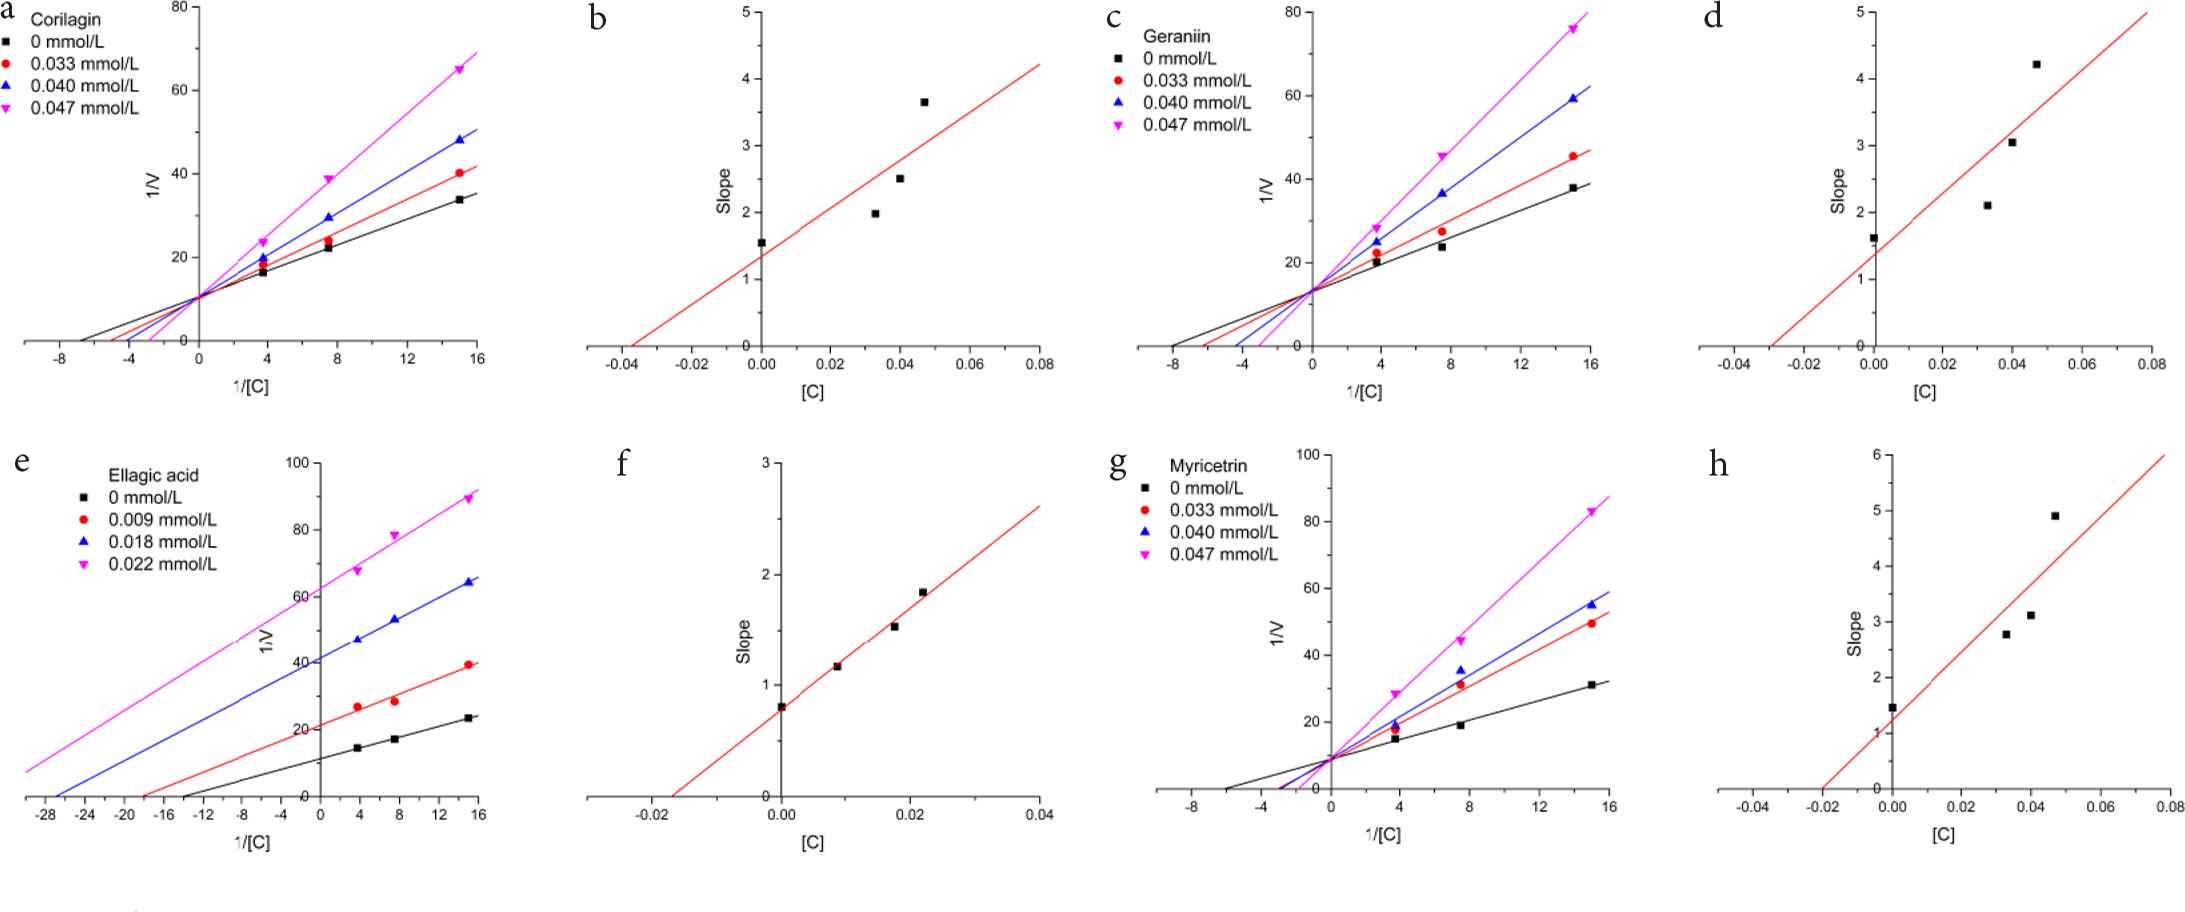
Lineweaver–Burk plots for inhibition of xanthine oxidase by (a) corilagin, (c) geraniin, (e) ellagic acid, and (g) myricetrin. Secondary plots of slopes against concentrations of (b) corilagin, (d) geraniin, (f) ellagic acid, and (h) myricetrin to calculate Ki. The concentrations were 0.033, 0.040, and 0.047 mmol/l for corilagin, geraniin, and myricetrin; 0.009, 0.018, and 0.022 mmol/l for ellagic acid.
3.5. Antioxidative Activity
Antioxidant activities of G. wilfordii Maxim extract and four inhibitors were determined by DPPH free radical scavenging and ABTS˙ scavenging. Radical scavenging activity was presented as EC50 values in Table 3. As can be seen from the table, the G. wilfordii Maxim extract and four inhibitors showed satisfied bioactivity in two tested systems. As ascorbic acid is a well-known antioxidant, it was used as the positive control. As a result, all four inhibitors showed lower EC50 values than that of ascorbic acid. In DPPH assay, the DPPH scavenging activity from the highest to lowest was geraniin (3.79 ± 0.05 μM), corilagin, ellagic acid, and myricetrin (16.52 ± 0.08 μM), whereas in ABTS assay, ABTS scavenging capacity from the highest to lowest was ellagic acid (5.52 ± 0.13 μM), corilagin, geraniin, and myricetrin (16.94 ± 0.21 μM). The antioxidative activities of these compounds were supported by many reports [34,35]. These results showed the screening of antioxidative activity using DPPH spiking was effective.
| Compounds | DPPH EC50 | ABTS EC50 |
|---|---|---|
| Extract | 29.57 ± 0.21 μg/ml | 14.53 ± 0.17 μg/ml |
| Corilagin | 5.60 ± 0.07 μM | 8.79 ± 0.04 μM |
| Geraniin | 3.79 ± 0.05 μM | 12.25 ± 0.13 μM |
| Ellagic acid | 12.04 ± 0.08 μM | 5.52 ± 0.13 μM |
| Myricetrin | 16.52 ± 0.08 μM | 16.94 ± 0.21 μM |
| Ascorbic acid | 21.40 ± 0.27 μM | 20.63 0 ± 0.10 μM |
DPPH and ABTS scavenging activities of samples
3.6. DNA Protection
Hydroxyl radical, one of the most damaging free radicals, could attack DNA and cause strand scission. In DNA nicking assay, pUC19 plasmid DNA was exposed to the Fenton reaction. The observed amounts of nicked and linear DNA in agarose gels in the presence or absence of active compounds could reveal the protection effect [36]. As shown in Figure 3, the normal plasmid DNA (lane 1) presented a clear super coiled form. However, the DNA incubation of plasmid DNA with Fenton’s reagent resulted in the loss of super coiled DNA and the sharp increase of nicked DNA (lane 5). However, it could be noted that the additions of G. wilfordii Maxim extract, corilagin, geraniin, ellagic acid, and myricetrin resulted in a prominent and dose-dependent increase in super coiled DNA and decrease in nicked DNA (lanes 2–4). It was illustrated that G. wilfordii Maxim extract and four xanthine oxidase inhibitors exhibited good radical scavenging activity and effectively protected plasmid DNA against oxidation. However, the protection effects of these four bioactive compounds were not the same. Corilagin showed the best protection for plasmid DNA damage, and no nicked DNA was observed at 0.05 mg/ml (Figure 3b). Geraniin and ellagic acid showed moderate protection, and plasmid DNA was well protected when the concentrations were at 2 mg/ml, whereas myricetrin showed the weakest protective effect for plasmid DNA damage. Only small portion (8.0%) of DNA was protected at 2 mg/ml (Figure 3e). In an earlier literature, some extract of fruits containing ellagic acid could protect plasmid DNA nicking [37], and corilagin and geraniin in Phyllanthus amarus had weak protection on plasmid pBR322 DNA from radiation-induced damage [38]. Some DNA protective effects of natural source compounds were reported as well. Eugenol and isoeugenol showed protective effects in a range from 10 to 60 mg/ml [39]. In Anter’s research, oleuropein inhibited the oxidative damage with an inhibition percentage of 73.7% at 555 μM and luteolin showed inhibition percentage of 70.2% at 35 μM [40].
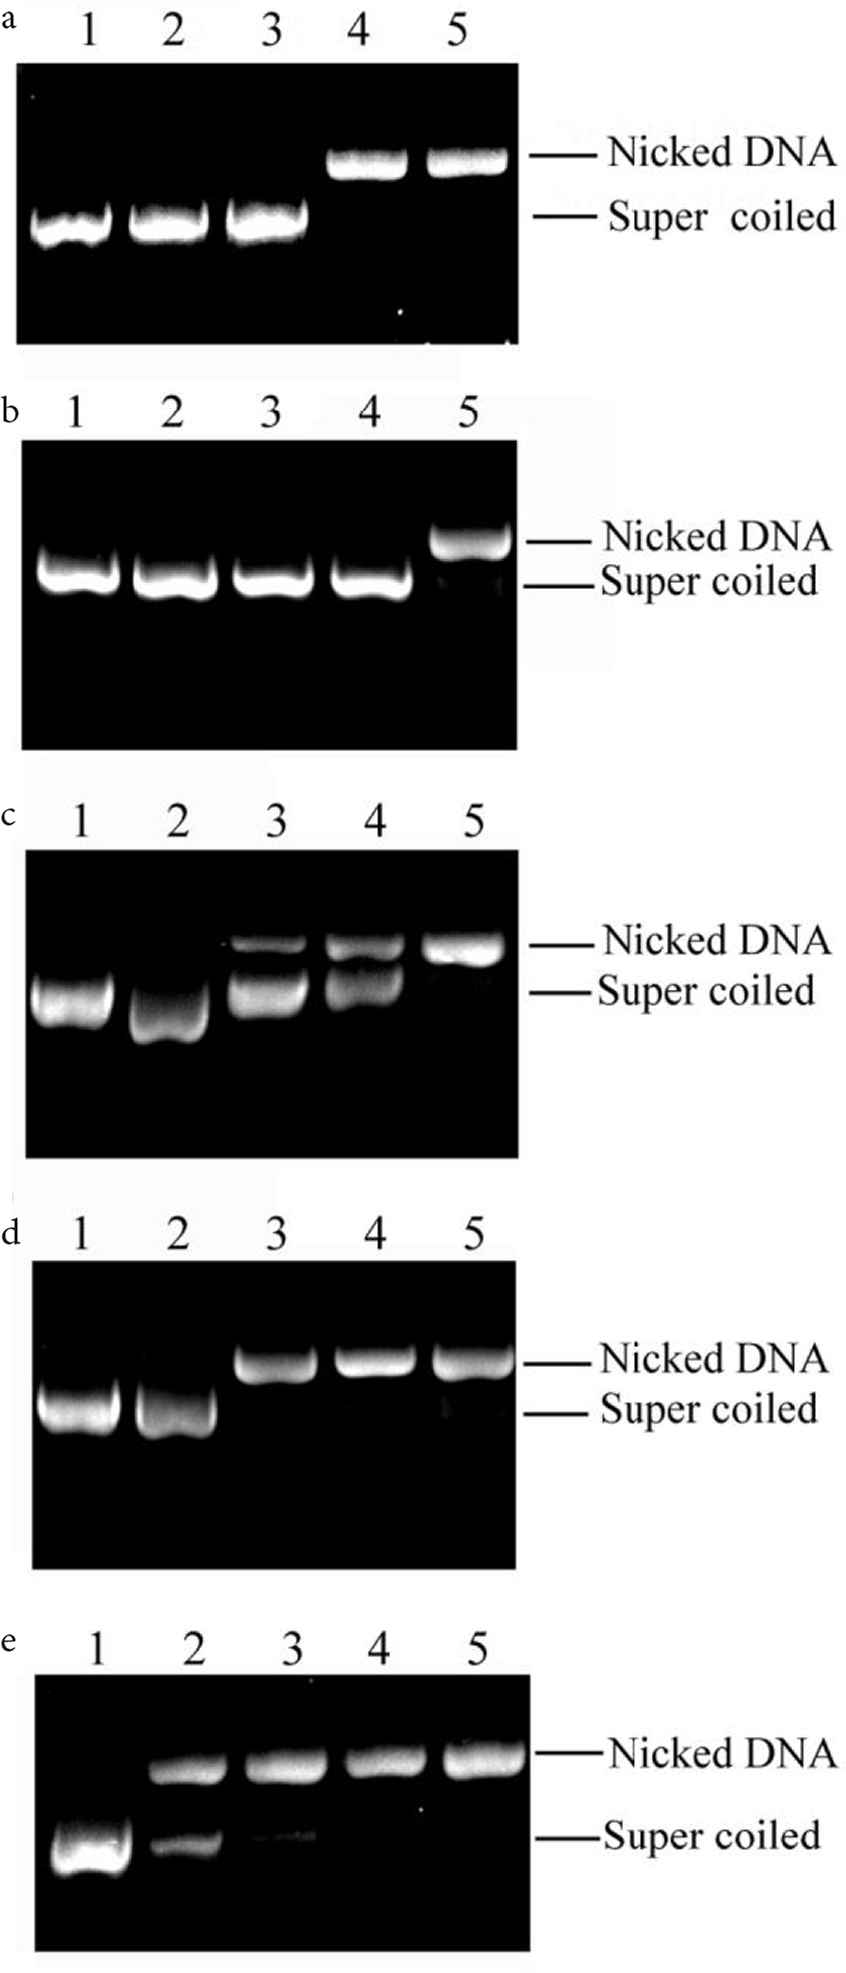
Comparative analysis of DNA protection capacities of extract of (a) Geranium wilfordii Maxim, (b) corilagin, (c) geraniin, (d) ellagic acid, and (e) myricetrin. Lane 1: Normal DNA; lanes 2–4: DNA + Fenton’s reagent + sample (2, 0.5, 0.05 mg/ml); lane 5: DNA + Fenton’s reagent. The concentration of plasmid pUC19 is 391 ng/μl.
3.7. Comparision of G. wilfordii samples
Twenty G. wilfordii Maxim samples from four provinces were obtained. The contents of corilagin, geraniin, ellagic acid, and myricetrin, antioxidant activities (DPPH and ABTS), and xanthine oxidase inhibition were evaluated. The results are shown in Table 4. Five samples from the Anhui province showed relatively lower contents (even absence) of geraniin. Sample No. 2 have the maximum corilagin, geraniin and ellagic acids contents. The maximum content of myricetrin could be found in sample No. 10. The correlation and partial least squares analyses between four active compounds and their bioactivities were performed. The coefficients of two methods are shown in Table 5. Results of correlation analysis showed that there was a moderate correlation between ellagic acid and DPPH˙ scavenging activity. However, only slight correlations could be observed in ellagic acid with ABTS˙ scavenging activity and geraniin with xanthine oxidase inhibitory activity. Partial least squares analysis gave the same results for the contributions of three activities. Ellagic acid contributed the highest coefficients for DPPH˙ and ABTS˙ scavenging activities, and geraniin contributed the highest coefficients for xanthine oxidase inhibitory activity.
| No. | Location | Contents (mg/g) | Bioactivity (inhibition %) | |||||
|---|---|---|---|---|---|---|---|---|
| Corilagin | Geraniin | Ellagic acid | Myricetrin | DPPH | ABTS | Xanthine oxidase | ||
| 1 | Anhui | 0.75 ± 0.004 | 0.41 ± 0.004 | 3.28 ± 0.120 | 1.12 ± 0.011 | 92.4 ± 0.4 | 36.2 ± 0.6 | 53.5 ± 0.5 |
| 2 | Anhui | -a | - | 0.04 ± 0.002 | 0.02 ± 0.002 | 24.3 ± 0.8 | 4.7 ± 0.2 | 6.5 ± 0.2 |
| 3 | Anhui | 0.51 ± 0.010 | 0.26 ± 0.006 | 2.28 ± 0.009 | 0.66 ± 0.009 | 93.3 ± 0.2 | 41.6 ± 0.4 | 55.0 ± 0.2 |
| 4 | Anhui | - | - | 0.37 ± 0.008 | 0.06 ± 0.002 | 51.5 ± 0.5 | 17.9 ± 0.4 | 33.6 ± 0.3 |
| 5 | Anhui | 2.10 ± 0.006 | 4.61 ± 0.080 | 5.35 ± 0.300 | 1.89 ± 0.027 | 93.4 ± 0.8 | 51.3 ± 0.4 | 45.1 ± 0.3 |
| 6 | Anhui | 0.53 ± 0.007 | 1.87 ± 0.006 | 3.08 ± 0.019 | 1.30 ± 0.005 | 83.7 ± 0.4 | 42.4 ± 0.3 | 47.5 ± 0.6 |
| 7 | Anhui | 0.77 ± 0.009 | 1.73 ± 0.044 | 2.12 ± 0.012 | 1.09 ± 0.009 | 93.5 ± 0.3 | 79.8 ± 0.6 | 44.4 ± 0.5 |
| 8 | Anhui | 1.03 ± 0.006 | 0.92 ± 0.010 | 4.46 ± 0.009 | 0.73 ± 0.009 | 94.6 ± 0.2 | 46.3 ± 0.3 | 32.5 ± 0.4 |
| 9 | Anhui | 1.09 ± 0.004 | 2.55 ± 0.006 | 3.94 ± 0.010 | 1.07 ± 0.010 | 95.6 ± 0.5 | 32.7 ± 0.5 | 34.4 ± 0.1 |
| 10 | Anhui | 1.17 ± 0.004 | 2.03 ± 0.010 | 3.48 ± 0.033 | 1.32 ± 0.010 | 94.5 ± 0.3 | 80.7 ± 0.5 | 30.3 ± 0.2 |
| 11 | Anhui | 1.62 ± 0.010 | 0.29 ± 0.004 | 3.09 ± 0.005 | 1.39 ± 0.006 | 79.2 ± 0.2 | 7.6 ± 0.3 | 6.7 ± 0.3 |
| 12 | Hebei | 0.82 ± 0.004 | 1.74 ± 0.005 | 2.22 ± 0.004 | 1.05 ± 0.002 | 86.5 ± 0.1 | 21.1 ± 0.6 | 59.6 ± 0.8 |
| 13 | Hebei | 0.85 ± 0.012 | 2.12 ± 0.013 | 2.72 ± 0.050 | 2.23 ± 0.003 | 82.7 ± 0.4 | 49.9 ± 0.6 | 26.8 ± 0.1 |
| 14 | Hebei | 0.52 ± 0.008 | 2.11 ± 0.004 | 2.60 ± 0.090 | 1.12 ± 0.007 | 91.4 ± 0.4 | 57.6 ± 0.3 | 15.2 ± 0.2 |
| 15 | Hebei | 0.23 ± 0.005 | 0.78 ± 0.024 | 2.12 ± 0.031 | 0.85 ± 0.011 | 80.0 ± 0.6 | 55.6 ± 0.3 | 27.2 ± 0.2 |
| 16 | Hebei | 1.75 ± 0.011 | 1.57 ± 0.006 | 4.78 ± 0.009 | 1.70 ± 0.006 | 83.7 ± 0.3 | 38.8 ± 0.3 | 7.5 ± 0.1 |
| 17 | Henan | 3.26 ± 0.005 | 16.28 ± 0.008 | 5.80 ± 0.004 | 0.60 ± 0.006 | 94.8 ± 0.3 | 45.3 ± 0.5 | 39.5 ± 0.9 |
| 18 | Henan | 0.84 ± 0.012 | 2.01 ± 0.008 | 2.68 ± 0.015 | 2.00 ± 0.001 | 67.7 ± 0.3 | 33.1 ± 0.7 | 57.1 ± 0.3 |
| 19 | Yunnan | 0.35 ± 0.015 | 7.12 ± 0.009 | 2.06 ± 0.011 | 0.07 ± 0.002 | 83.3 ± 0.2 | 57.1 ± 0.2 | 37.6 ± 0.3 |
| 20 | Yunnan | 0.25 ± 0.012 | 0.70 ± 0.016 | 1.09 ± 0.008 | 0.03 ± 0.005 | 81.2 ± 0.2 | 36.6 ± 0.2 | 26.3 ± 0.2 |
means not detected.
Contents of corilagin, geraniin, ellagic acid, and myricetrin, DPPH and ABTS scavenging activities and xanthine oxidase inhibition of 20 G. wilfordii extracts. The concentration of the extract was unified at 0.80 g/l
| Compounds | Correlation analysis | Partial least squares analysis | ||||
|---|---|---|---|---|---|---|
| DPPH | ABTS | Xanthine oxidase | DPPH | ABTS | Xanthine oxidase | |
| Corilagin | 0.4639 | 0.1143 | 0.0088 | −11.4438 | −22.9490 | −13.5689 |
| Geraniin | 0.2930 | 0.2324 | 0.1527 | 2.0054 | 12.2693 | 8.6736 |
| Ellagic acid | 0.6821 | 0.3018 | 0.1129 | 20.4555 | 16.3800 | 6.7755 |
| Myricetrin | 0.3615 | 0.2200 | 0.1141 | 0.0554 | 5.5839 | 4.2288 |
Parameters of correlation analysis and partial least squares analysis of four active compounds and activities
4. CONCLUSION
In this research, ultrafiltration and DPPH spiking combined with HPLC–MS was used to screen xanthine oxidase inhibitors from G. wilfordii Maxim. As a result, four bioactive compounds with xanthine oxidase inhibition and antioxidation were screened and identified as corilagin, geraniin, ellagic acid, and myricetrin. The screened bioactive compounds showed obvious xanthine oxidase inhibition and antioxidation activities compared with a positive control. DNA nicking assays also showed G. wilfordii Maxim extract and four bioactive compounds had a prominent and dose-dependent protection of super coiled plasmid DNA against oxidation. The amounts of screened active compounds and the related bioactivities in 20 samples obtained from four provinces were assessed. Correlation and partial least squares analyses showed there was a moderate correlation between ellagic acid and DPPH˙ scavenging activity. These results could contribute to a comprehensive understanding of the pharmaceutical potential usage of G. wilfordii Maxim as a natural source of xanthine oxidase inhibitors and antioxidants. In addition, this study provides useful phytochemical information for the analysis of bioactive constituents in G. wilfordii Maxim.
CONFLICTS OF INTEREST
The authors declare they have no conflicts of interest.
AUTHORS’ CONTRIBUTION
AX and SM contributed in conceptualization. AX and LL contributed in methodology. YL, LL and SM contributed in data processing. YL and LL contributed in data analysis. YL and SM contributed in writing-draft. YL., LL and AX contributed in writing-revision.
ACKNOWLEDGMENTS
This work was supported by the risk assessment of agricultural products quality and safety project (GJFP2019010) and the
Footnotes
REFERENCES
Cite this article
TY  - JOUR
AU  - Yi Liu
AU  - Shiyong Mei
AU  - Aiping Xiao
AU  - Liangliang Liu
PY  - 2019
DA  - 2019/08/23
TI  - Xanthine Oxidase Inhibitors Screening, Antioxidation, and DNA Protection Properties of Geranium wilfordii Maxim
JO  - eFood
SP  - 147
EP  - 155
VL  - 1
IS  - 2
SN  - 2666-3066
UR  - https://doi.org/10.2991/efood.k.190802.004
DO  - 10.2991/efood.k.190802.004
ID  - Liu2019
ER  -