
Antioxidant Properties and Transepithelial Transportation of Di-/tripeptides Derived from Simulated Gastrointestinal Digestion of Pig Blood Cells Hydrolysates
- DOI
- 10.2991/efood.k.200422.001How to use a DOI?
- Keywords
- Pig blood cells; di-/tripeptides; antioxidant activity; transepithelial transportation; Caco-2 cells
- Abstract
Pig blood is an important by-product of the meat industry, which has not been fully utilized. In this study, Pig Blood Cells (PBC) were hydrolyzed by Alcalase and followed with simulated Gastrointestinal (GI) digestion to generate bioactive peptides. The antioxidant properties and the intestinal epithelial cells permeabilities of di-/tripeptides from PBC Hydrolysates (PBCH) were investigated. PBCH showed higher 1,1-diphenyl-2-picrylhydrazy and 2,2′-Azino-bis(3-ethylbenzothiazoline-6-sulphonic acid) radical scavenging activities than PBC, although the activities were weakened by GI digestion. Besides, both PBCH and GI digested PBCH (PBCH-GI) significantly improved cell viability and suppressed the production of reactive oxygen species under oxidative stress conditions in Caco-2 cells. By using ultra performance liquid chromatography–orbitraptandem–mass spectrometry (UPLC–Orbitrap–MS/MS) technique, 5, 144, and 150 di-/tripeptides sequences were characterized in the PBC, PBCH and PBCH-GI groups, respectively. The transepithelial transportation revealed that the permeability of di-/tripeptides through intestinal epithelial cells varied from 0.48% to 10.80%, and the peptides SDL, GDL, KF, FE exhibit high permeability values of 10.80%, 10.62%, 8.79% and 7.54%, respectively. These results indicate that PBCH has strong antioxidant properties and contains absorbable di-/tripeptides, which is promising for functional food additive.
- Graphical Abstract

- Copyright
- © 2020 International Association of Dietetic Nutrition and Safety. Publishing services by Atlantis Press International B.V.
- Open Access
- This is an open access article distributed under the CC BY-NC 4.0 license (http://creativecommons.org/licenses/by-nc/4.0/).
1. INTRODUCTION
Pig blood is an abundant by-product produced in the slaughtering process. Tons of Pig Blood Cells (PBC) are discarded as waste every year, which is not only a large waste of resources but also a big pollution to the environment [1]. Pig blood contains a valuable source of proteins, among which hemoglobin is a major protein rich in PBC [2]. It has been reported that enzymatic hydrolysis of PBC can reduce the bitterness and increase the flavor, owning to the taste attributes of diverse peptides [3]. In addition, peptides derived from PBC show various bioactive functions, such as antioxidant [4], antihypertensive [5], and antimicrobial [6]. Therefore, the study of peptides in PBC hydrolysates on their bioactivities and nutritional values has drawn much attention.
The Gastrointestinal (GI) tract is the major barrier for oral administration of peptides due to the existence of digestive enzymes [7]. On the other hand, GI digestion has reported to generate bioactive peptides [8]. Hence, digestive behavior of bioactive peptides provides valuable information on their actual functions in vivo. In recent studies, simulated GI digestion has been widely used to quickly and efficiently evaluate peptide activity and stability of hydrolysates [9].
Antioxidant peptides are one of the most important outcomes from PBC Hydrolysates (PBCH) [6]. They can inhibit the production of superfluous Reactive Oxygen Species (ROS) to prevent the damage of cellular lipids and proteins and the occurrence of various diseases [10,11]. Previously studies have shown that tetrapeptide ADGF, AGGF and ETTL exhibited high radical scavenging ability [10], and peptides NPYVPY and AVPYPQY have been reported to reduce the ROS levels in oxidatively damaged cells [12]. However, studies of these antioxidant peptides mainly focused on peptides with more than three amino acid residues. The antioxidative activity of peptides is affected by many factors, such as their structure and amino acids composition [13]. Studies have indicated that antioxidant peptides with low molecular weight exhibit higher antioxidant activity than large molecular weight peptides [14]. Therefore, it is necessary to investigate the antioxidant activity of low molecular weight peptides derived from PBC.
Small peptides, especially di-/tripeptides, have advantages on intestinal absorption capacity and stability against gastrointestinal proteases over polypeptides [15]. It has been pointed out that di-/tripeptides can be absorbed as intact form into the blood circulation and then produce biological effects [16]. Di-/tripeptides can be transported by H+ coupled Peptide Transporter 1 (PepT1) and be absorbed by intestinal epithelial cells [17]. Most of di-/tripeptides are hydrolyzed into amino acids when cross the intestinal epithelial cells, while others maintain the intact form. However, the permeability of different di-/tripeptides are still lack of investigation. Human colon adenocarcinoma (Caco-2) cells has commonly been used as a model to evaluate the intestinal permeability of nutraceuticals as well as peptides [12].
In this study, PBC were hydrolyzed by Alcalase to generate di-/tripeptides. Antioxidant activities of hydrolysates were determined after enzymatic hydrolysis and simulated GI digestion, and the di-/tripeptides from hydrolysates were identified by ultra performance liquid chromatography–orbitraptandem–mass spectrometry (UPLC–Orbitrap–MS/MS). Then, the transepithelial transport experiments were carried out to investigate the permeability of di-/tripeptides. The aim of this study is to investigate antioxidant properties and transepithelial transportation of di-/tripeptides derived from simulated GI digestion of PBCH.
2. MATERIALS AND METHODS
2.1. Materials
Alcalase from Bacillus licheniformis (200 U/mg) was purchased from Shanghai Yuanye Bio-Technology Co., Ltd. (Shanghai, China). Pepsin from porcine stomach, trypsin from porcine pancreas and l-Methionine sulfone (purity ≥99%) were all obtained from J&K Scientific Ltd. (Beijing, China). 1,1-Diphenyl-2-picrylhydrazy (DPPH), Methylthiazolyldiphenyl-tetrazolium bromide (MTT), 2′,7′-Dichlorofluorescin Diacetate (DCFH-DA) and formic acid (liquid chromatography–mass spectrometry (LC–MS) grade) were purchased from Sigma-Aldrich (St. Louis, MO, USA). The 2,2′22 ich (St. Louis, MO, USA). olium bromide (MTT), 2′(ABTS) total antioxidant capacity assay kit was purchased from Beyotime Institute of Biotechnology (Shanghai, China). Standard substances of dipeptides (purity ≥95%) were obtained from DGpeptidesCo., Ltd. (Hangzhou, China). Caco-2 cells were obtained from the American Type Culture Collection (Manassas, VA, USA). Dulbecco’s Modified Eagle Medium/Nutrient Mixture F-12 (DMEM/F12), Fetal Bovine Serum (FBS), Hanks’ Balanced Salt Solution (HBSS) and antibiotic solution (10,000 units/mL penicillin, 10,000 μg/mL streptomycin) were purchased from Gibco Life Technologies (Grand Island, NY, USA). Hydrogen peroxide (H2O2) was purchased from Guangzhou Chemical Reagent Factory (Guangzhou, China). Acetonitrile (ACN, LC–MS grade), methanol (high performance liquid chromatography (HPLC) grade) were purchased from Merck (Darmstadt, Germany).
2.2. Sample Preparation
Fresh pig blood was obtained from the Institute of Subtropical Agriculture, the Chinese Academy of Sciences (Changsha, China). The collected fresh blood was mixed with sodium citrate (10 g/L) to prevent clotting, then centrifuged at 4000 g at 4°C for 15 min to obtain the blood cell fractions. The red blood cells were formed the bottom layer after centrifugation, then harvested and lyophilized by a vacuum freeze dryer. Freeze-dried PBC were dissolved with distilled water (20 mg/mL), hydrolyzed by Alcalase in optimized conditions (Enzyme/Substrate 2.5%, pH 10, 40°C, 30 h) to obtain hydrolysates. pH was adjusted with 1M NaOH or HCl. After the reaction, hydrolysates were heated to inactivate the enzyme at 90°C for 15 min, then centrifuged at 8000 g for 10 min at 4°C to remove the precipitates. The supernatants were collected, lyophilized, and stored at −20°C for further analysis.
2.3. Optimization of Sample Preparative Conditions
Response Surface Methodology (RSM) was used to optimize enzymatic hydrolysis conditions according to the Degree of Hydrolysis (DH) of PBC. DH is an important indicator during protein hydrolysis, which is defined as the percentage of cleaved peptide bonds [18]. The four independent variables, i.e. time, pH, temperature and Enzyme-to-Substrate Ratio (E/S) at three different levels were applied in a Box–Behnken Design (BBD) of RSM. Table S1 shows the levels of the independent variables. Design-Expert® (Version 8.0.6, Stat-Ease. Inc., Minneapolis, MN, USA) software was applied to analyze the experimental data, establishing the quadratic regression equation and determining the optimal combination of hydrolysis conditions. Experimental validation was performed using the optimized condition to ensure the validity of RSM model. The DH was measured according to the o-phthaldialdehyde method [18].
2.4. Simulated Gastrointestinal (GI) Digestion
Gastrointestinal digestion of PBCH was performed by the method of Cinq-Mars et al. [19] with slight modifications. Briefly, the PBCH solution was digested by pepsin (E/S, 1:35, w/w) for 1 h at 37°C, pH 2.0. Then, pH was adjusted to 5.3 with NaHCO3 and further to 7.5 with 1M NaOH. Trypsin (E/S, 1:25, w/w) was added to hydrolysates for further digestion, incubated at 37°C for 2 h. After centrifugation at 10,000 g for 10 min, the supernatants were lyophilized and stored at −20°C.
2.5. DPPH Radical Scavenging Activity
The DPPH radical scavenging activity was determined according to the method of Brand-Williams et al. [20] with some modifications. Samples were dissolved in sodium phosphate buffer to obtain various concentrations (1, 2, 4 and 10 mg/mL). About 100 μL sample solution was mixed with 100 μL DPPH solution (0.1M in 95% ethanol) in each well of the 96-well microplates. After incubation for 30 min, the absorbance was measured at 517 nm using a multimode microplate reader (VarioskanTM LUX, Thermo Fisher Scientific, MA, USA). The DPPH radical scavenging activity was calculated using the following equation:
2.6. ABTS Radical Scavenging Activity
The ABTS radical scavenging activity was performed using the total antioxidant capacity assay kit with ABTS method. The ABTS radical cation (ABTS·+) solution was produced by mixing ABTS stock solution with 2.45 mM potassium persulfate for 12–16 h in the dark at room temperature. Then, the ABTS·+ solution was diluted with sodium phosphate buffer to reach an absorbance of 0.70 ± 0.05 at 734 nm. About 10 μL sample solution was added to 200 μL of diluted ABTS·+ solution, the absorbance was measured at 734 nm after 2–6 min incubation in the dark at room temperature. Buffer solution without the addition of sample was used as the blank. The ABTS radical scavenging activity was calculated using the following equation:
2.7. Cell Viability Assay
Caco-2 cells were cultured in DMEM/F12 supplemented with 10% FBS and 1% antibiotic solution, at 37°C under 5% CO2, fully humidified atmosphere. The medium was changed every other day. Cell viability was determined by the MTT method [21]. Briefly, Caco-2 cells were seeded in 96-well plates at a density of 1 × 10⁴ cells/well and incubated for 24 h at 37°C, 5% CO2. Then, cells were treated with different hydrolysates concentrations of samples at 0.5, 1, 2, 4 and 10 mg/mL. The control cells were treated with medium only. After 24 h incubation, MTT (5 mg/mL) was added, and cells were continued to culture for 4 h. About 150 μL dimethyl sulfoxide was added to dissolve the formed formazan, after 30 min shaking at room temperature, the absorbance was measured at a wavelength of 490 nm.
2.8. Intracellular Reactive Oxygen Species Levels
The intracellular ROS scavenging capacity of PBCH and PBCH-GI in oxidized Caco-2 cells were measured using a DCFH-DA fluorescent probe assay, following the method of Wang et al. [22]. Caco-2 cells at the density of 1 × 10⁴ cells/well were seeded onto 96-well plates and incubated for 24 h. Then, cells were pretreated with 180 μL/well of PBCH and PBCH-GI at final concentrations of 0.5–10 mg/mL, for another 24 h. About 1 mM H2O2 was added to cells for further 2 h to induce oxidative stress. Cell viability was determined using the MTT method. For determination of intracellular ROS level, cells were incubated with 100 μL of 100 μM DCFH-DA for 30 min. The control cells were treated with medium only and damaged cells were added with medium and H2O2 only. Finally, the intensity of fluorescence was measured at an excitation wavelength of 488 nm and an emission wavelength of 525 nm using a microplate reader. Data was obtained from three independent experiments, with each plate containing six replicates for each sample.
2.9. Transportation Experiments
Caco-2 cells were seeded onto 24-well Transwell inserts (0.4 μm pore size, 6.5 mm diameter, 0.33 cm2 grown surface, Corning, NY, USA) at a density of 5 × 10⁵ cells/well. The culture medium was carefully replaced until the cells were fully differentiated for at least 21 days. The integrity of cells monolayer was measured by measuring Transepithelial Electrical Resistance (TEER) using a Millicell ERS-2 epithelial volt-ohm meter (Millipore, Billerica, MA, USA), and only monolayers with TEER value above 300 Ω·cm2 were used for the transport study. Before the transport study, cells were washed twice with HBSS and further equilibrated with HBSS at 37°C for 30 min. Then, 200 μL of hydrolysates (10 mg/mL) dissolved in HBSS was added to the apical side and 600 μL of fresh HBSS added to the basolateral side. After 2 h of incubation, the remnants on the Apical Side (AP) and the absorbed permeates on the Basolateral Side (BL) were collected for UPLC–Orbitrap–MS/MS analysis. The permeability of small peptide from hydrolysates was calculated according to the following equation:
2.10. UPLC–Orbitrap–MS/MS Analysis
The samples were thawed at room temperature. To precipitate proteins, 1 mL methanol were added to 180 μL samples with 50 μL l-methionine sulfone (10 μg/mL, internal standard), vortexed and then centrifuged at 14,500 rpm for 15 min at 4°C. The supernatants were evaporated and reconstituted in 200 μL methanol, then filtered through a 0.22-μm regenerated cellulose filter before UPLC–Orbitrap–MS/MS analysis. The di-/tripeptides in samples were analyzed by a Dionex UltiMate 3000 UPLC system coupled with a high-resolution Q-Exactive Focus mass spectrometer (Thermo Fisher Scientific, MA, USA). The chromatographic separation was performed on a C18 Hypersil Gold column (100 × 2.1 mm2, 1.9 μm, Thermo Fisher Scientific, MA, USA). The mobile phase was 0.1% formic acid in water (A) and acetonitrile (B), setting a flow rate of 0.2 mL/min. Gradient elution started with 5% B and increased to 95% B in 15 min. The composition was then held at 95% B for 5 min and returned to initial conditions. The injection volume was 2 μL. The mass spectrometer data were obtained using heated Electrospray Ionization (ESI) in the positive ionization modes, spray voltage, 4 kV (+4 kV in ESI+), 3 kV (−3 kV in ESI−); sheath gas (N2, >95%), 30 bar; auxiliary gas, 10 bar; heater temperature, 350°C; capillary temperature, 320°C. Full MS scan ranged from m/z 100 to 1000 at the resolution of 35,000. The MS/MS scanning mode performed at the resolution of 17,500 and high collision-induced dissociation was set as stepped normalization collision energy mode (10, 30, 50). Xcalibur 3.0 (Thermo Fisher Scientific, MA, USA) was used for UPLC–Orbitrap–MS/MS control and data analysis.
2.11. Identification and Quantification of Di-/tripeptides
The raw data including the information of retention time, exact mass, MS and MS/MS spectra were generated by UPLC–Orbitrap–MS/MS. These information of di-/tripeptides were extracted by Xcalibur 3.0 and used to identify was based on the following: (a) by comparing the 400 dipeptides standard substance in terms of retention time, exact mass and MS/MS spectra. (b) By searching the online database MyCompoundID (www.mycompoundid.org/PEP), which consisting of predicted MS/MS spectra of 400 dipeptides and 8000 tripeptides [23]. The characteristic fragmentation pathways of di-/tripeptides were described and analyzed with the help of Chemdraw (version 12.0, PerkinElmer, USA) to verify and identify peptides. Quantification of di-/tripeptides were performed using the internal standard method. The quantitative results of di-/tripeptides were obtained by calculating the peak area ratio of one peptide to the internal standard on the same chromatogram. The concentration of internal standard (l-methionine sulfone) was 10 μg/mL. Porcine hemoglobin (Sus scrofa) sequences were obtained from NCBI protein database (http://www.ncbi.nlm.nih.gov/). The bioactivities of peptides were obtained by searching the BIOPEP database (http://www.uwm.edu.pl/biochemia/index.php/pl/biopep/) and published literatures [24,25].
2.12. Statistical Analysis
MZmine 2.2.1 (open-source software) was used for mass-spectrometry data processing, including the modules of align scans, peak detection, deconvolution, peak list alignment, gap filling and filtering [26,27]. All data were expressed as the mean ± Standard Deviation (SD), of three independent experiments. Student’s t-test was applied to determine the differences between two groups of samples with the significance level at p < 0.05. One-way Analysis of Variance (ANOVA) and Duncan’s multiple range test were used to determine the differences among multiple groups of samples with the significance level at p < 0.05. All statistical analysis was operated by SPSS 23.0 software (SPSS Inc., Chicago, IL, USA), except that the differences of independent variables in BBD design were analyzed using Design-Expert® software.
3. RESULTS AND DISCUSSION
3.1. Optimization of Extraction Conditions
The experimental design and results for the DH (%) under various combinations of variables are shown in Table S2. A quadratic regression model was obtained using Design-Expert® based on the experimental data. Table S3 displays the ANOVA for response surface quadratic model. The probability value of DH indicated a high significance for regression equation (p < 0.01) and the lack of fit was insignificant. The determination coefficient (R2) and predicted R2 were 0.9821 and 0.9021, respectively, showing that the model could be used to fit the effect of four factors on the DH of hydrolysates. The optimal hydrolysis conditions were E/S of 2.5% (w/w), pH of 10, temperature of 40°C and incubation period of 30 h. Under this condition, the DH of hydrolysates reaches a maximum of 49.19%, which is in reasonable agreement with the predicted value (49.74%). Hydrolysates obtained from this condition were used for further studies.
3.2. Chemical Antioxidant Activities
In this study, antioxidant properties of the PBC after Alcalase hydrolysis and simulated GI digestion were investigated. DPPH and ABTS radical are stable free radical that can be scavenged by antioxidants, which have been widely used to evaluate antioxidant activity of natural products [28]. The DPPH and ABTS radical scavenging activities of PBC, PBCH and PBCH-GI are shown in Figure 1. It can be seen from Figure 1A that the DPPH radical scavenging activity of PBCH was significantly improved when compared to PBC, and the activities show a dose-dependent manner. PBCH had the highest DPPH radical scavenging activity of 72.85 ± 2.00% at a concentration of 10 mg/mL. In a previous study, porcine hemoglobin was hydrolyzed by Alcalase for 10 h and the DPPH radical scavenging activity was 48.55 ± 3.97% [29]. After treated with fungal protease FP400 for 24 h, the ability of PBCH to scavenge DPPH radicals was 59.39 ± 2.43% [6]. It can be seen that the DPPH radical scavenging activity of PBCH in our study was better than that of previous studies by optimizing the hydrolysis conditions of the Alcalase. After simulated GI digestion, the scavenging activity of PBCH was decreased, and at a concentration of 4 mg/mL of the hydrolysates, the DPPH radical scavenging activity was reduced by about 8%. This trend was consistent with the results reported on carp protein hydrolysates [30]. And this may be due to the degradation of some antioxidant peptides by digestive enzyme into small peptides and amino acids. Figure 1B shows the ABTS radical scavenging activity of the samples, which was evaluated at concentrations from 1 to 10 mg/mL. Compared to PBC, PBCH displayed higher radical scavenging activity and the scavenging activities were dependent on the concentration of samples. At the highest concentration of 10 mg/mL, PBCH showed 90.75 ± 0.09% scavenging effect on ABTS radicals. After GI digestion, there was a significant decrease on the scavenging activity of PBCH at the concentration of 1 and 2 mg/mL. The results of free radical scavenging activity of hydrolysates are consistent with the former study, which pointed out that the radical scavenging activity of casein peptide fractions and soybean hydrolysates were significantly reduced after simulated GI digestion, and the percentage of decrease was 10% [31]. The above results demonstrate that PBCH has positive effects on scavenging free radicals, but the effects are weakened by simulated GI digestion.
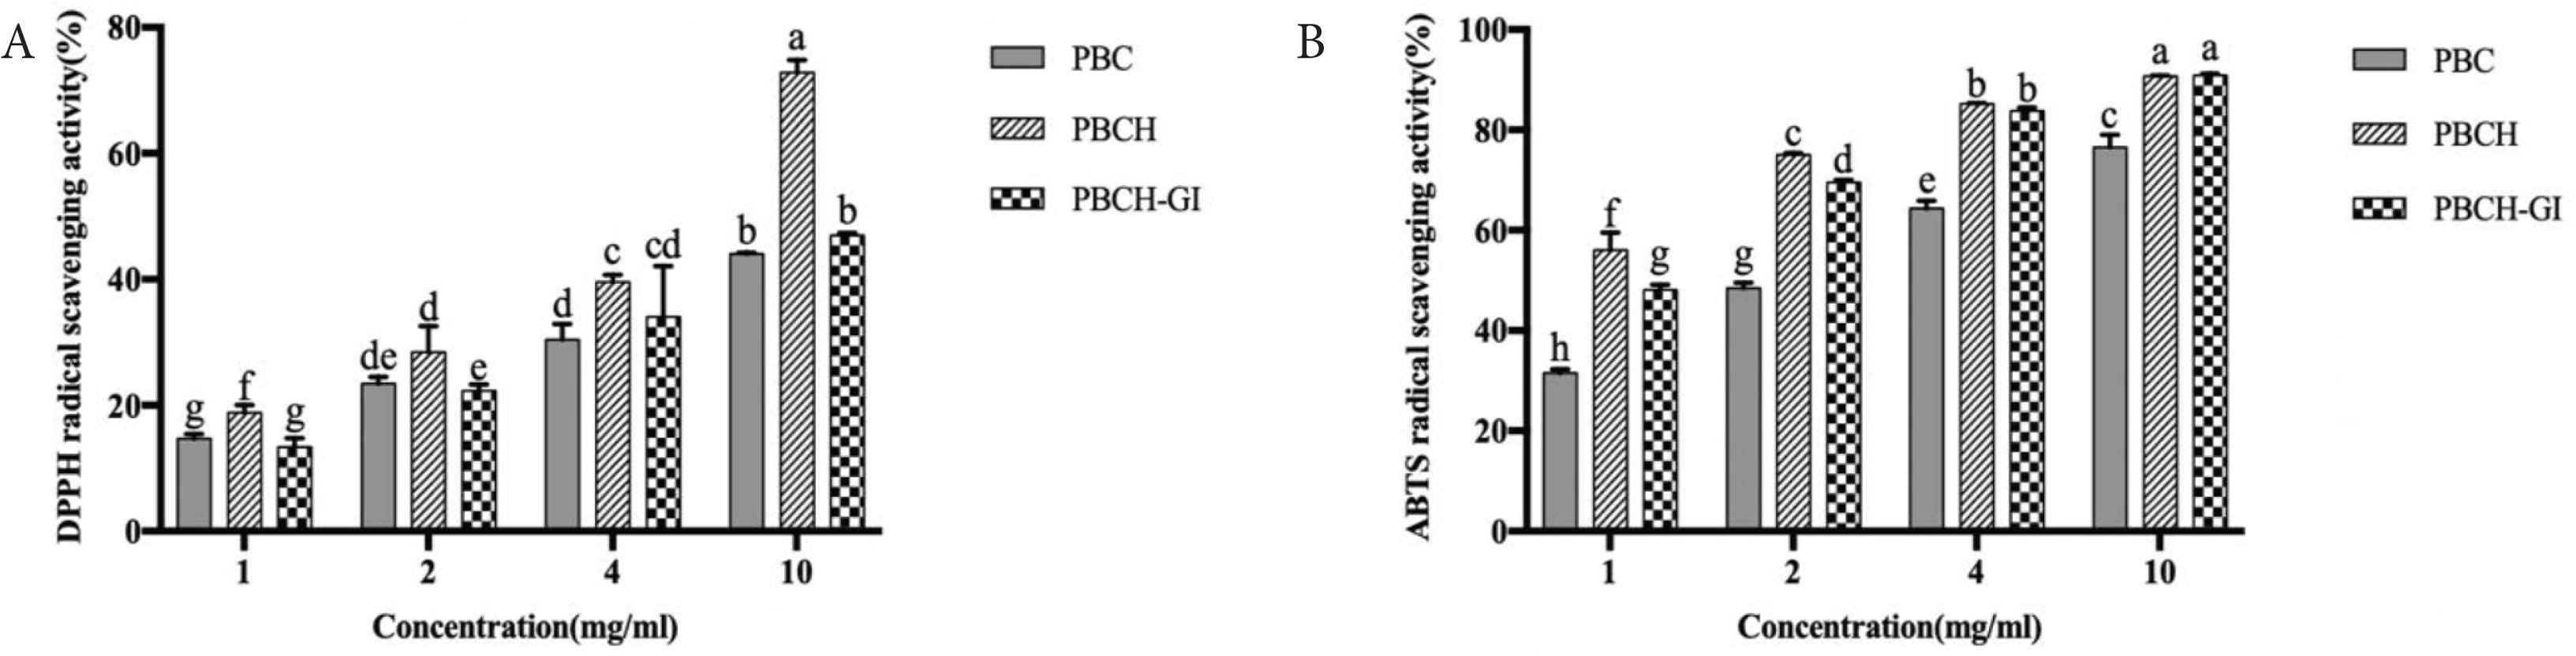
DPPH (A) and ABTS radical scavenging activity (B) of PBC, PBCH and PBCH-GI at various concentrations. Values are expressed as the means ± SD, n = 3; data with different lowercase letters show significant differences (p < 0.05). PBC, pig blood cells; PBCH, pig blood cell hydrolysates; PBCH-GI, gastrointestinal-digested pig blood cell hydrolysates.
3.3. Cellular Antioxidant Activities
In addition to common chemical assays for screening antioxidants, it is important to use cell models to evaluate antioxidant activity, which is cost-effective and helpful in predicting in vivo effects of antioxidant peptides [22]. Caco-2 cells were selected to evaluate the antioxidant activities of PBCH and PBCH-GI. Before measuring antioxidant capacity, it is necessary to know whether the hydrolysates are toxic to cells. The results show that the PBCH and PBCH-GI have no significant difference on cell viability at the test concentrations (Figure 2A). Then, hydrogen peroxide (H2O2) is used as the oxidative stress stimulus, which can enter the interior of cells and cause the generation of ROS. As can be seen from Figure 2B, the damaged cells group which was added with 1 mM H2O2, showed lower cell viability than the control group (p < 0.05). Nevertheless, pretreatment of cells with PBCH and PBCH-GI significantly increased cell viability when compared to the damaged group (p < 0.05), indicating the cytoprotective effect on oxidatively damaged Caco-2 cells. Besides, the protective effect of PBCH on H2O2-induced damaged cells generally decreased after GI digestion. The protective effect of PBCH and PBCH-GI on cells may be related to the clearance of ROS. The intracellular ROS scavenging capacities of PBCH and PBCH-GI under conditions of damaged Caco-2 cells were shown in Figure 2C. The ROS level in Caco-2 cells increased significantly after treatment with H2O2; however, compared to the damaged group, the treatment of cells with PBCH and PBCH-GI significantly suppressed ROS formation at concentrations ranging from 0.5 to 10 mg/mL. Particularly, when the treatment concentration of hydrolysates was 4 and 10 mg/mL, there was no significant difference in ROS level compared to the control group. Under the treatment of PBCH-GI, the ROS level of cells stimulated by H2O2 were reduced by 27.27%, 37.95%, 46.39%, 54.50% and 56.18% at concentrations of 0.5, 1, 2, 4 and 10 mg/mL. In a previous study, the ROS level in H2O2-stimulated cells of soybean hydrolysate was decreased by 22.74% at concentrations of 1 mg/mL [7]. Our results are consistent with the previous reports, which show that milk and corn gluten meal derived antioxidant peptides can effectively scavenge intracellular excess free radicals [12,22]. The results indicate that PBCH and PBCH-GI have strong ROS scavenging capacities on oxidative damaged cells.
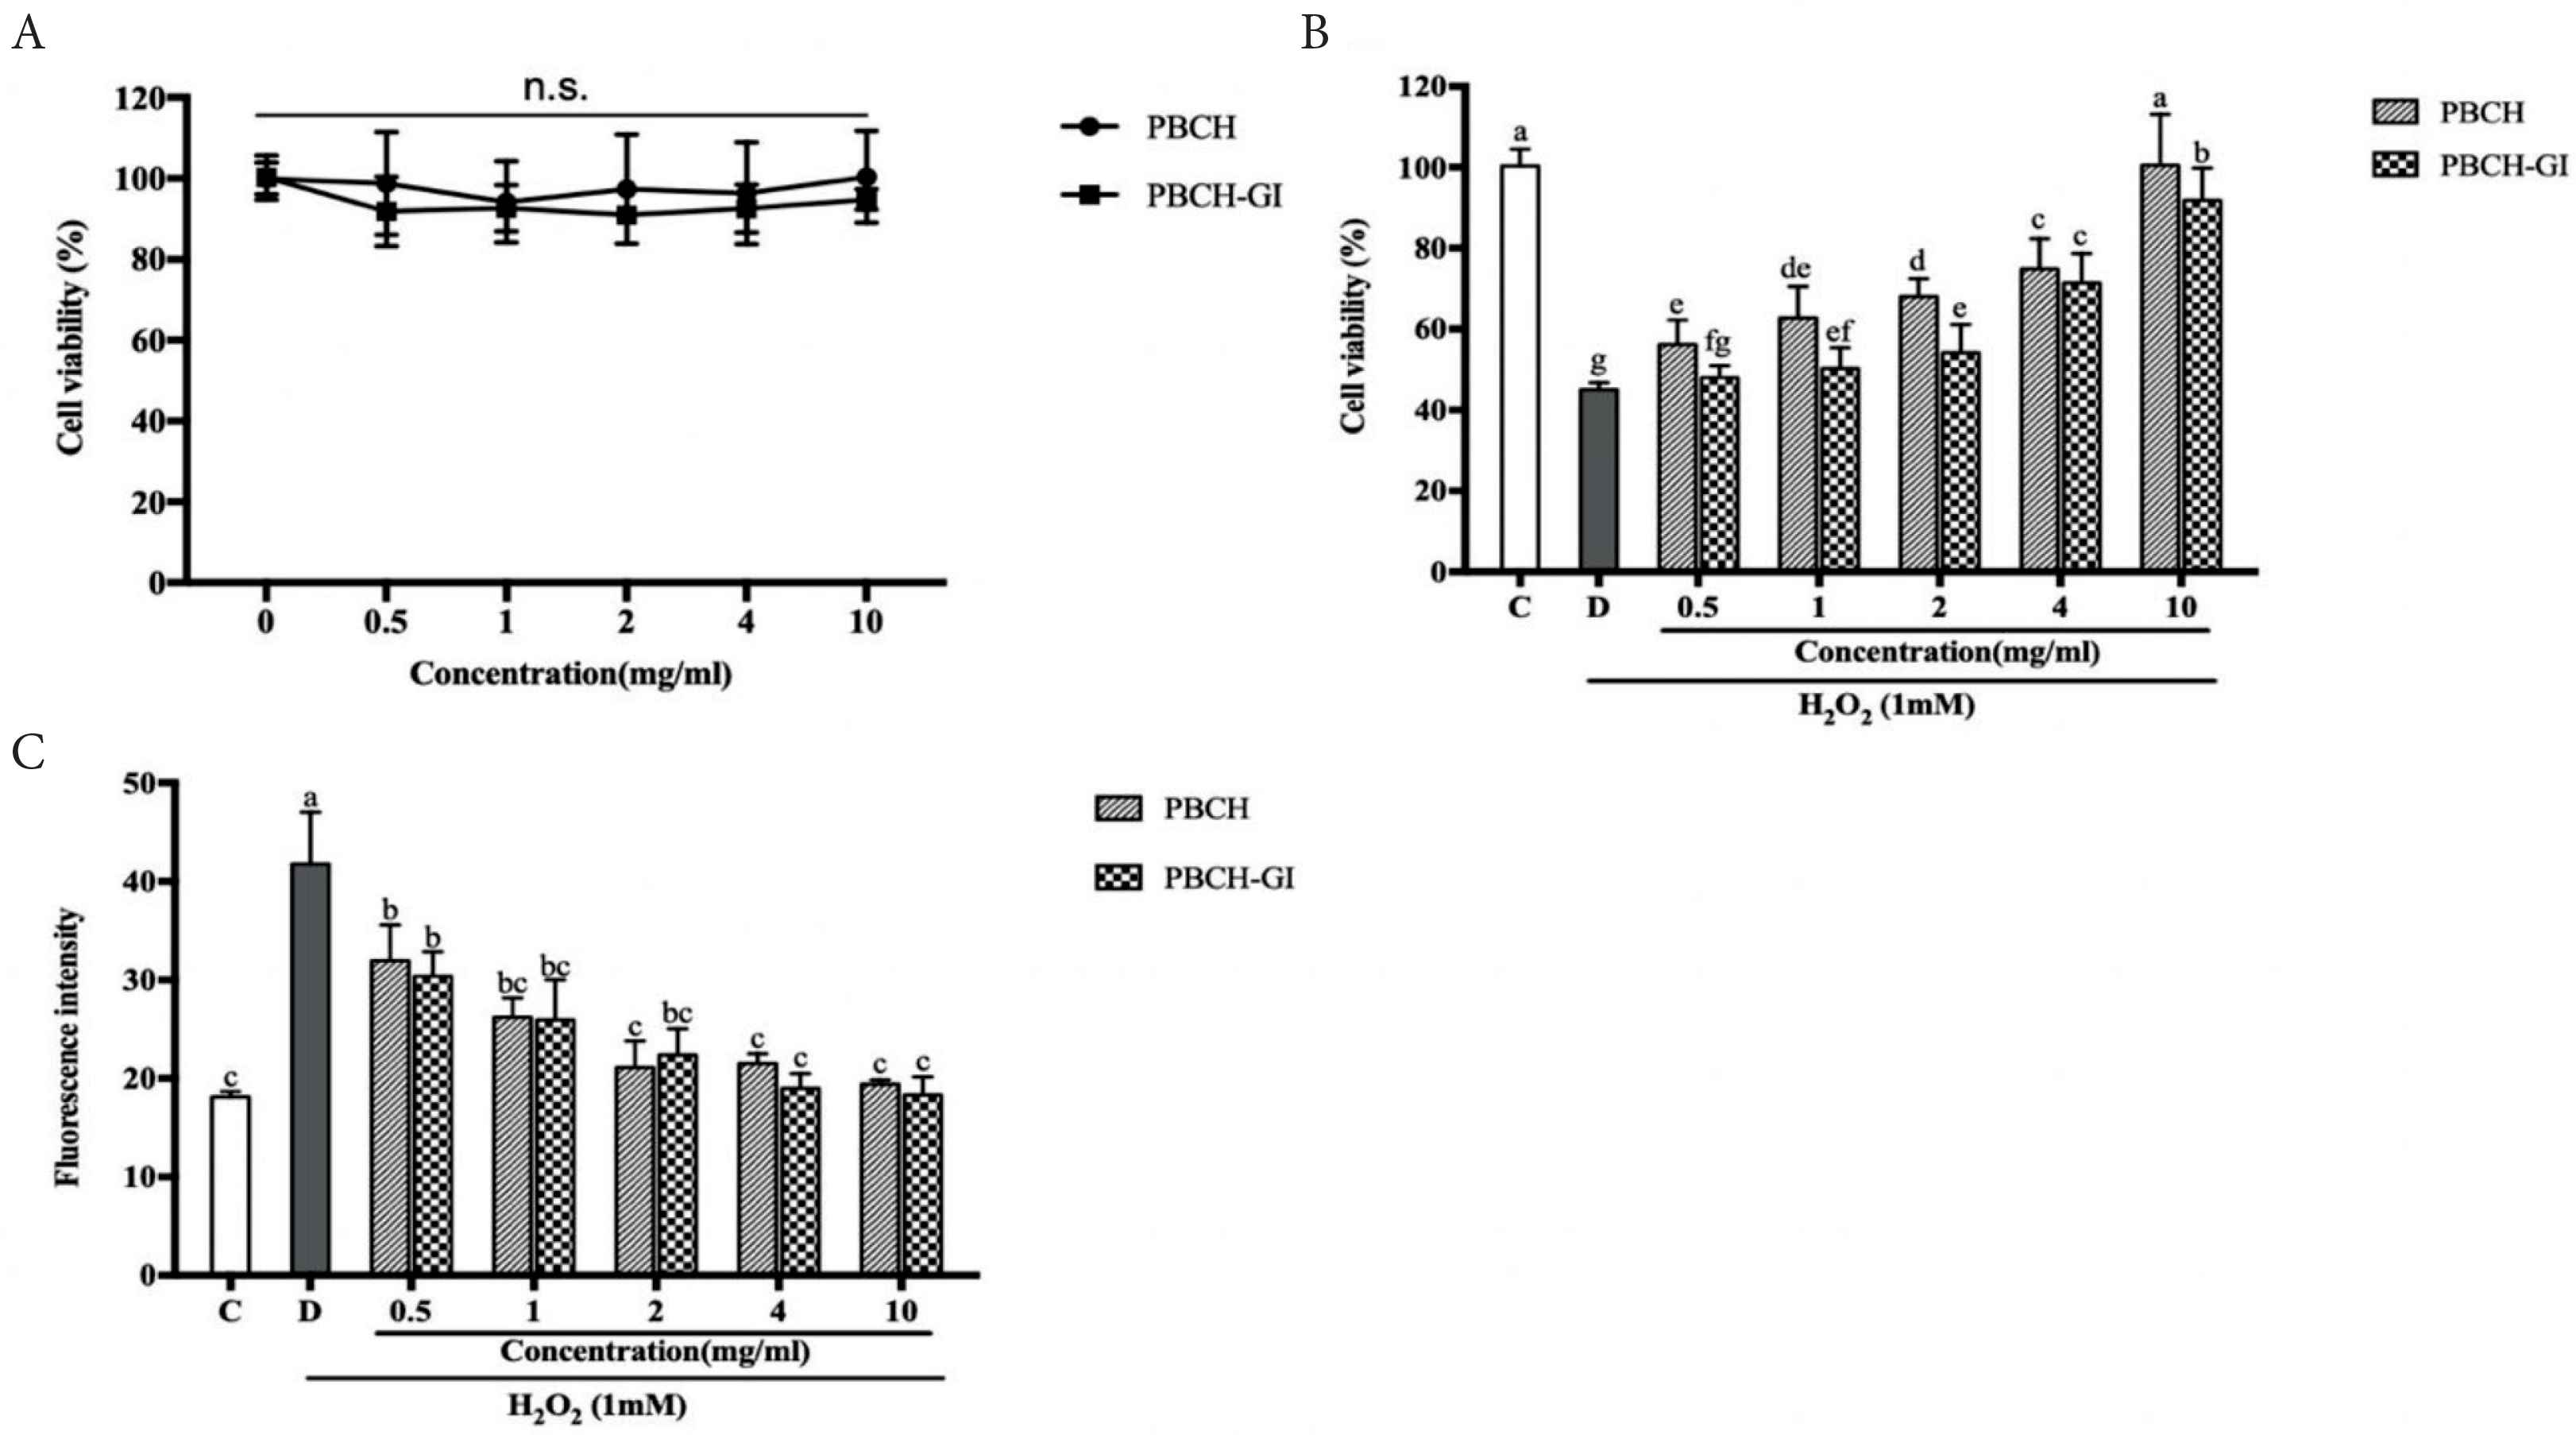
Effect of PBCH and PBCH-GI on the viability of Caco-2 cells at different concentrations (A). Cytoprotective effects of PBCH and PBCH-GI under conditions of oxidative stress in Caco-2 cells (B). Intracellular ROS scavenging capacities of PBCH and PBCH-GI under conditions of oxidative stress in Caco-2 cells (C). For the oxidative stress assay, the control group (C) was treated with medium alone, and the damaged group (D) was treated with medium and 1 mM H2O2. Data are expressed as the mean ± SD, n = 6. Bars with different lowercase letters are significantly different (p < 0.05). n.s. indicates that there is no significant difference between the groups (p > 0.05). PBCH, pig blood cells hydrolysates; PBCH-GI, gastrointestinal-digested pig blood cells hydrolysates.
3.4. Identification of Di-/tripeptides from Hydrolysates
Di-/tripeptides from hydrolysates were analyzed by UPLC–Orbitrap–MS/MS. Total Ion Chromatograms (TICs) of PBC, PBCH and PBCH-GI were shown in Figure 3. The TICs profiles of PBCH and PBCH-GI were very similar, but very different from PBC (Figure 3A–3C). PBCH and PBCH-GI showed more peaks in the TICs than PBC. Di-/tripeptides were identified by comparing the retention time, exact mass and MS/MS spectra with standard substances or searching the online database. In order to understand the fragmentation process of di-/tripeptides, the MS/MS spectra and possible fragmentation pathways of dipeptide AW and tripeptide YPW were in Figure 4. During the collision cracking process, the main characteristic fragment ions of dipeptide AW were m/z 188.0704, 205.0970, 146.0599, 276.1340, 189.0740. For tripeptide YPW, the characteristic fragment ions were m/z 70.0658, 465.2130, 302.1496, 136.0756, 188.0704. It can be seen that the characteristic fragmentation pathway further confirms the identification of di-/tripeptides. Table S4 summarizes the information of all identified and tentatively identified di-/tripeptides from hydrolysates, including peptide sequence, retention time, accurate m/z value, and the major MS/MS fragment. All the detected di-/tripeptides can be found in the alpha and beta subunit of porcine hemoglobin. In total, there were 5, 144 and 150 di-/tripeptides sequences characterized in the PBC, PBCH and PBCH-GI, respectively. Five dipeptides identified in PBC with the sequence of VL, NL, DL, EL and FP were also found in PBCH and PBCH-GI. Six di-/tripeptides, i.e. AHK, ERM, ESF, FAK, GR and SV, were identified solely in PBCH-GI. These results show that the number of di-/tripeptides increased greatly after Alcalase hydrolysis. It may be due to the wide cleavage sites in Alcalase, which leads to the protein broken down. As expected, the number of di-/tripeptides was further increased after simulated GI digestion, which may be attributed to the degradation of macromolecular peptides into smaller peptides under the hydrolysis of digestive enzymes. Previous study has found that the DH of pig hemoglobin was increased after flavourzyme hydrolysis, coupling with a more complex chromatogram [29]. It is well known that DH indicates the degree of cleaved peptide bonds during proteolysis, and the higher the DH, the smaller peptides are released from hydrolysates. From the TICs plot (Figure 3A–3C), we also found that the chromatogram of hydrolysates is more complicated than that before hydrolysis, which may be related to the abundant small peptides in the hydrolysates.
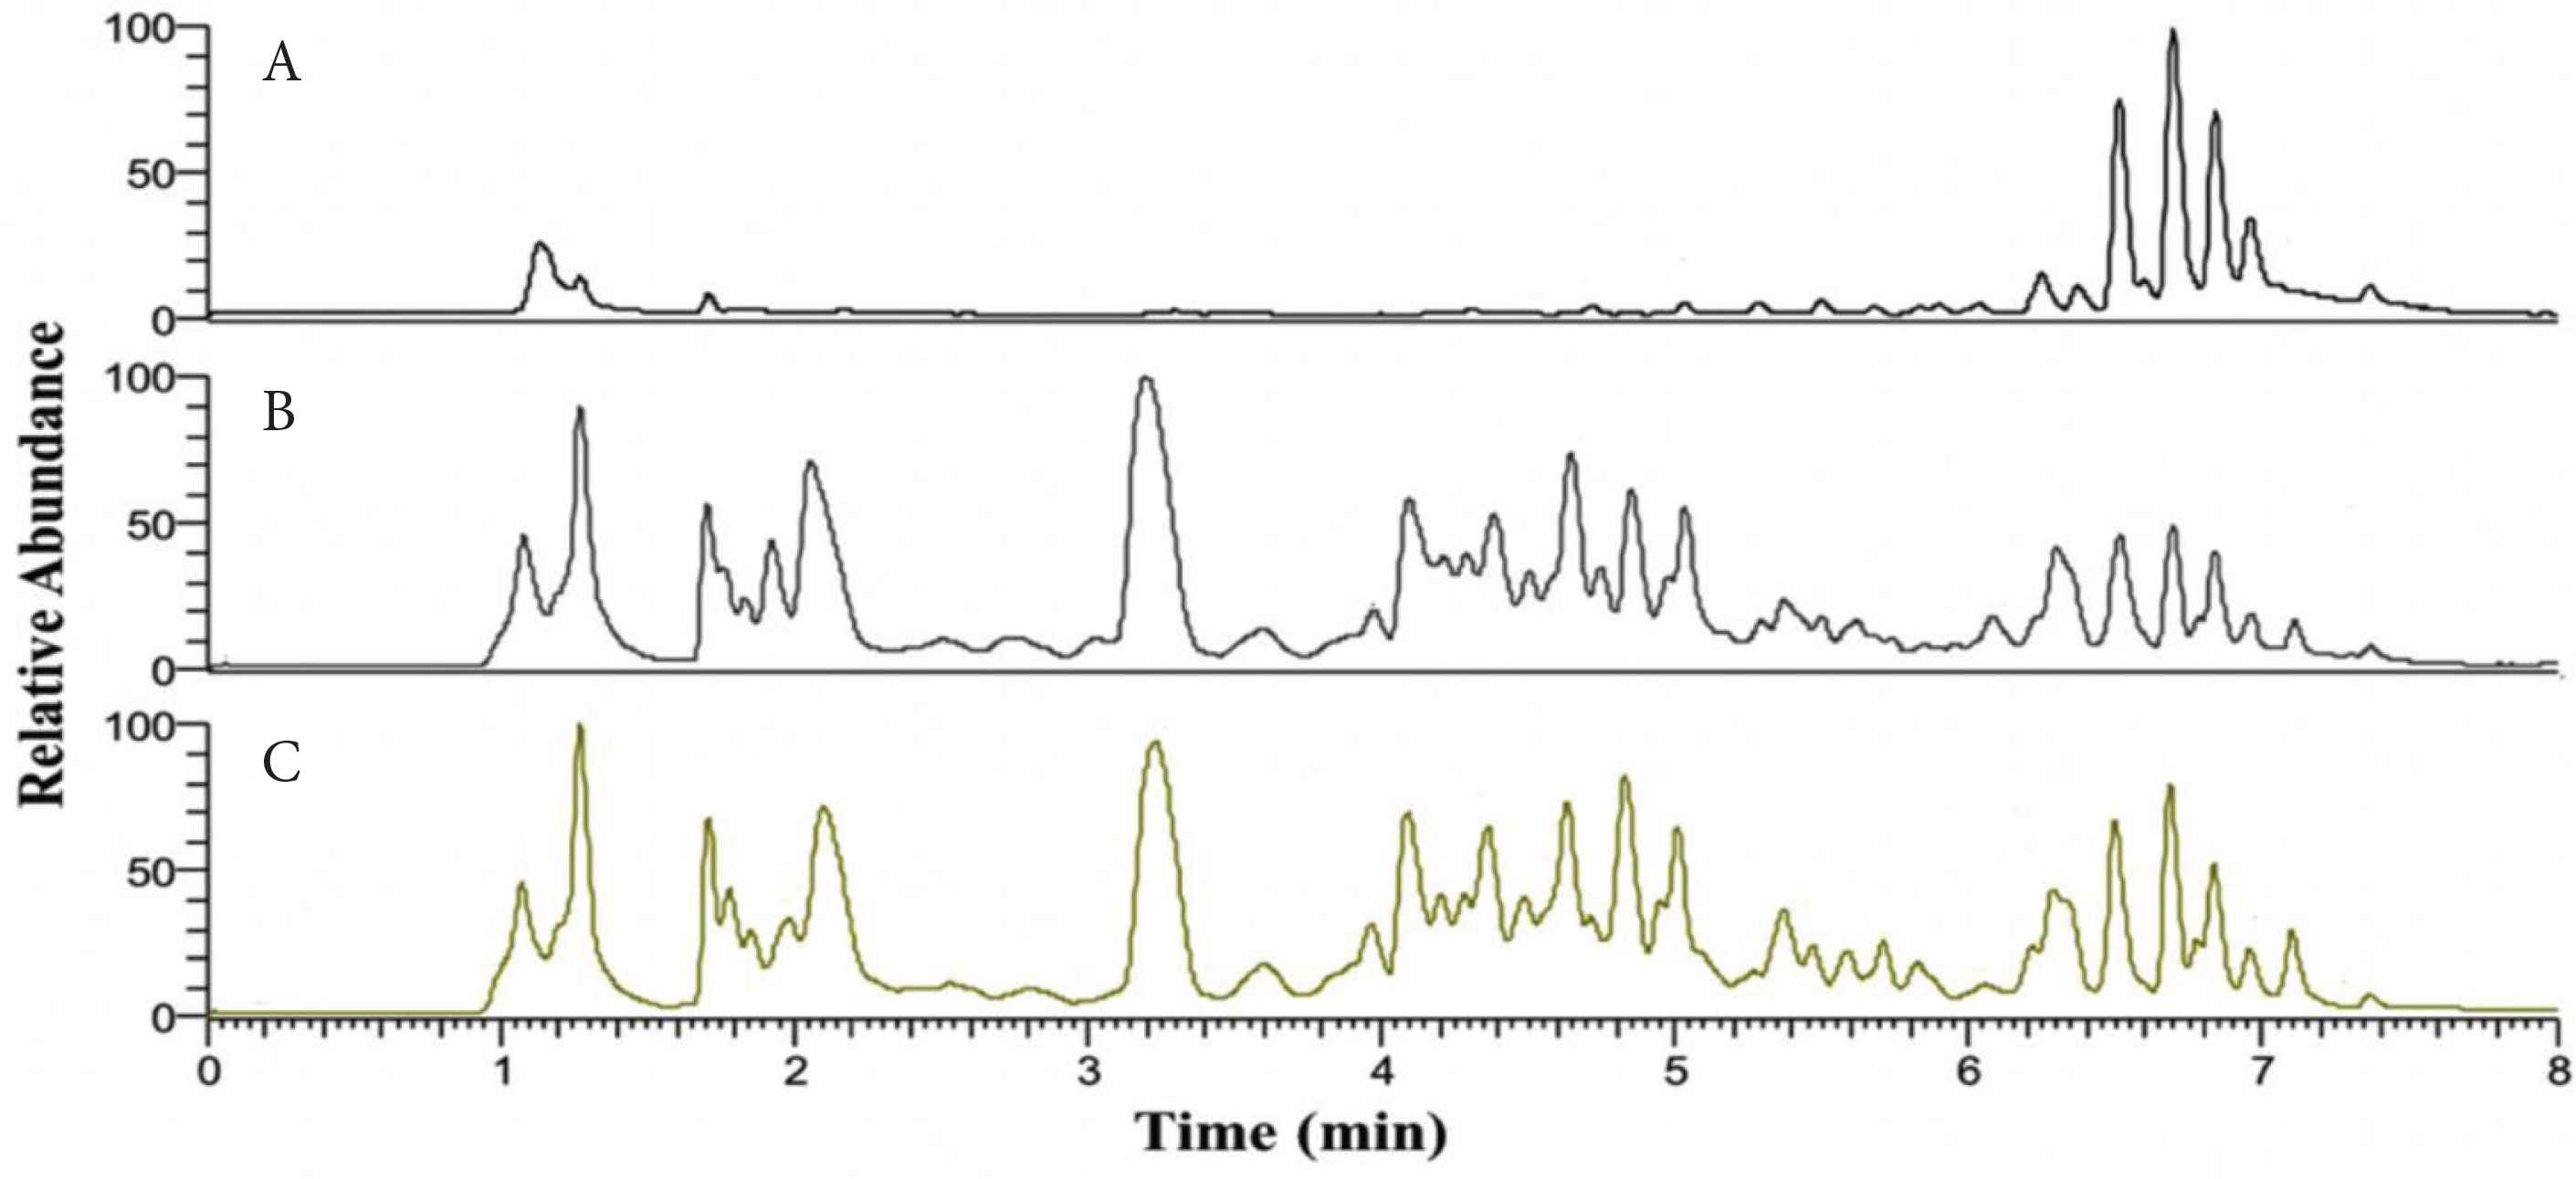
Total ion chromatograms of PBC (A), PBCH (B), PBCH-GI (C). PBC, pig blood cell; PBCH, pig blood cell hydrolysates; PBCH-GI, gastrointestinal-digested pig blood cell hydrolysates.

Identification of di-/tripeptides. The MS/MS spectra of the AW dipeptide (A) and the YPW tripeptide (C). The potential fragmentation pathways of the AW dipeptide (B) and the YPW tripeptide (D). The precursor ions and fragment ions are indicated by red and blue circles, respectively.
3.5. Quantitative Analysis of Di-/tripeptides from Hydrolysates
The quantitative results of 150 di-/tripeptides identified in PBCH and PBCH-GI were also displayed in Table S4. The relative quantification of di-/tripeptides were performed using the internal standard method. In order to compare the difference in the concentration of di-/tripeptides before and after GI digestion, 30 major di-/tripeptides identified from hydrolysates were selected for further analysis. The total content of 30 di-/tripeptides accounted for 78.24% of all identified di-/tripeptides in PBCH. The concentration of 30 di-/tripeptides in PBCH and PBCH-GI were 3886.79 and 4546.61 μg/mL, respectively. By comparing different molecular weight distributions of peptide fractions from casein after GI digestion, researchers found the percentage of <1000 Da peptides increased at the end of GI digestion [31]. Our results are consistent with this report. It can be seen from Figure 5 that after GI digestion, the concentration of di-/tripeptides FPH and VV were decreased, and the concentration of di-/tripeptides AW, KVL, LGL, LL, NL, QL, RL, SF, TL, TVL and VL were significantly increased. The concentration of other di-/tripeptides did not change significantly after GI digestion. The results suggest that most of these di-/tripeptides can resist to gastrointestinal digestion. These results are consistent with the former study, which reported that peptides derived from soybean proteins prepared by thermolysin were highly resistance to pepsin and trypsin, and these peptides were mainly dipeptides and tripeptides [32].
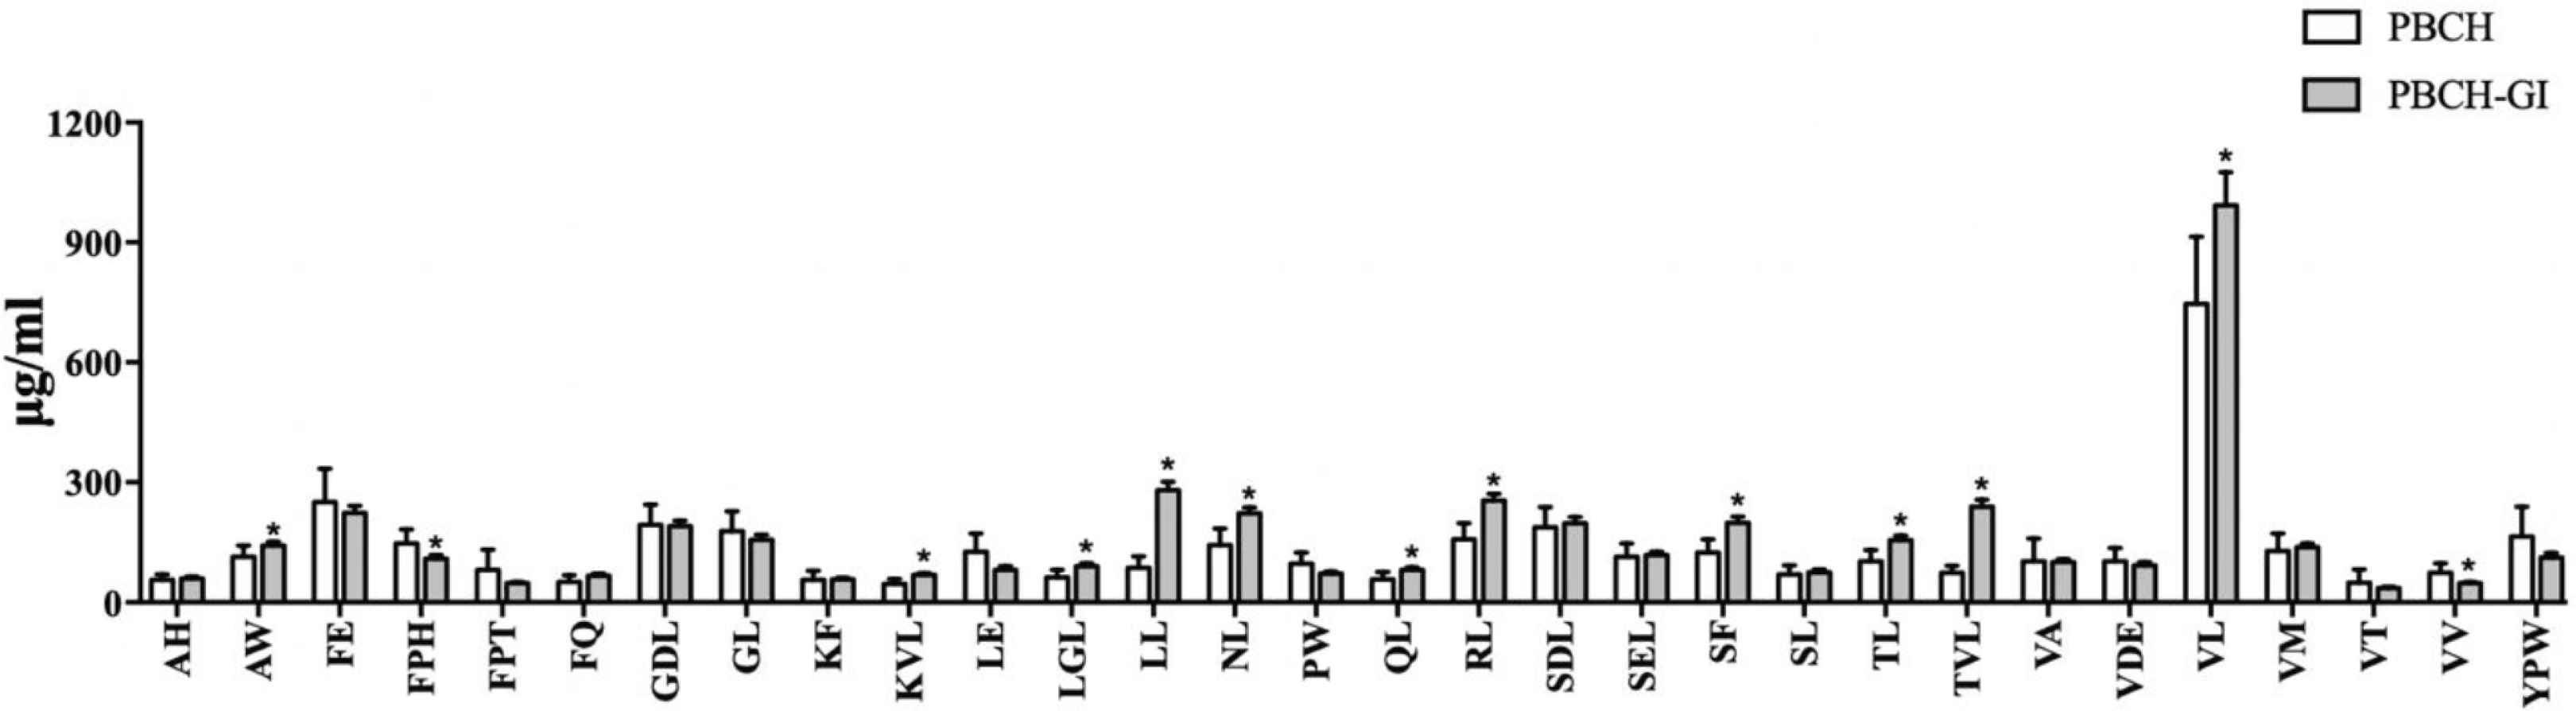
Comparative analysis of major di-/tripeptides in PBCH before and after GI digestion. Data are expressed as the mean ± SD, n = 6. * indicates p < 0.05 between PBCH and PBCH-GI. PBCH, pig blood cell hydrolysates; PBCH-GI, gastrointestinal-digested PBCH.
3.6. Transepithelial Transport of Di-/tripeptides
For the transport experiment, Caco-2 monolayers were used to evaluate the intestinal absorption of di-/tripeptides from PBCH-GI. The TEER values were measured to ensure the viability and integrity of cells monolayers. Figure 6A displays the chromatograms of PBCH-GI before and after 2 h transport. Most di-/tripeptides in PBCH-GI were observed in the basolateral side of the cell monolayers. In Figure 6A, we have labeled the peak positions of 30 major di-tripeptides on the chromatogram, which were marked with the numbers 1–30. All the 30 major di-/tripeptides, except for FPH, were detected in the basolateral side (Figure 6A). Previous research have pointed out that di-/tripeptides can be transported intact through the intestinal epithelium cells [33], which is confirmed in our study. After 2 h transport, the permeability of the 30 major di-/tripeptides from hydrolysates were shown in Figure 6B. It can be seen that the permeability of most di-/tripeptides is below 10%, which suggests that most di-/tripeptides may be utilized by cells or hydrolyzed into amino acids by multiple cytosolic hydrolases during the transport process. The peptides with highest permeability are SDL, GDL, KF, FE, with the permeability values of 10.80%, 10.62%, 8.79% and 7.54%, respectively. In addition, different di-/tripeptides were found to have different permeability through the enterocytes. In a previous study, the permeability of peptides fractions isolated from cooked chicken muscles was calculated to be about 1.0% [34]. The reported permeability of the casein-derived peptide fractions (MW < 500 Da) was 16.23%, and the permeability of the four synthetic peptides were IE 44.81%, SDK 21.68%, IV 9.50% and YPY 5.56%, respectively [35]. It can be seen from the results that the permeability of peptides is varied, which may be due to their different amino acid compositions. Study have indicated that the hydrolysis and transport of intact di-/tripeptides are highly variable and structure-dependent, and dipeptides with more hydrophobic residues such as Trp, Phe, Leu, or Val mostly showed rapid cleavage, whereas dipeptides containing Gly residues displayed high hydrolysis resistance [33]. And the specific reasons for the different permeability of different di-/tripeptides need further study. The bioactive activities of the di-/tripeptides from basolateral permeates were searched from the database of bioactive peptides (BIOPEP) and related published literatures [25]. The bioactive activities of these di-/tripeptides can be seen from Table 1, in which GDL, AH, PW and AW have antioxidant properties. The four antioxidant di-/tripeptides were transported intact through the Caco-2 cells monolayers, with the permeability of 10.62%, 4.10%, 5.35% and 0.96%, respectively. Some other di-/tripeptides have also been reported to have activities such as Angiotensin-converting Enzyme (ACE) inhibitory activity and dipeptidyl peptidase-IV inhibitory activity.
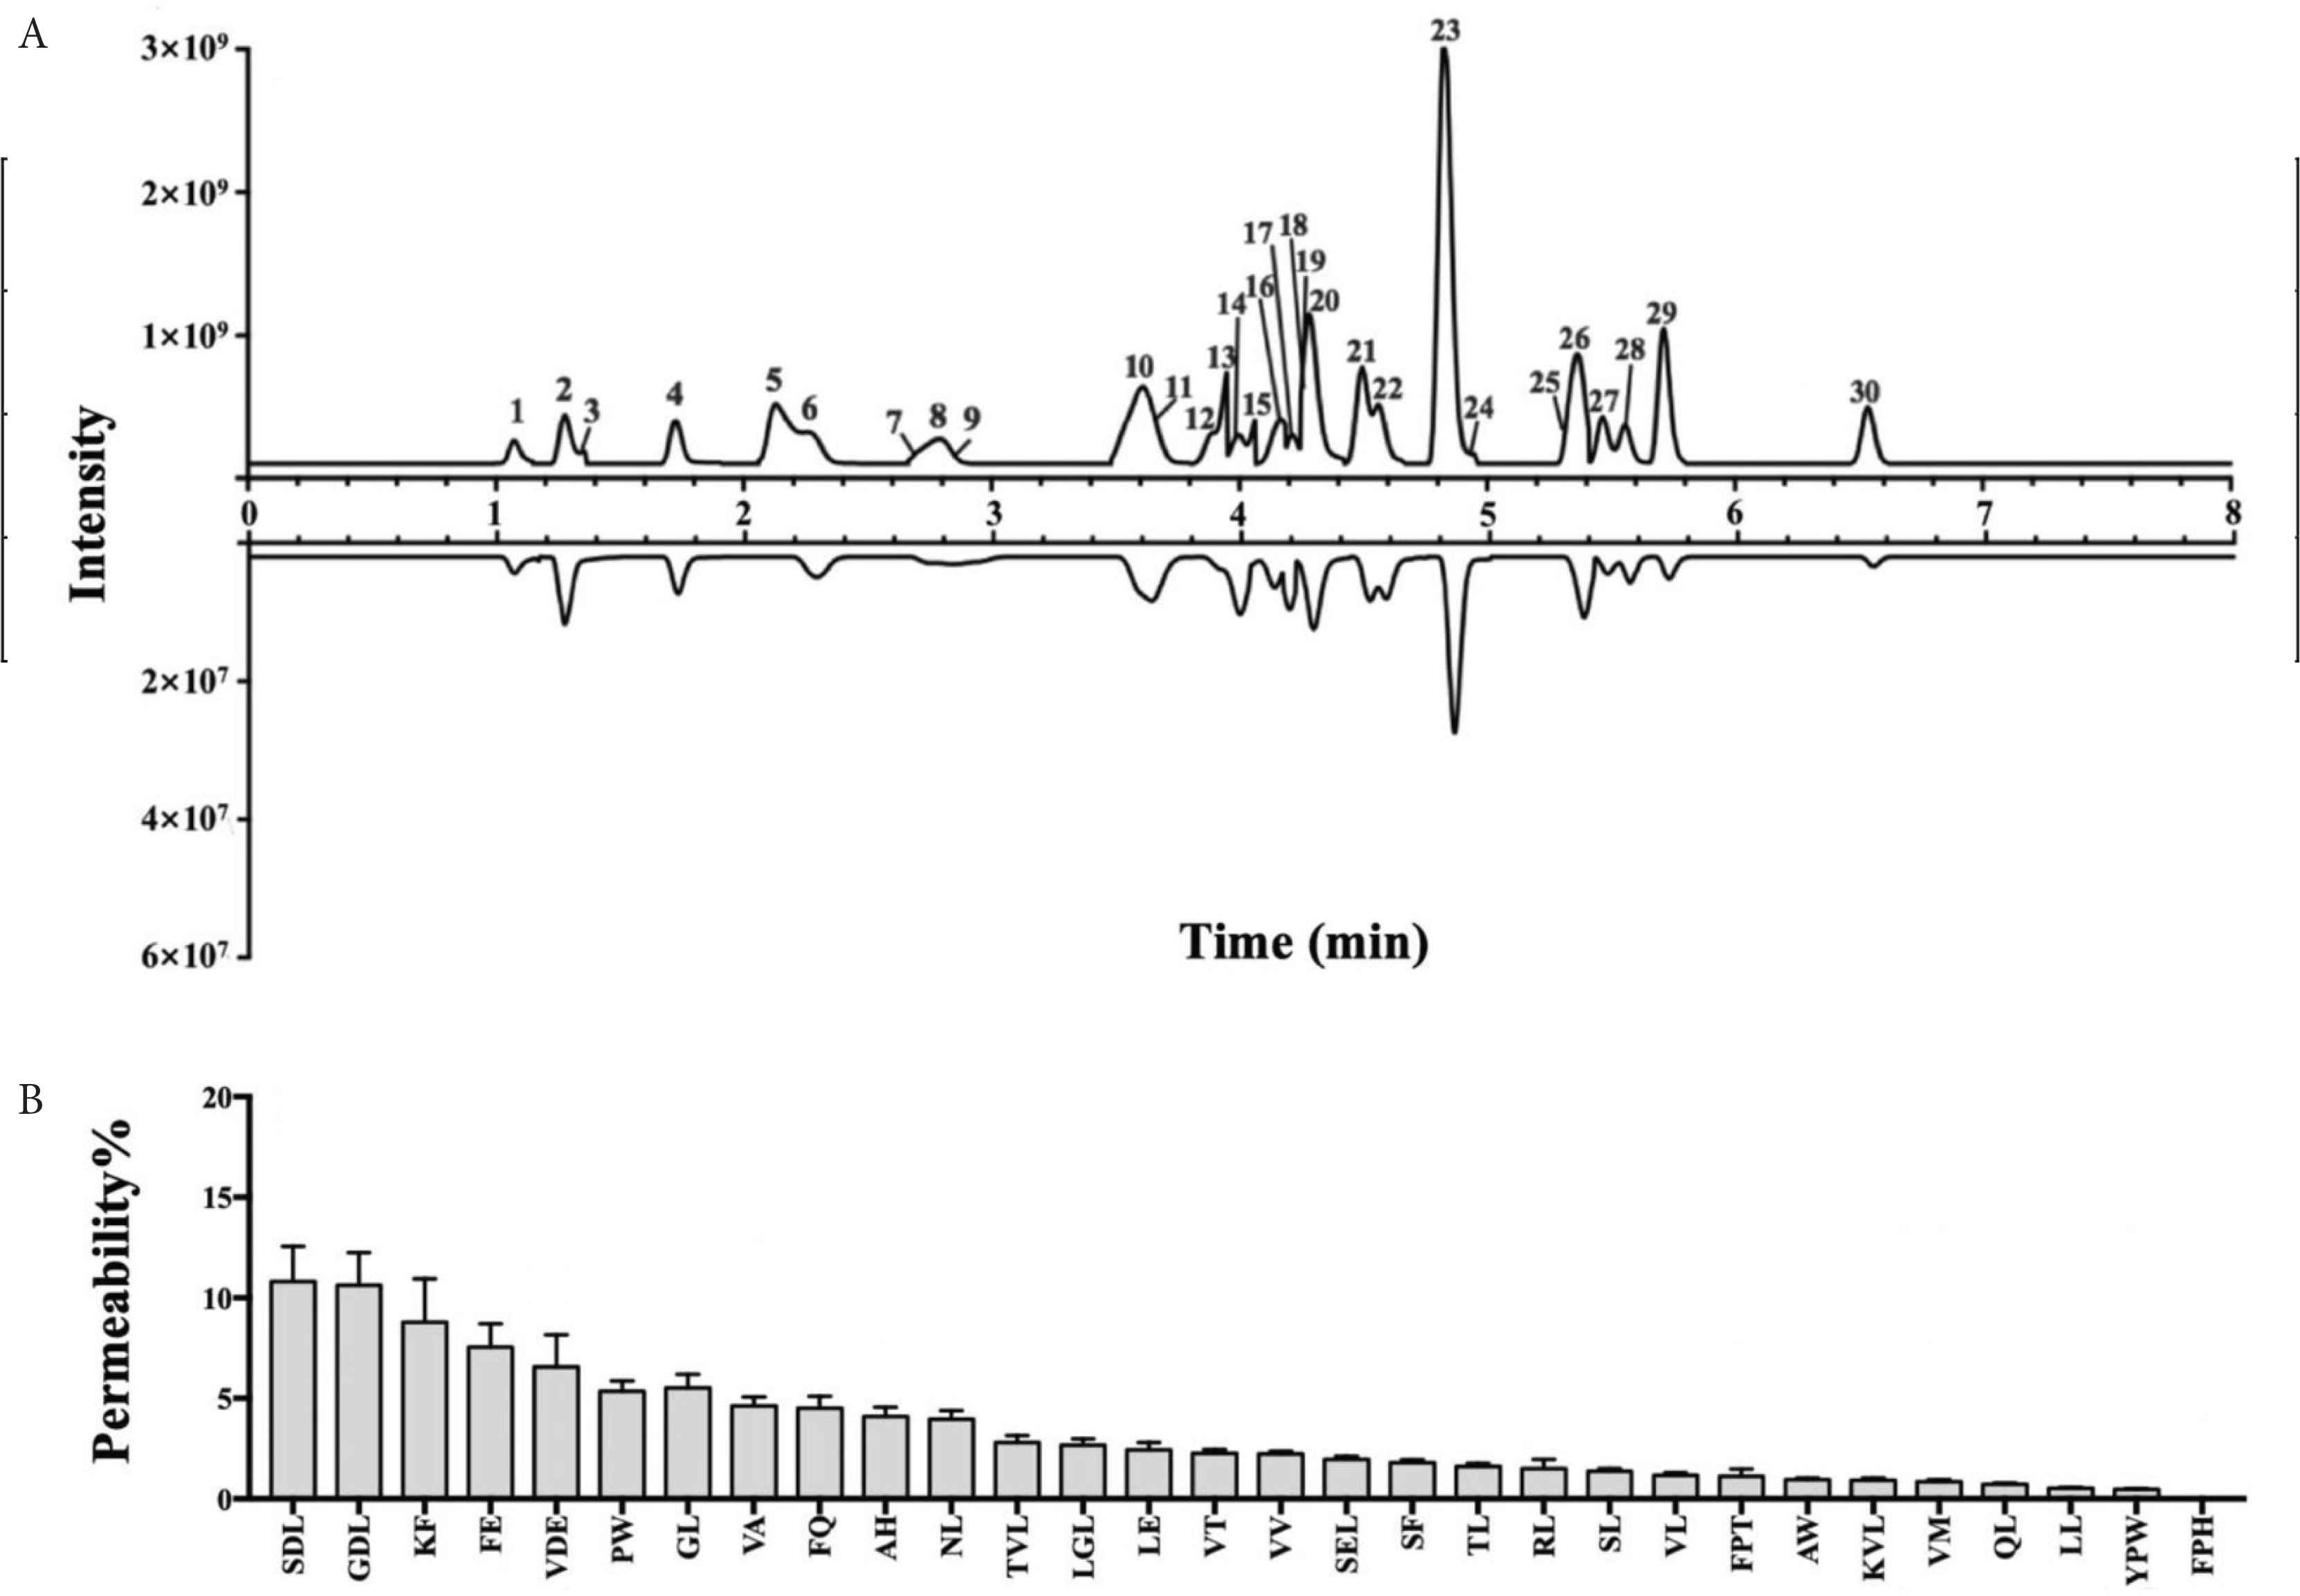
Base peak chromatograms of PBCH-GI on the apical side before transport and the basolateral side after 2 h of transport (A). Permeability of di-/tripeptides identified from PBCH-GI (B). Numbers 1–30 indicate 30 different di-/tripeptides identified from the hydrolysates. Data are expressed as the mean ± SD, n = 3. PBCH-GI, gastrointestinal-digested pig blood cells hydrolysates.
| Peak no. | Sequence | m/z [M + H]+ | Rt (min) | Activitiesa | Parent proteinb |
|---|---|---|---|---|---|
| 1 | AH | 227.1137 | 1.15 | Antioxidative, ACEI, DPP-IVI | α-; β- |
| 2 | VA | 189.1233 | 1.26 | DPP-IVI | α-; β- |
| 3 | VT | 219.1338 | 1.27 | DPP-IVI | α- |
| 4 | VDE | 361.1714 | 1.74 | ND | β- |
| 5 | RL | 288.2027 | 2.24 | ACEI, DPP-IVI | α- |
| 6 | LE | 261.1444 | 2.34 | ND | α- |
| 7 | VV | 217.1547 | 2.69 | DPP-IVI | β- |
| 8 | FQ | 294.1450 | 2.80 | ACEI, DPP-IVI | β- |
| 9 | KF | 294.1808 | 2.95 | ACEI, DPP-IVI | α- |
| 10 | FE | 295.1286 | 3.47 | ACEI | β- |
| 11 | VM | 249.1266 | 3.51 | DPP-IVI | β- |
| 12 | SL | 219.1340 | 3.88 | DPP-IVI | α- |
| 13 | NL | 246.1451 | 3.98 | DPP-IVI | α-; β- |
| 14 | QL | 260.1599 | 4.00 | DPP-IVI | β- |
| 15 | TL | 233.1492 | 4.09 | DPP-IVI | α- |
| 16 | GL | 189.1235 | 4.18 | DPP-IVI | β- |
| 17 | FPH | 400.1975 | 4.19 | ND | α- |
| 18 | KVL | 359.2648 | 4.22 | ND | β- |
| 19 | GDL | 304.1498 | 4.28 | Antioxidative | β- |
| 20 | SDL | 334.1600 | 4.30 | ND | α-; β- |
| 21 | SF | 253.1175 | 4.46 | ACEI, DPP-IVI | β- |
| 22 | SEL | 348.1764 | 4.53 | ND | β- |
| 23 | VL | 231.1702 | 4.78 | DPP-IVI | α-; β- |
| 24 | FPT | 364.1865 | 5.13 | ND | α- |
| 25 | AW | 276.1338 | 5.36 | Antioxidative, ACEI, DPP-IVI | α-; β- |
| 26 | TVL | 332.2180 | 5.37 | ND | α- |
| 27 | LGL | 302.2074 | 5.46 | ND | β- |
| 28 | PW | 302.1495 | 5.56 | Antioxidative, DPP-IVI | β- |
| 29 | LL | 245.1856 | 5.73 | DPP-IVI | α-; β- |
| 30 | YPW | 465.2128 | 6.55 | ND | β- |
Peptides activities were searching from the BIOPEP-UWM database and published literatures.
α- means porcine hemoglobin (alpha subunit), β- means porcine hemoglobin (beta subunit).
ACEI, angiotensin-converting enzyme inhibitory activity; DPP-IVI, dipeptidyl peptidase-IV inhibitory activity; ND indicates that the peptide is not included in the BIOPEP database.
Identification of major di-/tripeptides from the basolateral permeates
4. CONCLUSION
Pig blood cells hydrolysates display strong antioxidant properties, especially the scavenging effect on chemical free radicals and decreased ROS levels under conditions of oxidative stress in Caco-2 cells. After simulated GI digestion, the scavenging activities of PBCH were decreased. Di-/tripeptides from PBC, PBCH and PBCH-GI were accurate identified by UPLC–Orbitrap–MS/MS, which showed high resistance to GI digestion. Additionally, the permeability of di-/tripeptides through intestinal epithelial cells were found to be 0.48–10.80%, and the enterocyte-permeated di-/tripeptides exerted antioxidant activities. The permeability of four antioxidant di-/tripeptides GDL, AH, PW and AW were 10.62%, 4.10%, 5.35% and 0.96%, respectively. It is, to the best of our knowledge, the first time to systematically identify di-/tripeptides in the hydrolysates of PBC and to study the permeability of them. This study clarified that PBCH contains absorbable and antioxidative di-/tripeptides, exerting high nutritional value, provided us a new technical route to better utilize the PBC resources, and the PBCH can be taken as a promising functional food additive. Further studies are needed to study the in vivo bioavailability of di-/tripeptides and clarify the specific structure or amino acid compositions that affect peptides permeability.
CONFLICTS OF INTEREST
The authors declare they have no conflicts of interest.
AUTHORS’ CONTRIBUTION
XN and BD conceived and designed the study. XN, ZZ, ZX, YC, PL, LZ and ZX contributed in literature search, experimental data collection and analysis. XN contributed in manuscript writing. BD, JD and CT reviewed and modified the manuscript.
ACKNOWLEDGMENT
The authors gratefully thank the National Key R&D Program of China (2018YFD0500600), the National Natural Science Foundation of China (Grant Nos. 31790411), the Natural Science Foundation of Guangdong Province (Grant Nos. 2020A1515010322 and 2017A030310410), the Innovation Team Project in Universities of Guangdong Province (Grant Nos. 2017KCXTD002) and the Guangdong Provincial Promotion Project on Preservation and Utilization of Local Breed of Livestock and Poultry. The studies meet with the approval of the University’s Review Board.
SUPPLEMENTARY MATERIALS
Tables listing the results for optimizing the extraction conditions (Tables S1–S3) and the information of all identified di-/tripeptides from hydrolysates (Table S4).
| Variables | Code | Coded levels | ||
|---|---|---|---|---|
| −1 | 0 | +1 | ||
| Time (h) | A | 20 | 25 | 30 |
| pH | B | 8 | 9 | 10 |
| Temperature (°C) | C | 30 | 40 | 50 |
| E/S (w/w) | D | 1 | 2.5 | 4 |
The levels of the independent variables in Box–Behnken design
| Run | A | B | C | D | DH (%)1 | |
|---|---|---|---|---|---|---|
| Experimental | Predicted | |||||
| 1 | 25 | 9 | 40 | 2.5 | 45.79 | 46.49 |
| 2 | 25 | 8 | 50 | 2.5 | 34.93 | 36.34 |
| 3 | 30 | 9 | 40 | 1 | 44.90 | 43.38 |
| 4 | 25 | 8 | 40 | 4 | 44.69 | 43.91 |
| 5 | 25 | 9 | 40 | 2.5 | 47.32 | 46.49 |
| 6 | 30 | 10 | 40 | 2.5 | 49.13 | 49.74 |
| 7 | 20 | 9 | 30 | 2.5 | 30.00 | 29.29 |
| 8 | 30 | 8 | 40 | 2.5 | 47.35 | 47.33 |
| 9 | 25 | 10 | 50 | 2.5 | 36.88 | 36.61 |
| 10 | 25 | 9 | 30 | 4 | 35.95 | 36.80 |
| 11 | 30 | 9 | 50 | 2.5 | 38.91 | 39.51 |
| 12 | 25 | 10 | 40 | 1 | 40.24 | 40.91 |
| 13 | 30 | 9 | 30 | 2.5 | 38.18 | 39.21 |
| 14 | 25 | 8 | 30 | 2.5 | 33.18 | 32.79 |
| 15 | 25 | 10 | 30 | 2.5 | 39.17 | 37.11 |
| 16 | 20 | 8 | 40 | 2.5 | 38.59 | 38.75 |
| 17 | 25 | 9 | 40 | 2.5 | 46.65 | 46.49 |
| 18 | 20 | 9 | 40 | 1 | 32.86 | 32.90 |
| 19 | 20 | 9 | 50 | 2.5 | 33.18 | 32.04 |
| 20 | 30 | 9 | 40 | 4 | 47.58 | 46.89 |
| 21 | 25 | 9 | 40 | 2.5 | 46.52 | 46.49 |
| 22 | 25 | 9 | 40 | 2.5 | 46.14 | 46.49 |
| 23 | 25 | 8 | 40 | 1 | 37.13 | 36.76 |
| 24 | 25 | 9 | 50 | 4 | 33.63 | 33.12 |
| 25 | 20 | 10 | 40 | 2.5 | 40.13 | 40.92 |
| 26 | 20 | 9 | 40 | 4 | 39.09 | 39.96 |
| 27 | 25 | 10 | 40 | 4 | 44.08 | 44.34 |
| 28 | 25 | 9 | 30 | 1 | 25.03 | 26.30 |
| 29 | 25 | 9 | 50 | 1 | 33.12 | 33.03 |
DH (%) represents the average degree of hydrolysis of triplicate experiments. A, B, C and D are the coded variables, indicating incubation period, pH, temperature and enzyme-to-substrate ratio (E/S, w/w), respectively.
Experimental design and measured values for the response variable
| Variables | Sum of squares | df | Mean square | F-value | p-value |
|---|---|---|---|---|---|
| Model | 1070.74 | 14 | 76.48 | 54.92 | <0.0001 |
| A | 227.12 | 1 | 227.12 | 163.08 | <0.0001 |
| B | 15.73 | 1 | 15.73 | 11.30 | 0.0047 |
| C | 6.97 | 1 | 6.97 | 5.01 | 0.0420 |
| D | 83.95 | 1 | 83.95 | 60.28 | <0.0001 |
| AB | 0.01 | 1 | 0.01 | 0.01 | 0.9210 |
| AC | 1.50 | 1 | 1.50 | 1.08 | 0.3170 |
| AD | 3.16 | 1 | 3.16 | 2.27 | 0.1540 |
| BC | 4.09 | 1 | 4.09 | 2.93 | 0.1090 |
| BD | 3.46 | 1 | 3.46 | 2.48 | 0.1370 |
| CD | 27.12 | 1 | 27.12 | 19.47 | 0.0006 |
| A2 | 14.64 | 1 | 14.64 | 10.51 | 0.0059 |
| B2 | 4.19 | 1 | 4.19 | 3.01 | 0.1050 |
| C2 | 644.84 | 1 | 644.84 | 463.03 | <0.0001 |
| D2 | 114.59 | 1 | 114.59 | 82.28 | <0.0001 |
| Residual | 19.50 | 14 | 1.39 | ||
| Lack of fit | 18.17 | 10 | 1.82 | 5.47 | 0.0580 |
| Pure error | 1.33 | 4 | 0.33 | ||
| Corrected total sum of squares | 1090.24 | 28 | |||
| R2 | 0.98 | ||||
| Adjusted R2 | 0.96 | ||||
| Predicted R2 | 0.90 | ||||
| CV (%) | 2.97 |
p < 0.001 means extremely significant; p < 0.01 means very significant; p < 0.05 means significant. df refers to degree of freedom. A, B, C and D are the coded variables, refer to incubation period, pH, temperature and enzyme-to-substrate ratio (E/S, w/w), respectively.
Polynomial equation:
ANOVA for response surface quadratic polynomial mode
| Peak no. | Sequence | Rt (min) | m/z [M + H]+ | Error (ppm) | Molecular formula | MS/MS fragments | Parent protein | Concentration (μg/mL) | |
|---|---|---|---|---|---|---|---|---|---|
| PBCH | PBCH-GI | ||||||||
| 1 | AH | 1.15 | 227.1137 | −0.955 | C9H15O3N4 | 156.0766, 110.0715, 227.1136, 209.1031, 226.0799 | α-; β- | 56.72 ± 12.56 | 59.6 ± 4.98 |
| 2 | VA | 1.26 | 189.1233 | −0.289 | C8H17O3N2 | 72.0814, 112.0759, 70.0658, 189.1231, 55.0550 | α-; β- | 102.98 ± 56.47 | 100.89 ± 7.36 |
| 3 | VT | 1.27 | 219.1338 | −0.792 | C9H19O4N2 | 72.0814, 86.0969, 120.0656, 55.0550, 148.0606 | α- | 36.46 ± 10.97 | 35.71 ± 2.68 |
| 4 | VDE | 1.74 | 361.1714 | −1.067 | C14H25O7N4 | 72.0814, 148.0603, 361.1714, 130.0499, 205.0817 | β- | 102.70 ± 32.87 | 92.26 ± 8.88 |
| 5 | RL | 2.24 | 288.2027 | −0.993 | C12H26O3N5 | 70.0658, 288.2027, 175.1188, 60.0564, 289.2058 | α- | 158.13 ± 39.65 | 254.71 ± 17.06 |
| 6 | LE | 2.34 | 261.1444 | −0.233 | C11H21O5N2 | 86.0969, 148.0603, 84.0813, 261.1444, 60.0452 | α- | 127.05 ± 44.98 | 81.06 ± 8.95 |
| 7 | VV | 2.69 | 217.1547 | −0.088 | C10H21O3N2 | 72.0814, 175.1187, 200.0708, 70.0657, 91.0547 | β- | 74.12 ± 23.56 | 47.65 ± 3.47 |
| 8 | FQ | 2.80 | 294.1450 | 0.433 | C14H20O4N3 | 120.0809, 147.0763, 130.0499, 84.0813, 294.1446 | β- | 51.42 ± 15.81 | 67.18 ± 4.95 |
| 9 | KF | 2.95 | 294.1808 | −1.353 | C15H24O3N3 | 84.0813, 294.1808, 129.1023, 120.0810, 277.1538 | α- | 56.44 ± 22.59 | 57.55 ± 4.06 |
| 10 | FE | 3.47 | 295.1286 | −0.739 | C14H19O5N2 | 120.0809, 295.1286, 121.0843, 148.0603, 84.0813 | β- | 250.46 ± 83.44 | 223.53 ± 17.49 |
| 11 | VM | 3.51 | 249.1266 | −0.44 | C10H21O3N2S | 72.0814, 150.0582, 55.0550, 249.1266, 104.0531 | β- | 128.42 ± 43.81 | 137.6 ± 9.59 |
| 12 | SL | 3.88 | 219.1340 | 0.121 | C9H19O4N2 | 74.0607, 132.1019, 86.0969, 233.1492, 56.0502 | α- | 69.39 ± 23.30 | 75.28 ± 7.10 |
| 13 | NL | 3.98 | 246.1451 | 0.883 | C10H20O4N3 | 86.0969, 212.0916, 166.0863, 132.1017, 87.0558 | α-; β- | 143.11 ± 41.09 | 222.93 ± 14.59 |
| 14 | QL | 4.00 | 260.1599 | −1.356 | C11H22O4N3 | 101.0713, 86.0969, 132.1019, 129.0659,84.0449 | β- | 57.05 ± 18.67 | 81.29 ± 5.65 |
| 15 | TL | 4.09 | 233.1492 | −1.517 | C10H21O4N2 | 74.0607, 132.1019, 86.0969, 233.1492, 56.0502 | α- | 102.41 ± 28.02 | 155.21 ± 11.77 |
| 16 | GL | 4.18 | 189.1235 | 0.535 | C8H17O3N2 | 86.0969, 132.1019, 143.1178, 87.1001, 72.0814 | β- | 178.11 ± 49.38 | 157.06 ± 11.63 |
| 17 | FPH | 4.19 | 400.1975 | −1.051 | C20H26O4N5 | 156.0767, 110.0715, 70.0658, 400.1975, 120.0810 | α- | 147.21 ± 35.63 | 109.55 ± 8.30 |
| 18 | KVL | 4.22 | 359.2648 | −1.342 | C17H35O4N4 | 84.0813, 129.1022, 359.2648, 72.0814, 86.0969 | β- | 46.33 ± 12.42 | 68.25 ± 4.76 |
| 19 | GDL | 4.28 | 304.1498 | −0.327 | C12H22O6N3 | 86.0969, 127.0503, 132.1019, 173.0557, 88.0398 | β- | 194.19 ± 50.70 | 191.11 ± 13.14 |
| 20 | SDL | 4.30 | 334.1600 | 1.485 | C11H22O6N6 | 86.0969, 157.0608, 203.0660, 60.0451, 132.1019 | α-; β- | 187.3 ± 50.48 | 198.3 ± 14.63 |
| 21 | SF | 4.46 | 253.1175 | −3.135 | C12H17O4N2 | 120.0809, 166.0861, 60.0451, 207.1123, 253.1161 | β- | 124.37 ± 32.93 | 198.84 ± 15.69 |
| 22 | SEL | 4.53 | 348.1764 | −0.392 | C14H26O7N3 | 217.0817, 189.0869, 126.0550, 60.0452, 154.0499 | β- | 114.05 ± 33.41 | 118.37 ± 8.64 |
| 23 | VL | 4.78 | 231.1702 | −0.602 | C11H23O3N2 | 72.0814, 55.0550, 132.1019, 86.0969, 231.1702 | α-; β- | 698.08 ± 191.83 | 827.19 ± 411.86 |
| 24 | FPT | 5.13 | 364.1865 | −0.487 | C18H26O5N3 | 70.0658, 217.1174, 120.0809, 364.1865, 245.1283 | α- | 80.81 ± 51.26 | 48.13 ± 3.31 |
| 25 | AW | 5.36 | 276.1338 | 0.152 | C14H18O3N3 | 188.0704, 205.0970, 146.0599, 276.1340, 189.0740 | α-; β- | 114.68 ± 27.56 | 141.77 ± 9.27 |
| 26 | TVL | 5.37 | 332.2180 | −0.113 | C15H30O5N3 | 72.0814, 112.0759, 70.0658, 189.1231, 55.0550 | α- | 73.79 ± 18.04 | 239.78 ± 16.71 |
| 27 | LGL | 5.46 | 302.2074 | −0.208 | C14H28O4N3 | 72.0814, 143.1178, 171.1126, 86.0969, 132.1020 | β- | 62.88 ± 18.09 | 90.44 ± 6.79 |
| 28 | PW | 5.56 | 302.1495 | −1.45 | C16H20O3N3 | 70.0658, 72.0814, 143.1178, 171.1126, 302.1495 | β- | 96.85 ± 27.38 | 72.11 ± 5.15 |
| 29 | LL | 5.73 | 245.1856 | −0.16 | C12H25O3N2 | 86.0969, 245.1856, 87.1001, 132.1019, 199.1803 | α-; β- | 86.09 ± 28.73 | 280.66 ± 20.84 |
| 30 | YPW | 6.55 | 465.2128 | −1.024 | C25H29O5N4 | 70.0658, 465.2130, 302.1496, 136.0756, 188.0704 | β- | 165.19 ± 74.38 | 112.6 ± 10.45 |
| 31 | AA | 1.19 | 161.0920 | −0.241 | C6H13O3N2 | 90.0554, 161.0920, 115.0869, 103.0392, 60.0814 | α-; β- | 30.73 ± 8.33 | 31.27 ± 2.07 |
| 32 | AAW | 5.55 | 347.1720 | 1.695 | C17H23O4N4 | 188.0704, 205.0970, 146.0600, 115.0868, 159.0916 | α- | 3.36 ± 0.89 | 16.34 ± 1.11 |
| 33 | AE | 1.23 | 219.0979 | 0.42 | C8H15O5N2 | 148.0604, 84.0449, 200.1028, 130.0498, 201.0874 | α-; β- | 13.47 ± 3.16 | 10.17 ± 0.80 |
| 34 | AEE | 1.33 | 348.1396 | −1.583 | C13H22O8N3 | 102.0553, 173.0920, 201.0869, 84.0449, 148.0603 | β- | 34.02 ± 8.15 | 29.25 ± 1.92 |
| 35 | AF | 4.71 | 237.1231 | −1.429 | C12H17O3N2 | 120.0810, 166.0863, 121.0843, 167.0897, 237.1228 | β- | 12.45 ± 4.10 | 19.25 ± 1.32 |
| 36 | AK | 1.07 | 218.1498 | −0.633 | C9H20O3N3 | 84.0813, 129.1022, 218.1498, 147.1127, 130.0863 | β- | 11.34 ± 2.50 | 11.76 ± 1.08 |
| 37 | AKL | 2.32 | 331.2339 | −0.278 | C15H31O4N4 | 84.0813, 129.1023, 331.2339, 86.0969, 101.1075 | β- | 3.36 ± 1.13 | 8.04 ± 0.63 |
| 38 | AL | 4.04 | 203.1395 | −0.29 | C9H19O3N2 | 132.1019, 86.0969, 157.1335, 203.1390, 133.1055 | α-; β- | 3.13 ± 1.36 | 5.03 ± 0.37 |
| 39 | ALE | 3.48 | 332.1813 | −0.458 | C14H26O6N3 | 86.0969, 157.1334, 185.1283, 148.0603, 129.1023 | α- | 8.15 ± 2.72 | 15.06 ± 1.20 |
| 40 | ANV | 2.46 | 303.1663 | −0.021 | C12H23O5N4 | 186.0872, 72.0814, 141.0658, 240.1340, 152.0706 | α- | 2.00 ± 0.74 | 2.76 ± 0.24 |
| 41 | AR | 1.10 | 246.1559 | −0.634 | C9H20O3N5 | 246.1559, 175.1189, 110.0716, 70.0658, 84.0813 | β- | 1.90 ± 0.47 | 8.46 ± 0.73 |
| 42 | AVM | 4.51 | 320.1634 | −0.105 | C13H26O4N3S | 72.0814, 143.1178, 171.1126, 150.0582, 104.0532 | β- | 8.61 ± 2.48 | 29.83 ± 2.16 |
| 43 | DAL | 4.67 | 318.1656 | −0.132 | C13H24O6N3 | 159.0765, 86.097, 187.0714, 132.102, 88.0398 | α- | 10.96 ± 3.44 | 21.16 ± 1.56 |
| 44 | DKF | 3.19 | 409.2077 | −1.493 | C19H29O6N4 | 120.0809, 409.2076, 84.0813, 130.0862, 147.1126 | α- | 17.47 ± 5.88 | 18.89 ± 1.35 |
| 45 | DL | 4.24 | 247.1287 | 1.343 | C10H19O5N2 | 86.0969, 88.0398, 132.102, 201.1234, 166.0862 | α-; β- | 13.73 ± 3.74 | 15.09 ± 1.11 |
| 46 | DLH | 1.79 | 384.1868 | −1.718 | C16H26O6N5 | 110.0715, 156.0767, 384.1871, 86.0969, 201.1234 | α- | 8.45 ± 2.66 | 8.74 ± 0.68 |
| 47 | DPV | 3.54 | 330.1656 | −0.945 | C14H24O6N3 | 70.0658, 330.1656, 185.0921, 215.1391, 84.0814 | α- | 17.69 ± 6.03 | 11.91 ± 0.84 |
| 48 | DQL | 4.44 | 375.1872 | −0.708 | C15H27O7N4 | 86.0969, 244.0927, 88.0398, 375.1872, 132.1019 | β- | 4.51 ± 1.24 | 3.50 ± 0.23 |
| 49 | EAL | 4.72 | 332.1815 | −0.277 | C14H26O6N3 | 86.0969, 132.1019, 84.0450, 155.0814, 203.1389 | α-; β- | 8.09 ± 2.53 | 9.54 ± 0.78 |
| 50 | EK | 1.12 | 276.1549 | −1.801 | C11H22O5N3 | 84.0813, 129.1023, 276.1544, 258.1439, 257.1604 | β- | 8.89 ± 1.85 | 5.50 ± 0.46 |
| 51 | EL | 3.80 | 261.1446 | −0.568 | C11H21O5N2 | 86.0969, 132.1019, 84.045, 261.1443, 198.1123 | β- | 2.40 ± 1.02 | 4.97 ± 0.47 |
| 52 | FA | 3.88 | 237.1231 | −0.965 | C12H17O3N2 | 120.0809, 121.0844, 237.1231, 86.0969, 72.0815 | β- | 37.83 ± 11.07 | 53.68 ± 3.61 |
| 53 | FF | 6.49 | 313.1542 | −0.891 | C18H21O3N2 | 120.0809, 121.0843, 313.1544, 166.0863, 103.0547 | β- | 4.91 ± 1.23 | 23.36 ± 1.91 |
| 54 | FFE | 5.82 | 442.1970 | −0.615 | C23H28O6N3 | 120.0809, 442.1970, 267.1488, 295.1471, 121.0844 | β- | 3.35 ± 0.91 | 35.23 ± 2.92 |
| 55 | FG | 4.00 | 223.1072 | −2.281 | C11H15O3N2 | 120.0809, 84.0814, 294.1812, 147.1128, 129.1023 | β- | 1.86 ± 0.56 | 1.64 ± 0.11 |
| 56 | FK | 1.72 | 294.1812 | −0.232 | C15H24O3N3 | 120.0809, 84.0814, 294.1812, 147.1128, 129.1023 | α- | 9.36 ± 3.11 | 3.57 ± 0.27 |
| 57 | FL | 6.00 | 279.1701 | 0.003 | C15H23O3N2 | 86.0969, 69.0706, 120.0809, 279.1703, 166.0862 | α- | 4.00 ± 1.14 | 54.7 ± 2.58 |
| 58 | FLA | 6.68 | 350.2072 | −0.636 | C18H28O4N3 | 120.0809, 86.0969, 219.1126, 191.1177, 132.1019 | α- | 0.77 ± 0.27 | 2.05 ± 0.16 |
| 59 | FLG | 6.58 | 336.1912 | −2.745 | C17H26O4N3 | 120.0809, 177.1021, 205.0972, 86.0969, 121.0844 | α- | 0.48 ± 0.13 | 1.06 ± 0.17 |
| 60 | FN | 2.43 | 280.1289 | −1.187 | C13H18O4N3 | 120.0809, 133.0608, 121.0843, 263.1020, 280.1288 | α-; β- | 13.25 ± 4.33 | 16.98 ± 1.26 |
| 61 | FNL | 6.45 | 393.2126 | −1.593 | C19H29O5N4 | 120.0809, 262.1183, 393.2126, 217.097, 121.0843 | α- | 9.49 ± 2.51 | 21.12 ± 1.42 |
| 62 | FP | 5.64 | 263.1387 | −1.098 | C14H19O3N2 | 120.0809, 116.0708, 70.0658, 263.1387, 86.0969 | α- | 14.55 ± 3.71 | 12.11 ± 0.91 |
| 63 | FQK | 1.81 | 422.2390 | −1.789 | C20H32O5N5 | 120.0809, 422.2390, 165.1021, 84.0813, 129.1022 | β- | 1.75 ± 0.70 | 6.01 ± 0.76 |
| 64 | GH | 1.09 | 213.0980 | −0.689 | C8H13O3N4 | 110.0715, 156.0766, 213.0981, 195.0876, 167.0926 | α-; β- | 11.46 ± 2.56 | 9.11 ± 0.68 |
| 65 | GHL | 4.19 | 326.1821 | −0.646 | C14H24O4N5 | 195.0875, 110.0715, 122.0714, 326.1821, 167.0926 | α- | 0.43 ± 0.16 | 0.81 ± 0.06 |
| 66 | GK | 1.03 | 204.1341 | −1.068 | C8H18O3N3 | 84.0813, 129.1023, 130.0863, 204.1340, 147.1127 | α-; β- | 34.42 ± 8.69 | 37.72 ± 2.81 |
| 67 | GKK | 1.04 | 332.2288 | −1.237 | C14H30O4N5 | 129.1023, 84.0813, 332.2288, 147.1127, 130.0863 | β- | 7.12 ± 2.42 | 16.5 ± 1.15 |
| 68 | GM | 2.04 | 207.0799 | 0.727 | C7H15O3N2S | 150.0584, 113.0712, 104.0532, 133.0319, 159.0764 | β- | 2.8 ± 0.90 | 1.93 ± 0.14 |
| 69 | GTF | 4.86 | 324.1557 | 0.934 | C15H22O5N3 | 120.0809, 166.0863, 159.0765, 131.0816, 74.0607 | β- | 6.30 ± 1.68 | 27.52 ± 6.60 |
| 70 | GV | 1.71 | 175.1075 | −1.25 | C7H15O3N2 | 72.0815, 55.0550, 73.0847, 175.1075, 70.0658 | β- | 10.51 ± 1.81 | 22.42 ± 1.76 |
| 71 | HAH | 0.99 | 364.1722 | −0.985 | C15H22O4N7 | 110.0715, 156.0767, 364.1724, 209.1031, 181.1082 | α- | 4.28 ± 1.15 | 9.88 ± 0.81 |
| 72 | HF | 2.67 | 303.1448 | −1.079 | C15H19O3N4 | 110.0716, 303.1448, 72.0815, 285.1327, 83.0610 | α- | 0.70 ± 0.23 | 0.85 ± 0.09 |
| 73 | HH | 1.02 | 293.1356 | −0.221 | C12H17O3N6 | 110.0716, 156.0767, 292.6503, 84.0814, 293.1528 | α- | 1.79 ± 0.37 | 0.84 ± 0.10 |
| 74 | HK | 1.01 | 284.1713 | −1.605 | C12H22O3N5 | 110.0715, 284.1713, 156.0767, 84.0813, 266.1605 | α-; β- | 4.37 ± 1.29 | 7.05 ± 0.53 |
| 75 | HL | 1.28 | 269.1605 | −1.104 | C12H21O3N4 | 110.0715, 269.1605, 156.0767, 251.1499, 223.1549 | α-; β- | 36.83 ± 7.81 | 22.65 ± 17.40 |
| 76 | HLS | 3.98 | 356.1919 | −0.857 | C15H26O5N5 | 110.0715, 356.1925, 223.1552, 251.1498, 129.1022 | β- | 1.70 ± 0.52 | 2.65 ± 0.17 |
| 77 | HP | 4.08 | 253.1293 | −0.857 | C11H17O3N4 | 156.0767, 110.0715, 70.0658, 235.1187, 253.129 | α- | 1.83 ± 0.52 | 1.69 ± 0.21 |
| 78 | KFL | 5.52 | 407.2649 | −1.036 | C21H35O4N4 | 84.0813, 129.1023, 407.2649, 120.0809, 86.0968 | α- | 1.77 ± 0.51 | 2.16 ± 0.16 |
| 79 | KHL | 1.25 | 397.2554 | −0.881 | C18H33O4N6 | 110.0714, 156.0766, 72.0814, 383.203, 84.0812 | β- | 6.87 ± 1.85 | 10.76 ± 0.80 |
| 80 | KL | 1.28 | 260.1967 | −0.569 | C12H26O3N3 | 84.0813, 260.1968, 129.1024, 243.1702, 147.1128 | α-; β- | 11.64 ± 2.70 | 13.92 ± 1.10 |
| 81 | KLL | 5.17 | 373.2806 | −0.783 | C18H37O4N4 | 84.0813, 129.1024, 373.2806, 86.0970, 185.0556 | α- | 1.01 ± 0.29 | 17.99 ± 1.31 |
| 82 | KT | 1.06 | 248.1603 | −0.655 | C10H22O4N3 | 84.0813, 129.1023, 248.1603, 130.0863, 74.0607 | α- | 17.45 ± 4.09 | 25.36 ± 2.04 |
| 83 | KVV | 2.25 | 345.2494 | −0.788 | C16H33O4N4 | 72.0815, 84.0814, 129.1024, 171.1491, 199.1441 | β- | 3.24 ± 1.35 | 4.51 ± 0.31 |
| 84 | KY | 2.48 | 310.1759 | −0.847 | C15H24O4N3 | 84.0813, 310.1759, 129.1023, 136.0757, 84.0449 | α-; β- | 5.02 ± 1.13 | 4.87 ± 0.38 |
| 85 | LAA | 4.66 | 274.1761 | −0.046 | C12H24O4N3 | 115.0868, 143.0815, 86.0969, 132.1019, 203.1391 | α- | 1.95 ± 0.65 | 4.37 ± 0.37 |
| 86 | LAH | 2.78 | 340.1977 | −0.796 | C15H26O4N5 | 110.0715, 340.1977, 209.1031, 181.1083, 136.0868 | β- | 1.18 ± 0.37 | 2.01 ± 0.16 |
| 87 | LAL | 6.06 | 316.2226 | −1.527 | C15H30O4N3 | 86.0969, 157.1335, 185.1284, 87.1001, 132.1020 | β- | 4.98 ± 1.35 | 10.39 ± 0.56 |
| 88 | LDK | 1.89 | 375.2239 | 0.104 | C16H31O6N4 | 375.2238, 84.0813, 201.1232, 86.0970, 147.1128 | α- | 10.09 ± 3.46 | 1.78 ± 0.16 |
| 89 | LGH | 2.06 | 326.1821 | −0.646 | C14H24O4N5 | 195.0876, 110.0715, 122.0714, 178.0609, 326.1821 | β- | 25.70 ± 6.96 | 28.45 ± 7.10 |
| 90 | LGR | 2.63 | 345.2242 | −0.782 | C14H29O4N6 | 345.2242, 232.1403, 72.0815, 70.0658, 171.1490 | β- | 1.39 ± 0.49 | 5.93 ± 0.46 |
| 91 | LHV | 4.78 | 368.2291 | −0.355 | C17H30O4N5 | 110.0716, 368.2291, 237.1344, 166.0610, 269.1606 | β- | 6.82 ± 2.02 | 16.52 ± 1.28 |
| 92 | LKG | 1.68 | 317.2183 | −0.227 | C14H29O4N4 | 70.0658, 84.0813, 129.1023, 60.0452, 117.0661 | β- | 1.51 ± 0.55 | 1.08 ± 0.08 |
| 93 | LLV | 6.56 | 344.2542 | −0.59 | C17H34O4N3 | 86.0969, 72.0814, 185.1648, 213.1596, 344.2542 | α-; β- | 4.49 ± 1.29 | 10.00 ± 5.55 |
| 94 | LP | 4.49 | 229.1546 | −0.301 | C11H21O3N2 | 70.0658, 229.1546, 116.0707, 120.081, 71.0691 | α- | 17.21 ± 4.70 | 14.9 ± 1.15 |
| 95 | LPG | 4.14 | 286.1758 | −1.023 | C13H24O4N3 | 173.0921, 70.0658, 86.0969, 286.1758, 174.0959 | α- | 4.01 ± 1.12 | 1.92 ± 0.15 |
| 96 | LQ | 1.29 | 260.1606 | 0.605 | C11H22O4N3 | 86.0969, 147.0764, 130.05, 260.1606, 84.0449 | β- | 10.61 ± 3.02 | 10.84 ± 0.83 |
| 97 | LRV | 2.10 | 387.2708 | −1.524 | C17H35O4N6 | 387.2708, 86.0969, 175.1188, 72.0814, 84.0812 | α- | 0.35 ± 0.16 | 2.22 ± 0.55 |
| 98 | LW | 6.40 | 318.1810 | −0.591 | C17H24O3N3 | 86.0969, 188.0705, 205.0971, 318.1810, 146.0599 | β- | 13.64 ± 3.50 | 33.44 ± 3.05 |
| 99 | MF | 5.88 | 297.1262 | −1.749 | C14H21O3N2S | 104.0532, 56.0503, 61.0114, 120.0810, 297.1262 | α- | 1.26 ± 0.27 | 9.34 ± 0.75 |
| 100 | MFL | 3.84 | 410.2109 | 0.235 | C20H32O4N3S | 129.1022, 84.0813, 409.2097, 128.1070, 86.0969 | α- | 3.84 ± 1.29 | 3.97 ± 0.26 |
| 101 | NAL | 4.41 | 317.1822 | 0.674 | C13H25O5N4 | 158.0923, 186.0873, 86.0969, 124.0395, 141.0658 | β- | 23.86 ± 5.94 | 59.15 ± 4.33 |
| 102 | NF | 4.54 | 280.1291 | −0.33 | C13H18O4N3 | 200.0703, 246.0756, 120.0809, 175.0865, 87.0558 | α-; β- | 35.9 ± 9.51 | 69.31 ± 5.00 |
| 103 | NFK | 2.07 | 408.2242 | 0.231 | C19H30O5N5 | 408.2242, 120.0809, 84.0813, 147.1128, 234.1236 | α- | 12.15 ± 2.63 | 33.34 ± 9.32 |
| 104 | NFR | 2.60 | 436.2297 | −0.331 | C19H38O4N3 | 436.2300, 120.081, 437.2333, 70.0658, 175.1189 | β- | 4.85 ± 1.62 | 16.33 ± 1.27 |
| 105 | NLK | 1.75 | 374.2399 | 0.199 | C16H32O5N5 | 374.2399, 86.0969, 84.0814, 200.1393, 147.1128 | β- | 9.04 ± 2.89 | 31.27 ± 2.02 |
| 106 | NVK | 1.24 | 360.2240 | −0.487 | C15H30O5N5 | 360.2240, 84.0813, 72.0814, 186.1236, 129.1023 | α- | 22.21 ± 6.84 | 43.84 ± 3.19 |
| 107 | PD | 4.39 | 231.0974 | −0.511 | C9H15O5N2 | 70.0658, 231.0974, 71.0691, 232.1004, 72.0814 | α-; β- | 1.08 ± 0.24 | 0.94 ± 0.06 |
| 108 | PE | 2.45 | 245.1129 | −1.094 | C10H17O5N2 | 70.0658, 245.1129, 86.0970, 72.0815, 84.0814 | β- | 3.05 ± 0.74 | 3.30 ± 0.30 |
| 109 | PKV | 3.02 | 343.2337 | −0.18 | C16H31O4N4 | 84.0814, 129.1024, 70.0658, 343.2339, 72.0815 | β- | 23.26 ± 8.37 | 1.61 ± 0.14 |
| 110 | PS | 4.22 | 203.1022 | −1.986 | C8H15O4N2 | 70.0658, 132.1020, 86.0970, 203.1022, 157.1336 | α- | 4.23 ± 1.16 | 4.56 ± 0.56 |
| 111 | PT | 1.60 | 217.1184 | 0.352 | C9H17O4N2 | 70.0658, 217.1184, 200.1029, 84.0449, 90.0554 | α- | 8.23 ± 2.41 | 7.42 ± 0.56 |
| 112 | PV | 2.13 | 215.1389 | −0.692 | C10H19O3N2 | 70.0658, 215.1389, 71.0690, 72.0814, 216.1424 | α- | 14.43 ± 4.57 | 15.73 ± 1.22 |
| 113 | QK | 1.05 | 275.1718 | 1.52 | C11H23O4N4 | 84.0814, 129.1024, 258.1441, 84.0450, 130.0863 | α-; β- | 10.27 ± 2.61 | 9.57 ± 0.8 |
| 114 | QSF | 4.68 | 381.1770 | 0.365 | C17H25O6N4 | 120.0810, 166.0863, 84.0450, 83.0610, 363.1662 | β- | 1.49 ± 2.21 | 1.86 ± 2.87 |
| 115 | QVK | 1.25 | 374.2398 | −0.122 | C16H32O5N5 | 374.2397, 182.1288, 84.0813, 183.1128, 72.0815 | α- | 16.44 ± 3.91 | 39.24 ± 2.83 |
| 116 | RF | 1.84 | 322.1873 | −0.143 | C15H24O3N5 | 322.1873, 120.081, 175.1189, 70.0658, 60.0564 | β- | 3.73 ± 1.29 | 7.05 ± 0.59 |
| 117 | RFF | 5.90 | 469.2553 | −0.938 | C24H33O4N6 | 469.2553, 112.0872, 120.0810, 259.1552, 322.1871 | β- | 4.47 ± 1.33 | 11.72 ± 0.91 |
| 118 | RLL | 5.21 | 401.2869 | −0.524 | C18H37O4N6 | 401.2869, 70.0659, 112.0873, 86.0970, 225.1712 | β- | 8.23 ± 2.02 | 9.30 ± 0.63 |
| 119 | RM | 1.21 | 306.1591 | −1.133 | C11H24O3N5S | 306.1591, 70.0658, 175.1189, 60.0564, 289.1325 | α- | 6.87 ± 1.63 | 9.83 ± 0.73 |
| 120 | SAL | 4.45 | 290.1708 | −0.818 | C12H24O5N3 | 131.0816, 159.0764, 86.0970, 60.0452, 132.1019 | α- | 31.13 ± 8.24 | 68.37 ± 5.1 |
| 121 | SH | 1.16 | 243.1086 | −0.952 | C9H15O4N4 | 110.0715, 156.0767, 225.0980, 243.1086, 70.0658 | α- | 8.92 ± 2.02 | 8.72 ± 0.76 |
| 122 | TF | 4.83 | 267.1339 | −0.313 | C13H19O4N2 | 74.0607, 120.0809, 166.0861, 267.1339, 56.0503 | β- | 9.23 ± 2.83 | 22.49 ± 1.53 |
| 123 | TLA | 4.69 | 304.1863 | −1.306 | C13H26O5N3 | 145.0971, 173.092, 74.0607, 86.0969, 132.1020 | α- | 1.48 ± 0.51 | 4.84 ± 0.37 |
| 124 | TQ | 1.22 | 248.1237 | −1.641 | C9H18O5N3 | 74.0607, 130.0499, 147.0763, 84.0449, 248.1237 | β- | 10.13 ± 2.07 | 15.46 ± 1.11 |
| 125 | TY | 2.70 | 283.1289 | 0.218 | C13H19O5N2 | 74.0607, 182.0810, 136.0757, 283.1289, 165.0545 | α- | 4.70 ± 1.45 | 9.75 ± 0.71 |
| 126 | VH | 1.19 | 255.1449 | −1.164 | C11H19O3N4 | 156.0767, 110.0716, 255.1449, 72.0815, 237.1343 | α-; β- | 17.91 ± 5.08 | 35.03 ± 2.74 |
| 127 | VK | 1.25 | 246.1812 | −0.277 | C11H24O3N3 | 147.0764, 72.0814, 84.0813, 130.0499, 246.1812 | α-; β- | 36.7 ± 9.62 | 48.71 ± 3.45 |
| 128 | VLG | 5.48 | 288.1920 | 0.823 | C13H26O4N3 | 129.1023, 72.0815, 157.0972, 86.0969, 132.1019 | β- | 4.42 ± 1.28 | 5.77 ± 0.45 |
| 129 | VLQ | 3.38 | 359.2286 | −0.798 | C16H31O5N4 | 147.0764, 130.0500, 86.0969, 72.0815, 185.1648 | β- | 11.23 ± 3.62 | 54.64 ± 4.11 |
| 130 | VLS | 5.44 | 318.2019 | −1.406 | C14H28O5N3 | 159.1128, 72.0815, 187.1076, 114.0916, 60.0451 | α- | 2.43 ± 0.60 | 7.51 ± 0.54 |
| 131 | VN | 1.27 | 232.1289 | −1.217 | C9H18O4N3 | 72.0815, 133.0609, 55.0550, 70.0658, 215.1025 | α-; β- | 32.91 ± 11.23 | 41.65 ± 1.83 |
| 132 | VNF | 5.65 | 379.1979 | 0.827 | C18H27O5N4 | 72.0815, 214.1186, 379.1979, 86.0969, 120.0811 | α- | 2.32 ± 0.97 | 4.11 ± 0.97 |
| 133 | VTL | 5.83 | 332.2177 | −0.775 | C15H30O5N3 | 72.0815, 201.1233, 74.0607, 173.1284, 233.1495 | α- | 0.37 ± 0.1 | 1.20 ± 0.08 |
| 134 | VVA | 3.08 | 288.1912 | −1.918 | C13H26O4N3 | 72.0814, 171.1490, 199.1440, 189.123, 73.0847 | β- | 18.19 ± 5.14 | 50.7 ± 3.97 |
| 135 | VVL | 5.89 | 330.2383 | −1.281 | C16H32O4N3 | 72.0815, 171.1491, 199.1440, 86.0969, 172.1529 | β- | 18.24 ± 6.26 | 48.47 ± 3.62 |
| 136 | VY | 3.67 | 281.1493 | −1.044 | C14H21O4N2 | 72.0814, 182.0810, 136.0757, 55.0550, 120.0809 | β- | 3.82 ± 1.21 | 4.54 ± 0.32 |
| 137 | VYP | 4.71 | 378.2023 | −0.125 | C19H28O5N3 | 136.0757, 116.0709, 72.0815, 235.1438, 263.1390 | β- | 4.91 ± 1.59 | 4.77 ± 0.32 |
| 138 | WG | 4.77 | 262.1188 | 0.695 | C13H16O3N3 | 245.0919, 159.0916, 144.0808, 132.0808, 170.0599 | α-; β- | 4.04 ± 1.14 | 3.66 ± 0.28 |
| 139 | WGK | 3.11 | 390.2137 | 0.177 | C19H28O4N5 | 390.2137, 159.0917, 84.0813, 86.0969, 72.0814 | α-; β- | 19.29 ± 6.94 | 76.27 ± 5.84 |
| 140 | YF | 5.71 | 329.1496 | −0.041 | C18H21O4N2 | 136.0757, 86.0969, 72.0815, 213.1596, 185.1647 | α- | 1.18 ± 0.32 | 2.48 ± 0.18 |
| 141 | YFP | 5.91 | 426.2013 | −2.833 | C23H28O5N3 | 136.0757, 116.0708, 120.0809, 70.0658, 311.1387 | α- | 1.7 ± 0.60 | 3.18 ± 0.45 |
| 142 | YH | 1.24 | 319.1402 | 0.277 | C15H19O4N4 | 110.0716, 156.0768, 319.1402, 136.0757, 301.1292 | β- | 6.92 ± 1.85 | 14.58 ± 1.14 |
| 143 | YP | 3.86 | 279.1337 | −0.837 | C14H19O4N2 | 136.0757, 116.0709, 70.0658, 279.1337, 119.0493 | β- | 5.22 ± 1.65 | 1.72 ± 0.14 |
| 144 | YR | 1.26 | 338.1818 | −1.362 | C15H24O4N5 | 338.1818, 136.0756, 175.1188, 70.0658, 339.1844 | α- | 3.19 ± 0.68 | 14.65 ± 1.25 |
| 145 | AHK | 1.00 | 355.2086 | −0.675 | C15H27O4N6 | 110.0716, 355.2086, 209.1031, 156.0768, 136.0869 | α-;β- | ND | 7.00 ± 0.57 |
| 146 | ERM | 1.91 | 435.2012 | −0.988 | C16H31O6N6S | 435.2016, 304.1612, 70.0658, 436.2037, 84.0449 | α- | ND | 0.52 ± 0.04 |
| 147 | ESF | 4.84 | 382.1608 | −0.124 | C17H24O7N3 | 120.0809, 166.0862, 126.0550, 84.0449, 110.0715 | β- | ND | 1.93 ± 0.10 |
| 148 | FAK | 3.21 | 365.2179 | −1.182 | C18H29O4N4 | 120.0809, 365.2179, 84.0813, 147.1127, 130.0863 | β- | ND | 0.63 ± 0.08 |
| 149 | GR | 1.08 | 232.1401 | −1.404 | C8H18O3N5 | 232.1401, 70.0658, 116.0708, 100.0509, 215.1137 | β- | ND | 7.64 ± 0.64 |
| 150 | SV | 1.86 | 205.1184 | 0.665 | C8H17O4N2 | 60.0451, 72.0814, 118.0864, 159.1127, 205.1184 | α- | ND | 41.51 ± 2.81 |
Peak no. 1–144 refer to the small peptides identified in both PBCH and PBCH-GI, no. 145–150 refer to the small peptides only identified in PBCH-GI. α- means porcine hemoglobin (alpha subunit), β- means porcine hemoglobin (beta subunit). Concentration are presented as mean ± SD (n = 3), ND indicates that the peptide is not detected in PBCH. PBCH, pig blood cells hydrolysates; PBCH-GI, gastrointestinal-digested pig blood cells hydrolysates.
Qualitative and quantitative analysis results of di-/tripeptides in hydrolysates1
Footnotes
REFERENCES
Cite this article
TY  - JOUR
AU  - Xiaojun Ni
AU  - Zhenya Zhai
AU  - Zhongquan Xin
AU  - Chengquan Tan
AU  - Yiliang Chen
AU  - Jinping Deng
AU  - Pinfeng Liao
AU  - Limeng Zhang
AU  - Zaili Xiao
AU  - Baichuan Deng
PY  - 2020
DA  - 2020/04/30
TI  - Antioxidant Properties and Transepithelial Transportation of Di-/tripeptides Derived from Simulated Gastrointestinal Digestion of Pig Blood Cells Hydrolysates
JO  - eFood
SP  - 254
EP  - 269
VL  - 1
IS  - 3
SN  - 2666-3066
UR  - https://doi.org/10.2991/efood.k.200422.001
DO  - 10.2991/efood.k.200422.001
ID  - Ni2020
ER  -