
Formation of Three Selected AGEs and their Corresponding Intermediates in Aldose- and Ketose-lysine Systems
- DOI
- 10.2991/efood.k.200508.001How to use a DOI?
- Keywords
- Dicarbonyl compound; Nε-carboxymethyl-lysine; Nε-carboxyethyl-lysine; aldose; ketose; HPLC-MS/MS
- Abstract
Advanced Glycation End Products (AGEs) could be formed with α-dicarbonyl compounds as intermediates; however, simultaneous determination of AGES as well as their precursors and intermediates have rarely been mentioned, so as to investigate the reaction. In this work, lysine was reacted with aldoses (galactose, glucose) and ketoses (fructose, sorbose) to investigate the effects of sugar type and heating temperature. Two high-performance liquid chromatography-tandem mass spectrometry methods were developed to quantify AGEs and the corresponding α-dicarbonyl compounds. The results demonstrated that aldoses were more prone to form intermediates and final products than ketoses from the point of view of absorbance (at 294 and 420 nm). Aldose systems were prone to form glyoxal, whereas ketose systems tended to generate methylglyoxal and 3-deoxyglucosone. The relative reaction activity of sugars in forming Nε-carboxymethyl-lysine depended upon heating temperature for aldose and ketose systems. The aldose was more liable to generate Nε-Carboxyethyl-lysine (CEL) than ketose, with the CEL generation for each sugar occurred in the order galactose > glucose > sorbose > fructose. The obvious differences between different types of sugars suggest that further research is needed on the degradation of sugars to form intermediates and on the reaction of α-dicarbonyl to generate AGEs.
- Graphical Abstract
- Copyright
- © 2020 International Association of Dietetic Nutrition and Safety. Publishing services by Atlantis Press International B.V.
- Open Access
- This is an open access article distributed under the CC BY-NC 4.0 license (http://creativecommons.org/licenses/by-nc/4.0/).
1. INTRODUCTION
The Maillard reaction, also called nonenzymatic browning, contributes importantly to the color, aroma, and taste of food during thermal-processing procedures [1]. A complicated series of reactions takes place to form stable macromolecular compounds between carbonyl compounds like reducing sugars and free amino compounds such as proteins, lipids, or nucleic acids. Advanced Glycation End Products (AGEs), first reported in 1984 by Brownlee et al. [2], are a group of complex and heterogeneous compounds formed at the advanced stage of the Maillard reaction. Although the formation mechanism of AGEs remains somewhat unclear, numerous studies have shown that the accumulation of AGEs in vivo is closely related to chronic diseases such as diabetes, nephropathy, and cardiovascular disease [3,4].
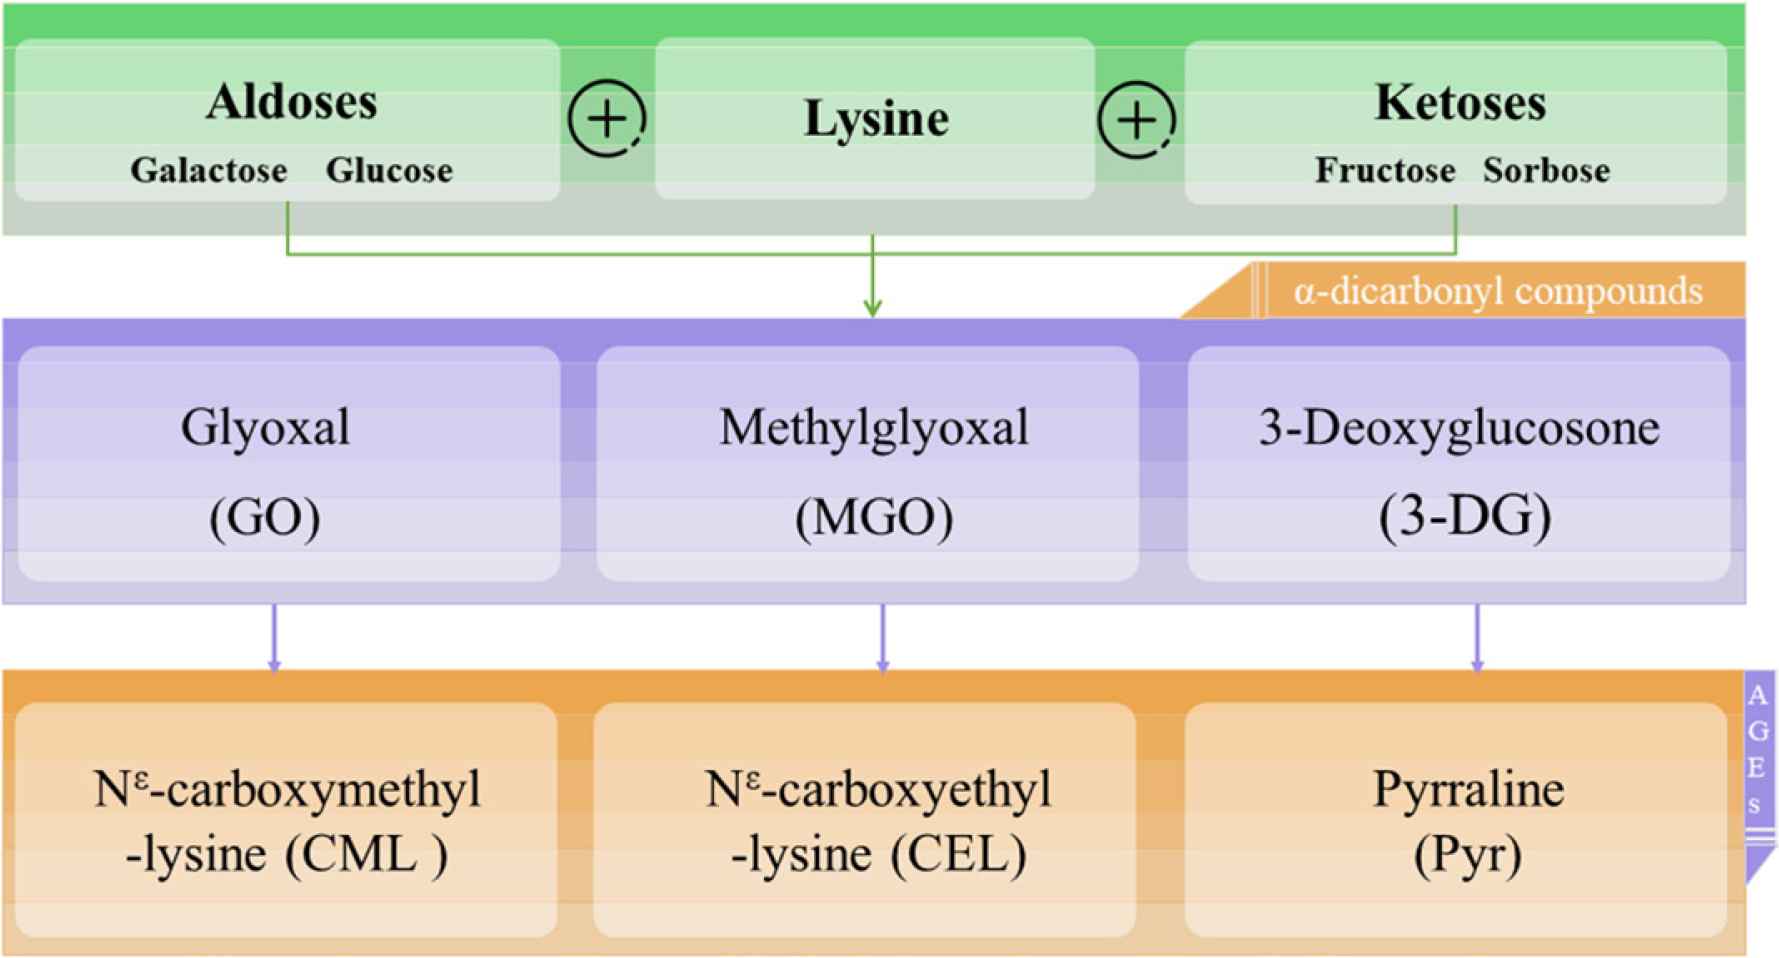
Typical AGEs such as Nε-Carboxymethyl-lysine (CML), Nε-Carboxyethyl-lysine (CEL), and Pyrraline (Pyr) have been widely studied and are frequently selected as markers for AGEs content in food. These AGEs can be generated by Maillard reactions through various reaction pathways, as presented in Figure 1 [5]. During the early stage of the Maillard reaction, reducing sugars react with free lysine or lysine residues to form an unstable, reversible Schiff base. Subsequently, the Schiff base is liable to generate Amadori/Heyns compounds via Amadori/Heyns rearrangement. In later stages, reducing sugars, schiff base and rearrangement products degrade to yield highly reactive carbonyls including Glyoxal (GO), Methylglyoxal (MGO), and 3-Deoxyglucosone (3-DG). AGEs, as advanced glycation adducts, are formed by the reaction between carbonyls and amino groups, which is an irreversible process. As shown in Figure 1, the CML, CEL, and Pyr were generated by the reaction of lysine residues with α-dicarbonyl compounds such as GO, MGO, and 3-DG [6].

Scheme of the production of CML, CEL and Pyr from reducing sugars and lysine with GO, MGO, and 3-DG as the intermediates.
The determination and quantification of AGEs is essential. Enzyme-linked immunosorbent assay for determination of AGEs is fast and economical, but has not been extensively validated for the bulk of food, and its units, such as kU/g or kU/mL, are difficult to show the content of AGEs in food [7]. Instrumental analytical methods are the most commonly used to determine AGE concentrations in food. Reverse-phase high-performance liquid chromatography (HPLC) with fluorescence detectors can be used to determine fluorescent AGEs content; however, it is inevitable to o-phthalaldehyde precolumn derivatization for nonfluorescent AGEs like CML and CEL [8]. Gas chromatography–mass spectrometry is used for quantification of AGEs, but also requires derivatization [9]. HPLC-Tandem Mass Spectrometry (HPLC-MS/MS) was used for determination of AGEs prior to HPLC because the derivation step was not necessary [3]. In addition, Ultra performance liquid chromatography coupled MS/MS provides a significantly high sensitivity and a superior resolution for analysis of AGEs [10]. Multiple Reaction Monitoring (MRM) is also viable for analyzing different AGEs simultaneously with high efficiency [11]. So far, LC–MS/MS is the most widely used method for AGEs analysis.
Chemical-model systems are a useful and effective way to understand the formation of AGEs without the effects of the matrices of the real food systems [12–14]. The chemical-model system can effectively lower the complexity of the reaction, allowing systematic and specific study of the formation of AGEs. In addition, it can also be used to study the formation of intermediates through the degradation of sugars, benefiting exploration of possible reaction pathways [15,16]. The reaction rates at different stages should be discussed in detail by studying the reaction kinetics of model system [6]. This may be an important guide for comprehensive control of the formation of AGEs. To explain the complicated formation pathways of the Maillard reaction, model system is a very simple and promising method for discussing the reactive mechanism and can be further extended to real food matrices.
There has been an explosion of interest in model systems for studying different factors affecting the formation of AGEs, including pH, substrate concentration, and temperature. The initial pH has a significant effect on reaction-rate constant and the pH value decreases as the Maillard reaction progress [17,18]. The color intensity and other reaction parameters also showed that the sugar-amino reaction is related to initial reactant concentrations and medium, such as metal ions [19]. For example, the content of pyrraline was promoted by the increase of the initial ration of sugar with lysine and the temperature also played an important role [20]. In addition, a number of studies have focused on the type of sugar when examining reaction kinetics. An obvious difference between aldose and ketose in monosaccharide- and disaccharide-casein systems showed that not only the sugars themselves, but also their reaction intermediates, were identified as being reactive [12,13]. The α-dicarbonyl compounds, which are key intermediates, are degradation products of sugars that are very reactive with amino acids [16]. However, there has been limited simultaneous analysis of the differences between aldose and ketose during the formation of special AGEs and their corresponding intermediate products.
The aim of this paper is to compare differences in the formation of α-dicarbonyl intermediates and AGEs between aldose- and ketose-lysine systems. In this work, two LC–MS/MS methods for determination of three different α-dicarbonyl intermediates (GO, MGO, and 3-DG), as well as three corresponding AGEs (CML, CEL, and Pyr), are developed. Furthermore, the relationship between the formation of intermediates and AGEs is also investigated, so as to further explore the reaction mechanism related to the Maillard reaction.
2. MATERIALS AND METHODS
2.1. Materials
All chemicals were of analytical grade. CML, CEL, CML-d4, and CEL-d4 were obtained from Santa Cruz Biotechnology (Paso Robles, CA, USA). GO solution (40% in water), MGO solution (40% in water), 3-DG, Pyr, and 2,3-hexanedione (internal standard) were purchased from Sigma-Aldrich (St. Louis, MO, USA). Nonafluoropentanoic Acid (NFPA) was obtained from J&K Chemical Co., Ltd. (Shanghai, China). Methanol and acetonitrile of HPLC grade were obtained from TEDIA Co. (Fairfield, OH, USA). All other reagents were obtained from Sinopharm Chemical Reagent Co., Ltd. (China). Ultrapure water was prepared using a Millipore Milli-Q purification system (Bedford, MA, USA).
2.2. Preparation of a Sugar-lysine System
The saccharide-lysine model system was prepared by dissolving 1.462 g of lysine in a 100-mL phosphate buffer (0.1 mol/L, pH = 7.0), and then the aldoses (glucose, galactose) and ketoses (fructose, sorbose) were respectively added to the lysine solution with a molar ratio of sugar to lysine of 1:1. All model systems were heated at 80°C and 100°C for 120 min after mixing. The model solutions (5 mL) were sampled at intervals of every 20 min and cooled in an ice-water bath to stop further reaction. Sample (1 mL) was centrifuged at 10,000g for 5 min and the supernatant was filtered with a 0.2-μm hydrophilic membrane and stored at −20°C before analysis. The full experiment was performed in triplicate.
2.3. Determination of the Intermediate and Final Products
The degree of reaction was evaluated using UV–Vis spectrophotometry. The absorbance at 294 and 420 nm reflected the formation of intermediate and final products in the Maillard reaction, respectively [21]. The reaction solution was diluted to a suitable concentration with ultrapure water; the phosphate buffer solution was used as a blank reference. All measurements were conducted in triplicate.
2.4. Change of pH Values
The pH values of the aldose- and ketose-lysine model systems at every 20 min of reaction time were determined by a pH meter when the reaction solution was cooled to room temperature.
2.5. Quantification of GO, MGO, and 3-DG
The LC–MS/MS method for quantification of GO, MGO, and 3-DG was performed according to the published methods with slight modifications [22,23]. The α-dicarbonyl compounds were first derived with o-phenylenediamine. The diluted samples (200 μL) were then mixed with 100 μL of 2,3-hexanedione as an internal standard. Then, 100 μL of o-phenylenediamine was added as derivatization reagent. The mixed solution was vortexed and kept at 4°C in the dark overnight. Then, 200 μL of the derivatized solution was injected into LC–MS/MS for measurement.
The Waters 2690 LC system coupled to a Micromass Quattro Micro triple-quadrupole mass spectrometer (Waters, Milford, MA, USA) was used to quantify α-dicarbonyl compounds. The analysis was performed by MRM with a Positive Electrospray Ionization mode (ESI+). The ionization source temperature and desolvation gas temperatures were 110°C and 400°C, respectively. The desolvation and cone gases were 600 and 50 L/h, respectively. The injection volume was 5 μL using an X-Bridge C18 column (100 × 2.1 mm2, 3.5 μm) and the flow rate was 0.3 mL/min using the mobile phases A (0.1% formic acid in water) and B (methanol). The gradient of mobile phase A was as follows: 0–0.1 min: 70% A; 0.1–5 min: 70–10% A; 5–8 min: 10–0% A; 8–9 min: 0% A; 9–10 min: 0–70% A; 10–15 min: 70% A. The respective transitions of m/z 131-77, 145-77, 235-199, and 187-77 were used as quantifier for GO, MGO, 3-DG, 2,3-hexanedione, respectively. The quantification of α-dicarbonyl intermediates was based on calibration curves obtained by the internal standard method.
2.6. Quantification of CML, CEL, and Pyr
The CML, CEL, and Pyr concentrations of the samples were determined by LC–MS/MS according to our previous study [24]. Briefly, 100 μL of centrifuged diluted sample was spiked with 100 μL of internal standard solution (0.40 μg/mL CML-d4, 0.40 μg/mL CEL-d4) and analyzed using a Waters 2690 LC system coupled to a Micromass Quattro Micro triple-quadrupole mass spectrometer (Waters, Milford, MA, USA). Diluted-sample solutions (5 μL) were injected onto an X-Bridge C18 column (100 × 2.1 mm2, 3.5 μm) with the oven temperature of 35°C. The mobile phases consisted of 5 mmol/L NFPA in water as solvent A and acetonitrile as solvent B, with gradient data collected over 20 min (0–0.1 min: 95% A; 0.1–5 min: 95–40% A; 5–7 min: 40–0% A; 7–9 min: 0% A; 9–10 min: 0–95% A; 10–20 min: 95% A). The flow rate was 0.3 mL/min. The ESI+ mode was used in MRM, and the parameter of MS tuning was the same as that used in the method of α-dicarbonyl-compound quantification. The respective transitions of m/z 205-84, 209-88, 219-84, 223-88 and 255-175 were used as quantifier for CML, CML-d4, CEL, CEL-d4, Pyr, respectively. The quantification of CML and CEL was done using the isotope internal standard method while external standard method for Pyr.
2.7. Statistical Analysis
All experiments were conducted in triplicate. The data were presented as mean values ± Standard Deviations (SD). An analysis of variance was used to evaluate differences among multiple groups, followed by an LSD test. A p-value of <0.05 was considered significant.
3. RESULTS AND DISCUSSION
3.1. Method Validation
Figure 2 shows the LC–MS/MS chromatograms of standard solutions of GO (6.32 μg/mL), MGO (5.86 μg/mL), 3-DG (4.19 μg/mL), CML (1.87 μg/mL), CEL (1.73 μg/mL), and Pyr (2.3 μg/mL). The retention times in MRM of four channels for 3-DG, GO, MGO, and 2,3-hexanedione were 2.10, 3.51, 4.74, and 7.53 min, respectively. The retention times in MRM of five channels for AGEs were 5.51, 5.53, 5.79, 5.79, and 5.90 min for CML, CML-d4, CEL, CEL-d4, and Pyr, respectively. The MS parameters of all intermediates and AGEs in MRM are listed in Table 1. The cone and collision voltages were optimized to acquire a maximal signal. Moreover, the linear ranges, coefficient of determination (R2), Limits of Detection (LODs), Limits of Quantification (LOQs), Relative Standard Deviations (RSDs), and recoveries of the methods are listed in Table 2.
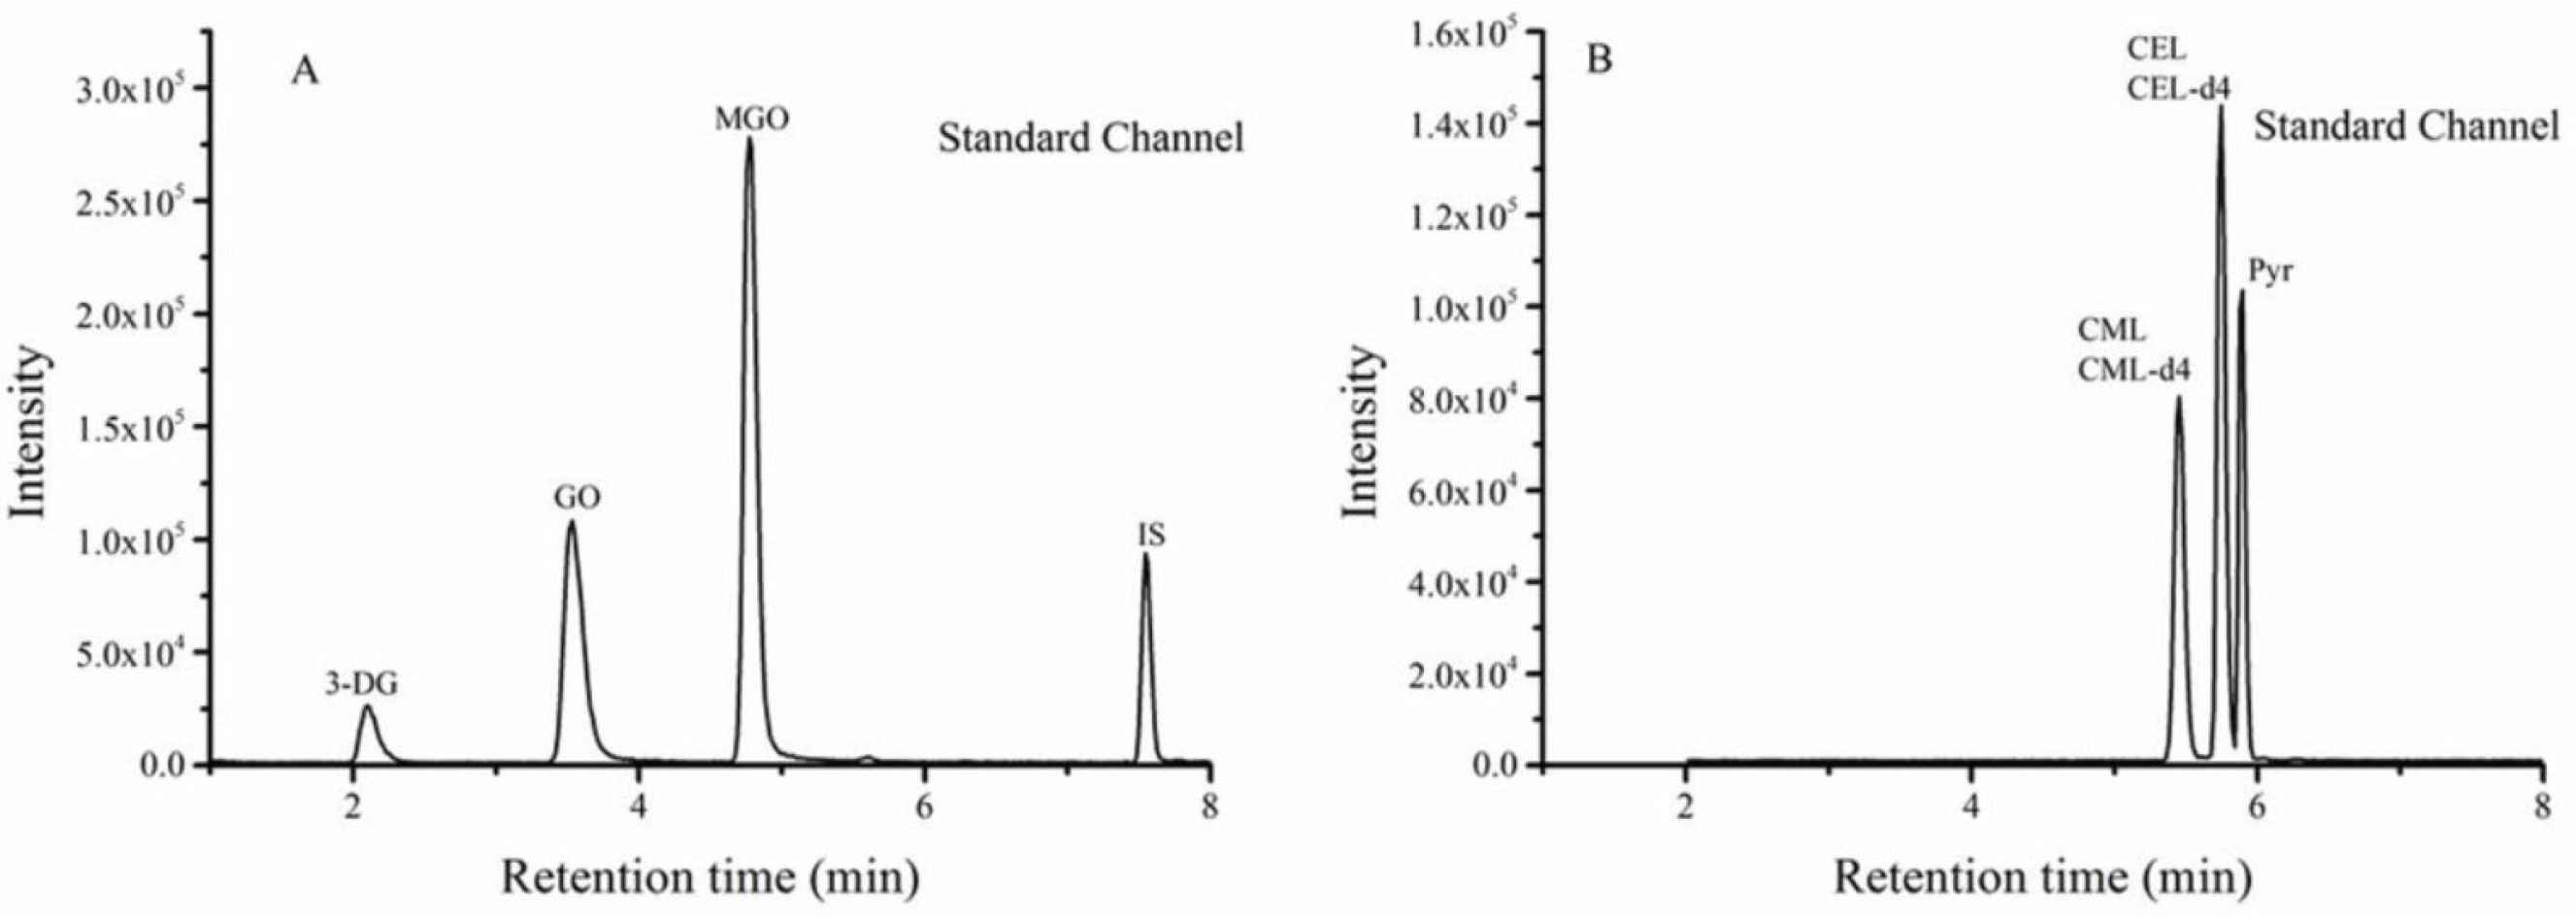
The LC–MS/MS chromatograms of standard solutions of GO (6.32 μg/mL), MGO (5.86 μg/mL), 3-DG (4.19 μg/mL), CML (1.87 μg/mL), CEL (1.73 μg/mL), and Pyr (2.3 μg/mL).
| Compound | Precursor ion (m/z) | Product ion (m/z) | Cone voltage (V) | Dwell time (ms) | Collision energy (eV) |
|---|---|---|---|---|---|
| CML | 205 | 84 | 20 | 20 | 14 |
| CML-d4 | 209 | 88 | 20 | 20 | 15 |
| CEL | 219 | 84 | 20 | 20 | 16 |
| CEL-d4 | 223 | 88 | 20 | 20 | 13 |
| Pyr | 255 | 175 | 15 | 20 | 10 |
| GO | 131 | 77 | 34 | 20 | 20 |
| MGO | 145 | 77 | 35 | 20 | 20 |
| 3-DG | 235 | 199 | 30 | 20 | 12 |
| IS | 187 | 77 | 32 | 20 | 35 |
MS parameter of AGEs and intermediate for multiple reaction monitoring
| Compound | Linear range (ng/mL) | Coefficients (R2) | LOD (ng/g) | LOQ (ng/g) | Recovery (%) | Precision (% RSD) |
|---|---|---|---|---|---|---|
| CML | 20–2000 | >0.998 | 9.350 | 6.233 | 91.78 | 9.13 |
| CEL | 20–2000 | >0.999 | 8.650 | 5.767 | 100.94 | 3.67 |
| GO | 60–6000 | >0.998 | 12.344 | 9.875 | 109.69 | 2.97 |
| MGO | 60–6000 | >0.994 | 9.1562 | 5.723 | 103.86 | 1.50 |
| 3-DG | 55–5500 | >0.998 | 10.469 | 8.724 | 95.17 | 7.74 |
Analytical characteristics of the HPLC-MS/MS methods for CML, CEL, GO, MGO and 3-DG
The LODs and LOQs in the present study were 12.34, 9.16, 10.47, 9.35, 8.65, 11.50 and 9.88, 5.72, 8.72, 6.23, 5.77, 7.67 ng/g, respectively, for GO, MGO, 3-DG, CML, CEL, and Pyr, respectively. These results are similar to our previous study [24]. The recoveries of AGEs were 91.78% (CML) and 100.94% (CEL), while those of the intermediates were 109.69% (GO), 103.86% (MGO), and 95.17% (MGO), which is acceptable for measurement methods. The recoveries of CML and CEL were 88.76% and 91.35% in the former report, which are different with the results of our study [11,24]. This may be attributed to the differences of between sample matrix between real food in their and model system in this research.
3.2. pH Variation in the Aldose- and Ketose-lysine Systems
Figure 3A and 3B shows the pH changes of the system at 80°C and 100°C, respectively. As shown in Figure 3A, the pH values of all model systems decreased along with the reaction duration. Among them, the pH values of the aldose systems decreased significantly (p < 0.05) more than those of the ketose systems, especially for galactose. The decline of pH values was not apparent in either ketose systems. Within the first 40 min, the differences in pH values between the two types of systems were not obvious (p > 0.05). From 40 to 100 min, the differences in the decline rates of the pH values gradually increased in the two types of systems. From 100 to 120 min, as the rate of reaction slowed down, the change in pH values was not distinct. Consistent with the 80°C results, the pHs of both aldoses and ketoses showed a decreasing trend at 100°C. As can be seen in Figure 3B, the difference in pH reduction of the aldoses and ketoses increased dramatically at 100°C. The pH value of aldose decreased more rapidly than ketose, with the rate of pH decrease occurring in the order of galactose > glucose > sorbose > fructose.
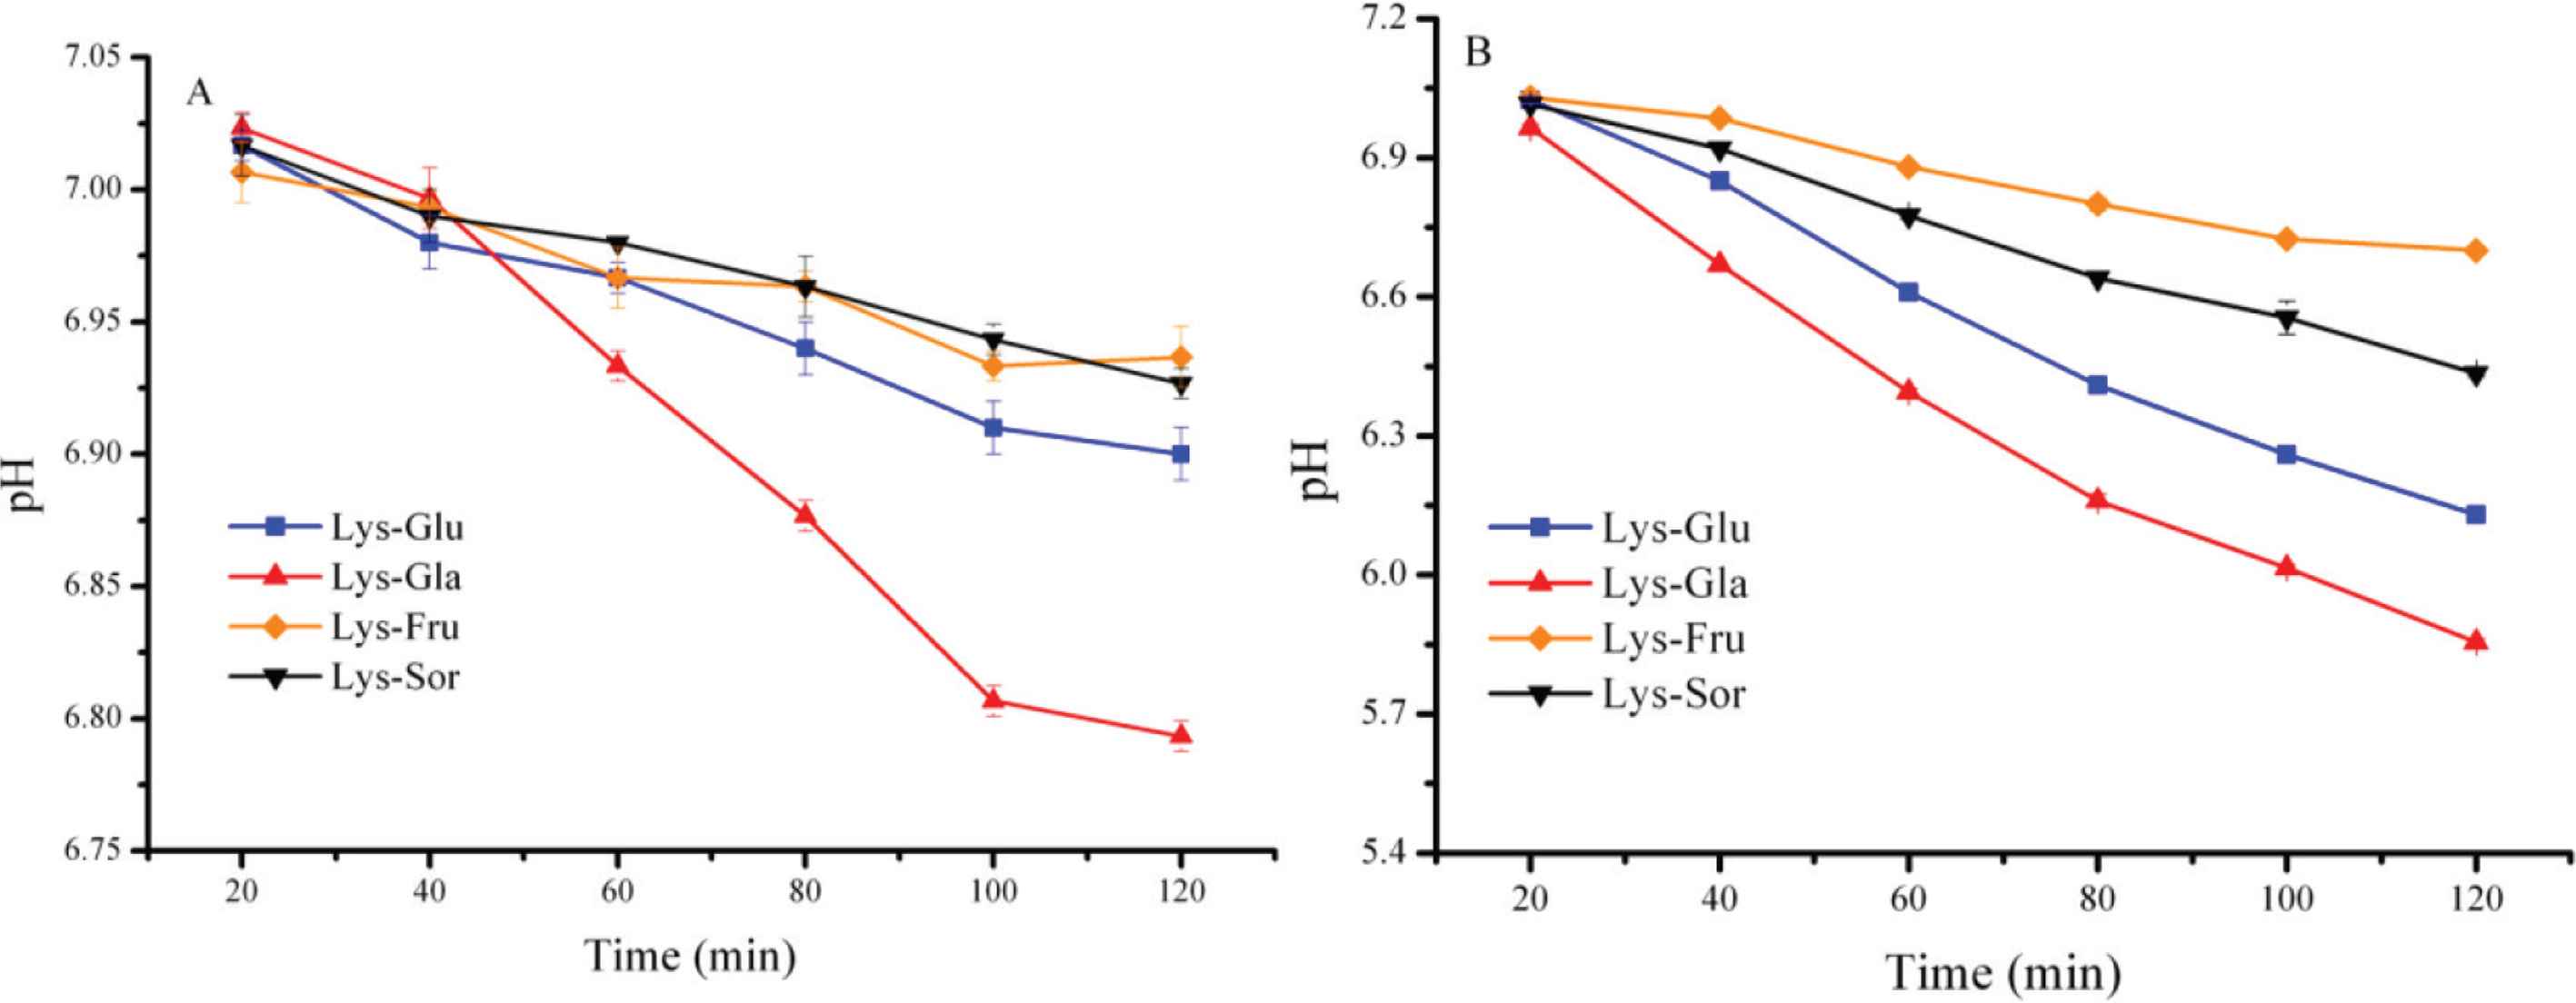
The pH changes of the system at 80°C (A) and 100°C (B), respectively.
In agreement with other studies [6,13], the pH values of the model system would decrease along with progress in the Maillard reaction. It has been reported that the formation of organic acids in ketose (fructose) systems was higher than in aldose (glucose) [12,13]. However, the pH values of aldose systems decreased more quickly than that of ketose systems. Hence, the formation of organic acid may not be the main reason for the decrease of pH value. Furthermore, lysine is a basic amino acid containing two amino groups. according to Brands and van Boekel [12], the content of lysine residues in ketose-casein was higher than that in aldose-casein. Thus, the decrease of pH value in aldose was faster than that for ketose. In addition, galactose seemed to be more liable to participate in Maillard reactions than glucose for aldose systems, so the pH value of the galactose system decreases fastest [18]. Kwak and Lim [19] believed that sugar-type has little effect on pH values, but this may due to the fact that he used a strongly-buffered solution (1.0 mol/L citrate-phosphate buffer, pH 6.5) to minimize the change in pH values. For a lower heating temperature (80°C), the reaction speed was slower and the pH change was not obvious in the early stage of the reaction (0–40 min). In addition, when the reaction proceeded to a certain extent, the system was relatively stable and the pH changed slowly (100–120 min). However, the difference in pH value between the different sugars became larger when the temperature rose to 100°C.
3.3. Formation of Intermediate and the Final Products
The Maillard reaction was a non-enzymatic browning reaction used to generate brown or even black macromolecules, commonly known as black melanoidin. The absorbances at 294 and 420 nm reflected the formation of intermediate products and advanced stage products, respectively. The increase of absorbance at 294 nm indicated the formation of non-fluorescent compounds, which were a precursor to brown pigment formation [25]. The increase in the absorbance at 420 nm indicated the production of brown pigment in the final stage of the Maillard reaction [26]. Figure 4A and 4B showed the change of absorbance over time at 80°C, while Figure 4C and 4D for 100°C. As shown in Figure 4A, the absorbance of aldose at 294 nm increased faster than that of ketose. For aldose systems, the absorbance of galactose at 294 nm began to increase sharply after 20 min; this happened after 40 min for glucose. The changes in absorbance value in ketose systems were not obvious, especially for fructose. As shown in Figure 4B, the absorbances of aldoses at 420 nm were higher than those of ketoses. Within the first 40 min, the absorbance difference between the two model types was not distinct. With further reaction (40–120 min), the absorbance of the aldose systems began to increase and the rate of growth was much faster than that for ketose systems. In ketose systems, it is worth mentioning that the absorbance of the fructose system does not show a clear change, which is similar to the absorbance at 294 nm. Figure 4C and 4D show similar trends. Absorbance values at 294 and 420 nm both increased with reaction time. The growth rate of aldose was higher than that of ketose. The accumulation of intermediates and final products of the Maillard reaction at 100°C was also higher than that at 80°C.
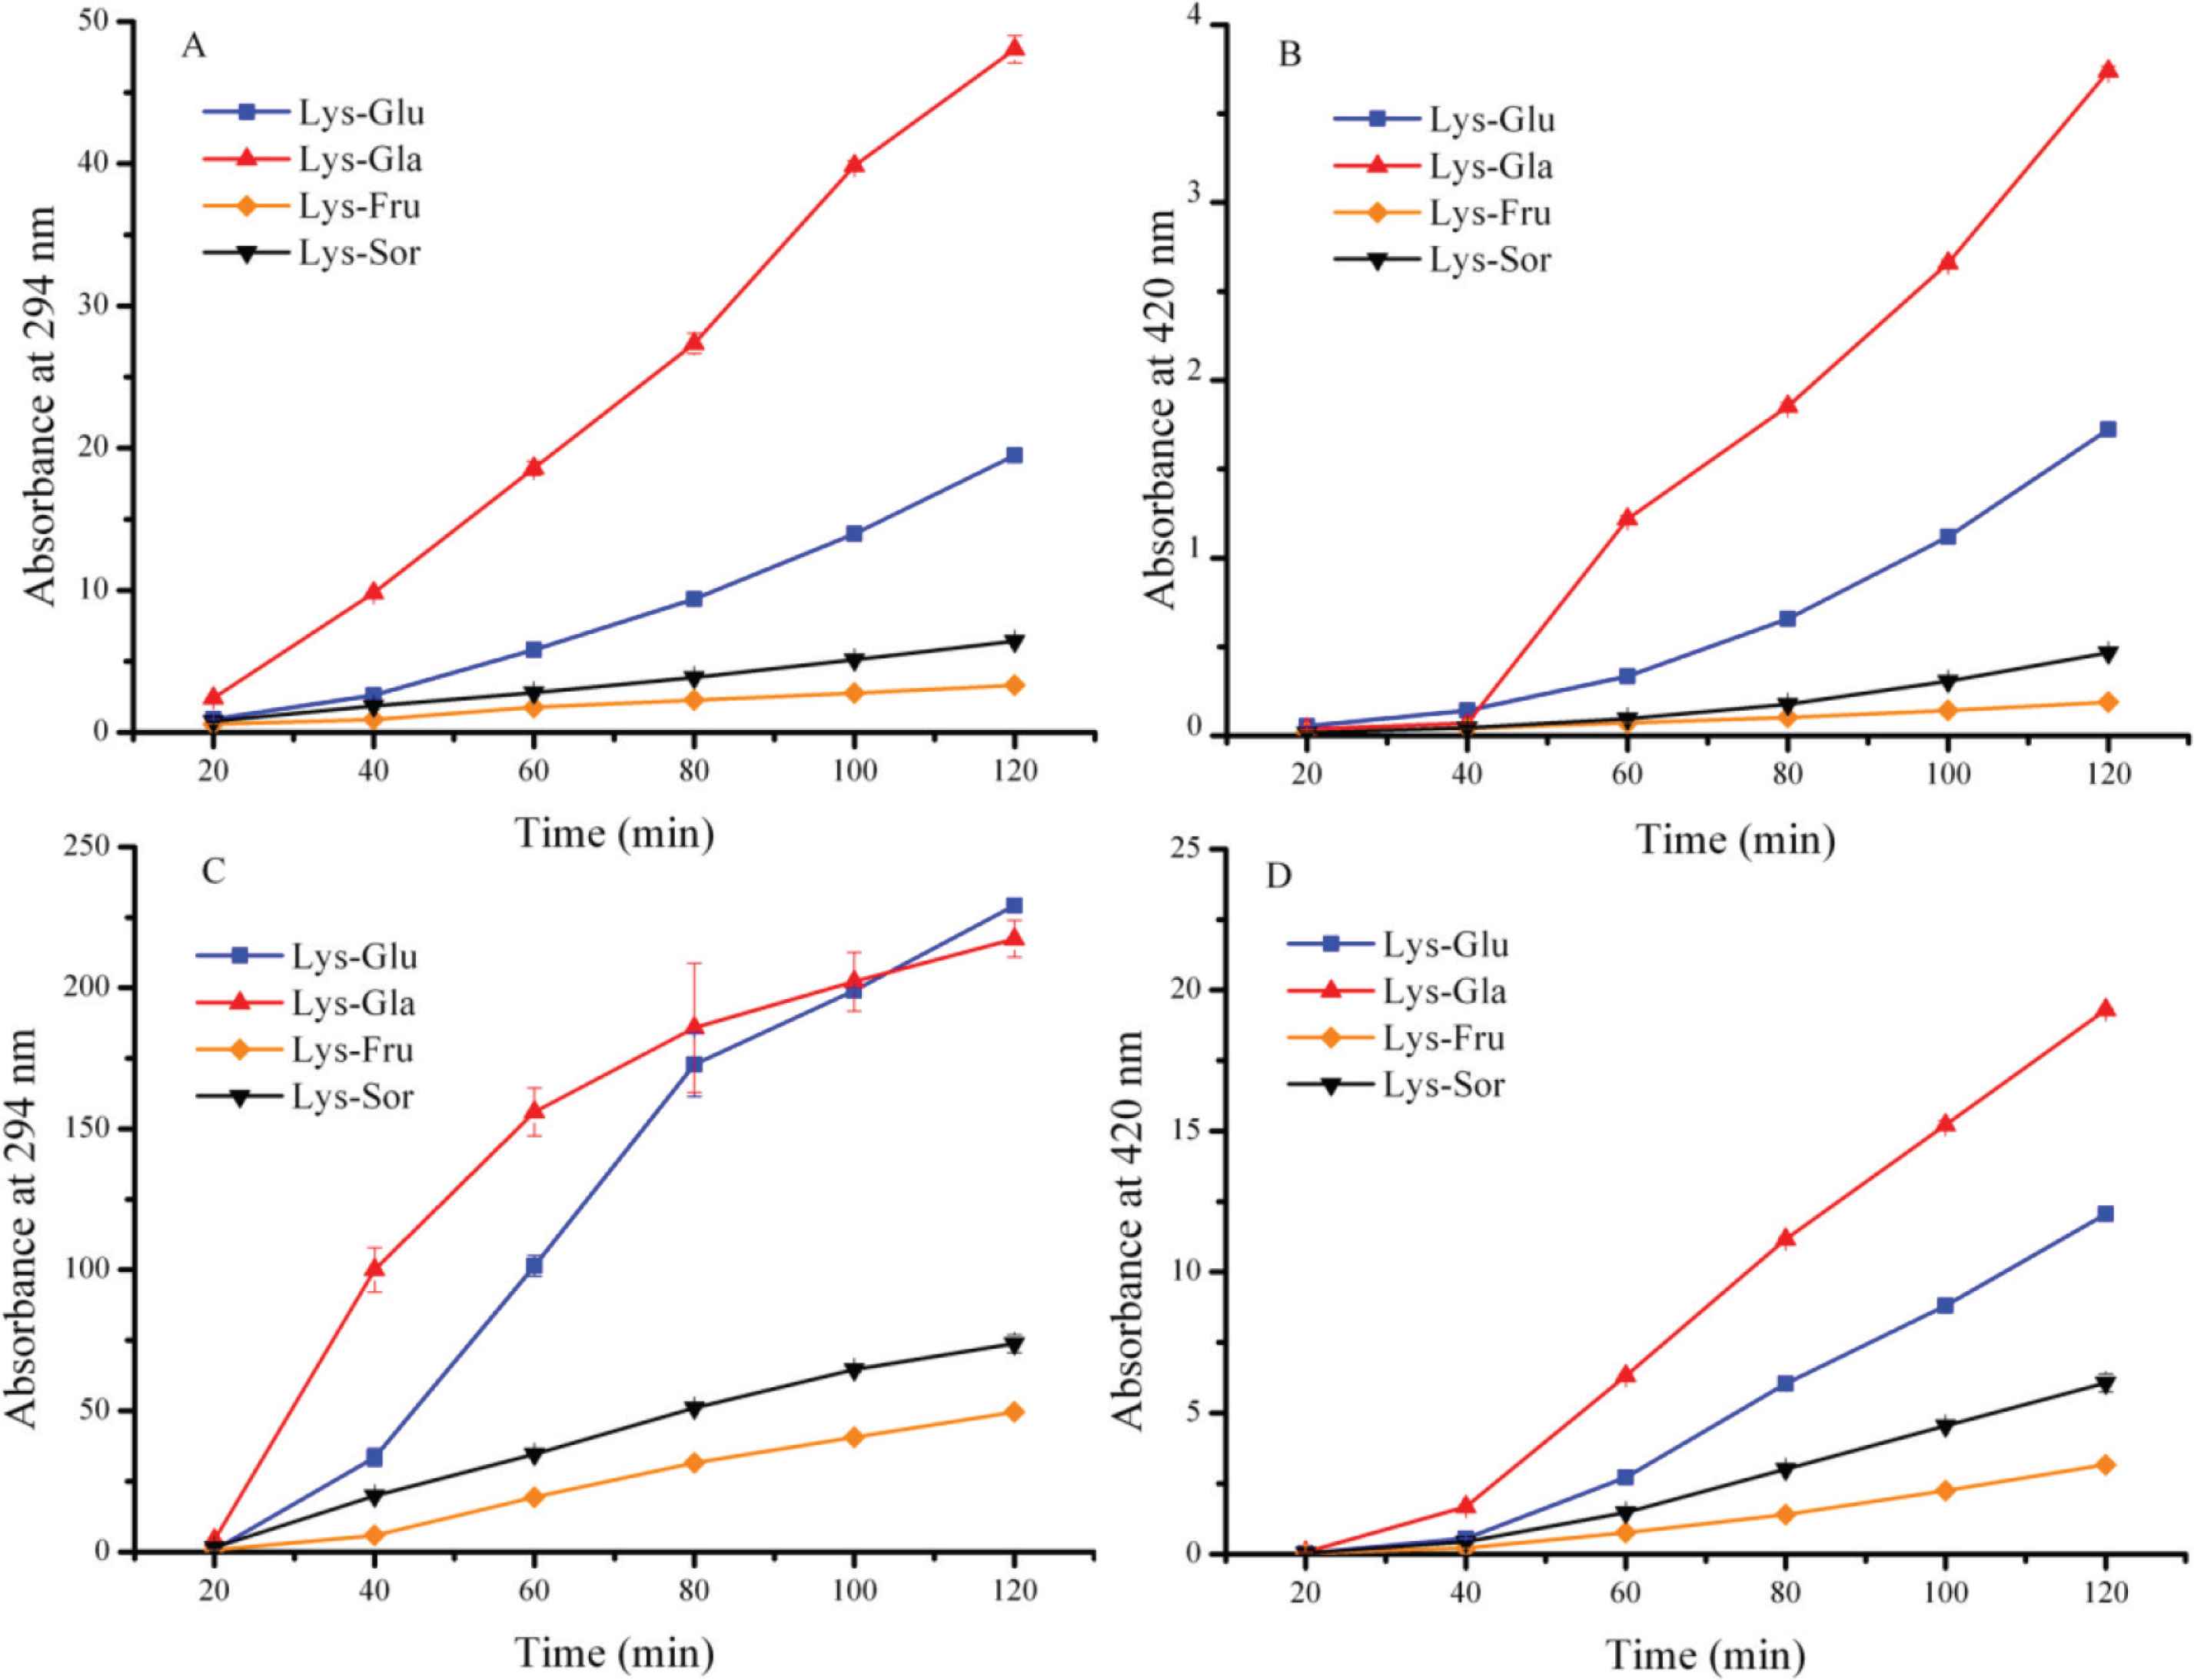
The change of absorbance over time at 80°C (A and B) and 100°C (C and D), respectively.
The intermediate and advanced stage products of the solutions accumulated gradually along with the reaction. Therefore, their absorbance values also increased gradually. As depicted in Figure 4A and 4C, the non-fluorescent intermediate products increased significantly (p < 0.05) over time. The amount of intermediate product and its formation rate were closely related to the heating duration and the type of sugar. This may because that the early stage products were Amadori compounds for aldose and Heyns compounds for ketose. The Amadori/Heyns compounds will form different intermediates through different enolization routes. For aldose systems, the content and accumulation speeds of the colorless compound were higher and faster than those of ketose systems. This finding agrees with Benjakul, who found that different types of sugars contributed greatly to the generation of intermediate products in the porcine-plasma protein-sugar system [27]. The deepening of the color indicated the formation of a brown polymer like melanoidin in the reaction solution. At the final stage of the Maillard reaction, brown macromolecular matters were gradually accumulated [27–29]. As shown in Figure 4B, the degree of browning of the aldose systems is dramatically (p < 0.05) higher than those of ketoses, with this degree in occurring in the order of galactose > glucose > sorbose > fructose. This may because that the reactivity of aldose is larger than that of ketose, thus galactose is more prone to participate in the Maillard reaction [30].
3.4. Generation of GO, MGO, and 3-DG
The α-dicarbonyl compounds are important intermediates in the Maillard reaction and can be formed by the oxidation of sugars, the degradation of Amadori products, or through inverse aldol condensation of sugars through caramelization [14,31]. Figure 5A–5C shows the production of GO, MGO, and 3-DG at 80°C respectively, while Figure 5D–5F shows the results at 100°C. The production of GO, an important intermediate of CML, increased over time at the beginning of the reaction. Subsequently, the GO content in the solution may reach its highest value. In Figure 5A, the peaks value of GO in the aldose systems occurred at 60 and 80 min for galactose and glucose, respectively. However, it did not exist in either ketose system. The GO content increased continuously upward from 0 to 120 min in the ketose systems. At 100°C, we can see from Figure 5D that the accumulation of GO was higher and that the maximum accumulation appeared faster than those in Figure 5A. In addition, the reaction speed of ketose increases with temperature. Hence, the GO content in the ketose system also showed a maximum as in the aldose system.
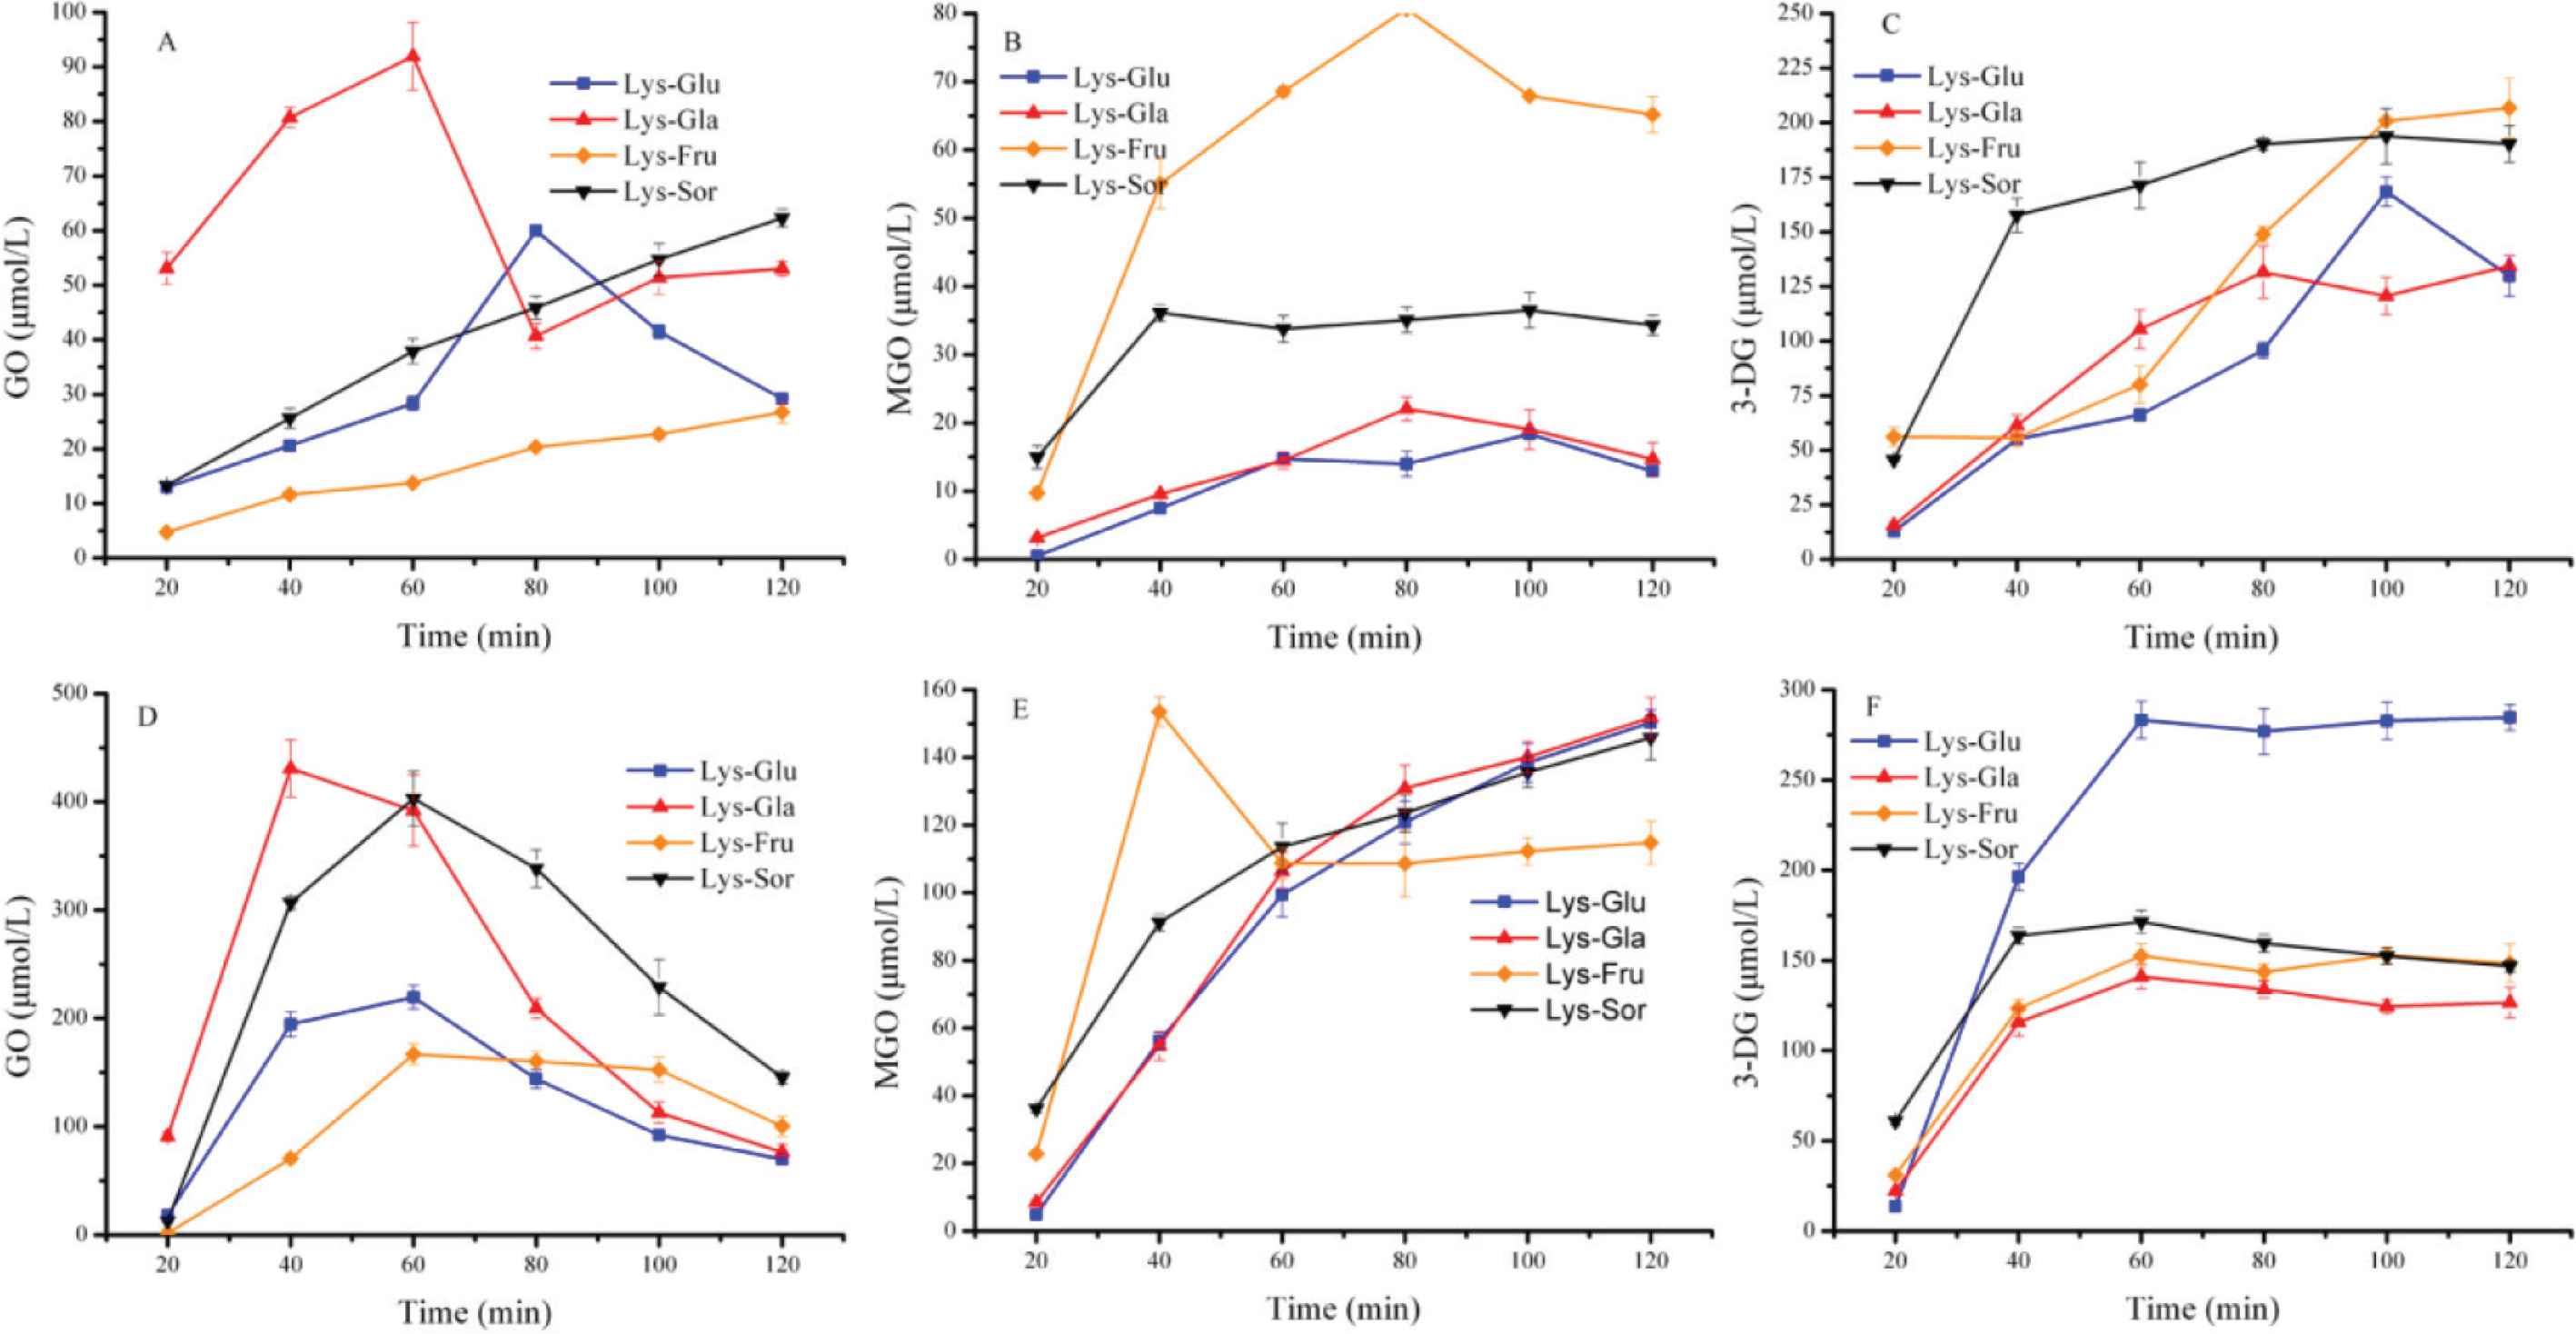
The production of GO, MGO, and 3-DG at 80°C (A–C) and 100°C (D–F), respectively.
The generation of MGO, the intermediate of CEL, was also related to reactive duration. As seen in Figure 5B, the production of MGO in the ketose systems was higher than in the aldose systems. The amount of MGO was high at early stages (0–40 min) in ketose systems, especially fructose-lysine systems. Moreover, there was a peak value of MGO in ketose (fructose) systems. For aldose system, the production of MGO increased over time from 0 to 120 min. From Figure 5E, ketose was more likely to produce MGO than aldose at 100°C.
In aldose- and ketose-lysine systems, the amount of 3-DG generated was markedly higher than that of GO and MGO. As depicted in Figure 5C, the maximum accumulation of 3-DG in ketose systems was higher than in aldose systems. In ketose systems, the rapid growth of 3-DG occurred at 20 and 60 min for sorbose and fructose, respectively. For aldose systems, there was almost no difference in the amount of 3-DG between galactose and glucose from 0 to 40 min. As shown in Figure 5F, there were peak values of 3-DG for both systems at 100°C.
In aldose- and ketose-lysine systems, the change in intermediate content was a dynamic process over the heating duration. In the early stages of the reaction, the intermediate-formation rate was greater than its consumption rate, leading to the accumulation of intermediates in the solution. With further development of the reaction, the consumption rate increased gradually and the intermediate content in the solution began to decrease. Therefore, the intermediate content peaked at some point during the reaction. This result agreed with Han, who found that the GO content would peak during heating in a different lipid-lysine model system [32,33]. The reaction temperature had an obvious effect on the intermediate-formation rate. In our study, the difference between the two types of systems was relatively distinct at the early stage of the reaction (0–40 min). Chen reported that, although the reaction constant of galactose was greater than that of glucose in aldose systems, the difference in MGO production between the two systems was not apparent during the early stage (0–4 h), which differed from our study [28]. This may have been due to the lower reaction temperatures in his research (45°C and 60°C). As shown in Figure 5, the type of sugar significantly affected the formation of intermediates. The aldose and lysine condensates rearrange to formed Amadori compounds through Schiff-based reactions. Analogously, Heyns compounds were produced for ketose. 3-Deoxyglucosone could be formed by degradation of Amadori/Heyns compounds and MGO was proposed to form from 1-deoxyglucosone and 3-DG [14,34]. In this paper, we found that aldose systems were more prone to form GO whereas ketose systems were more conducive to generating MGO and 3-DG which were finding is similar to Taş et al.’s [35] research.
3.5. Generation of CML, CEL, and Pyr
Figure 6A–6D shows the production of AGEs in solution at 80°C and 100°C, respectively. As depicted in Figure 6A and 6C, the effect of sugar on the generation of CML depended on temperature. In both types of systems, the production of CML increased gradually with heating duration. At 80°C, the content of CML in the aldose system was similar to that in ketose system at 80 min, except for fructose. Subsequently, the CML-generation rate accelerated in the aldose system, especially for galactose. For ketose systems, the fructose system exhibited the lowest generation of CML; after 60 min of heating, the rate of CML formation in the fructose system was much lower than in other sugar-lysine systems. The formation of CML at 100°C was not the same as 80°C. As shown in Figure 6C, ketose appears to produce more CML than aldose at 100°C. The production of CML in the ketose systems (sorbose > fructose) was higher than that in the aldose systems (galactose > glucose).
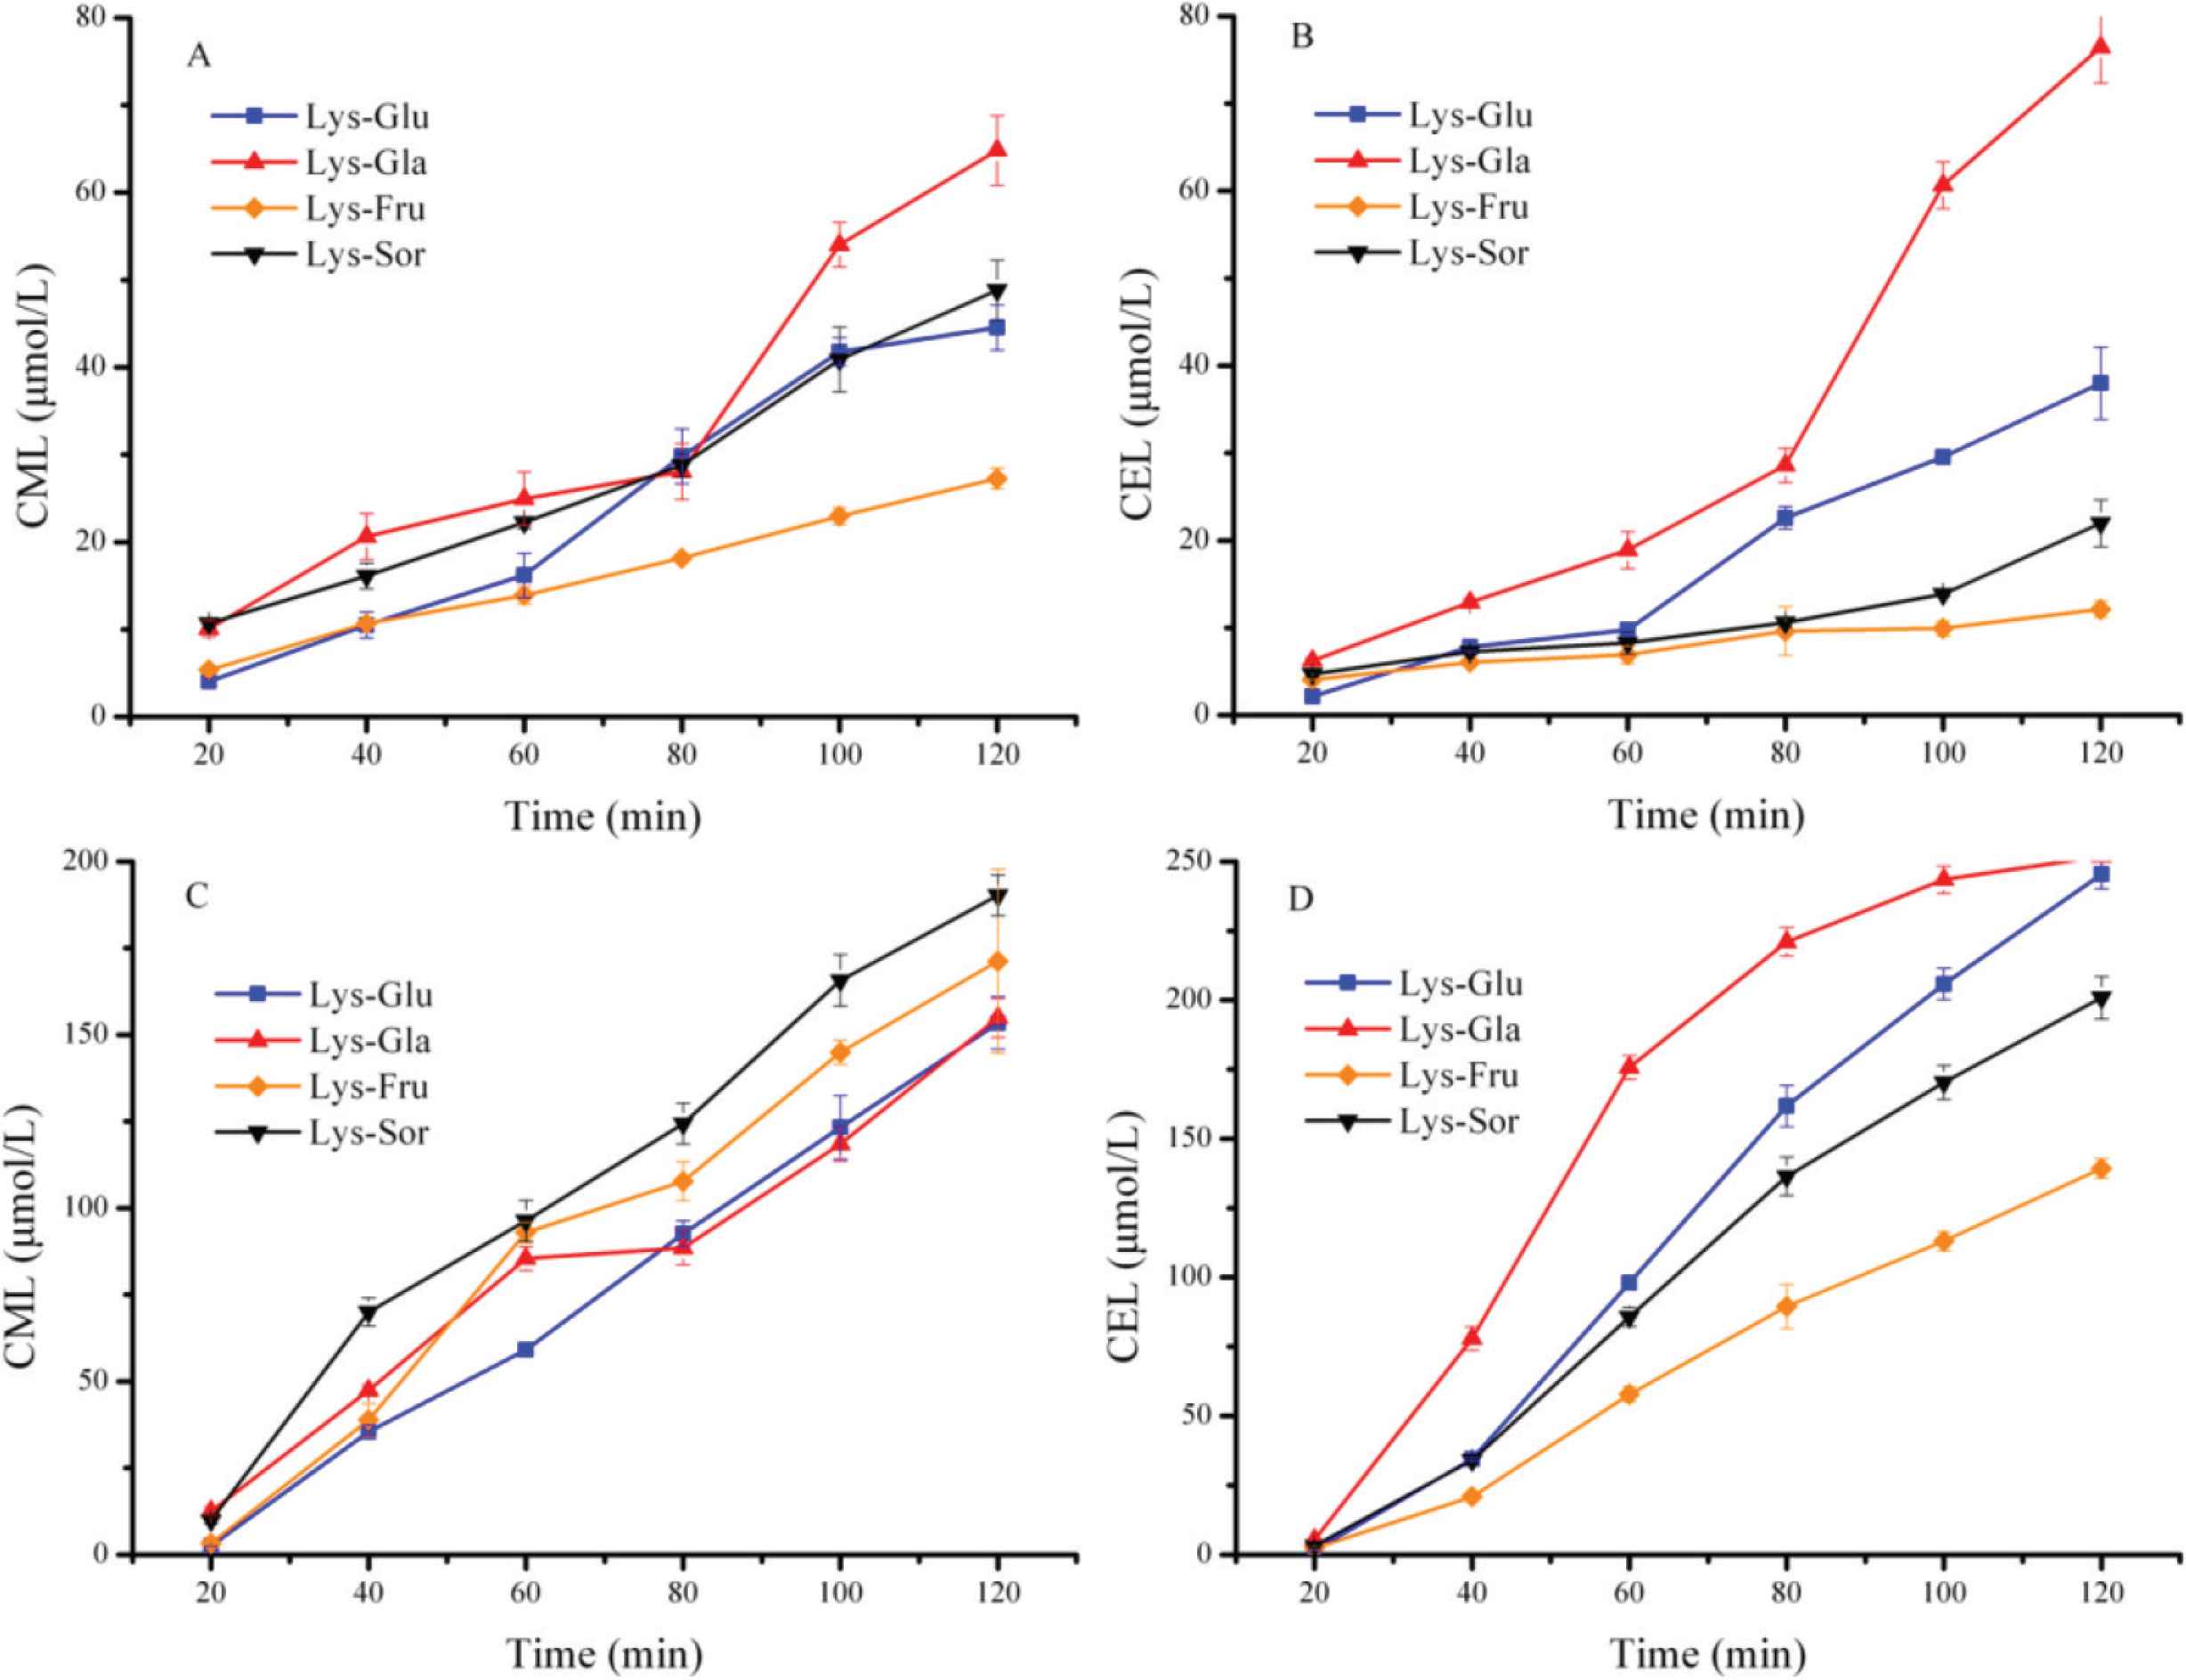
The production of AGEs in solution at 80°C (A and B) and 100°C (C and D), respectively.
At both 80°C and 100°C, the formation of CEL showed similar behavior. From Figure 6B and 6D, aldose was more liable to form CEL than ketose. As shown in Figure 6B, the generation of CEL in both aldose systems was obviously higher than in ketose systems at 80 min. The formation rate of CEL in both ketose systems was slow over 0–120 min. As with the formation of CML, the fructose system showed the lowest production of CEL. The difference in the formation of CEL between system types was more obvious when the temperature rose to 100°C. The production of CEL in aldose systems was higher than that in ketose systems.
Temperature played a very important role in the production of Pyr. Although the 3-DG content in the system was high, the generation of Pyr was not detected in our present study. This was similar to Liang et al.’s [20] research, who found that the formation of Pyr was rare at lower reaction temperatures (60°C and 80°C). CEL was principally formed during MGO reaction with lysine residues [36]. The content of MGO was high in the ketose systems, but little CEL was produced. Therefore, the reaction-mechanism formation of MGO to form CEL requires further study. It is generally accepted that the relative reactivity of glucose (aldose) is higher than that of fructose (ketose) [19,29,30,37]. However, the opposite has been proposed occasionally [20,38]. In the present research, aldose (glucose and galactose) is more liable to generate AGEs than ketose (fructose and sorbose). This conclusion was demonstrated by absorbance data at 249 and 420 nm. Nonetheless, sorbose, as a kind of ketose, also showed a relatively high reactivity in the Maillard reaction. Therefore, the influence of sugar on Maillard reactions could not be easily distinguished between aldose and ketose. Hence, further investigation is essential and necessary.
4. CONCLUSION
Results showed that aldoses more readily participated in Maillard reactions than ketoses. The aldose systems were prone to form GO while ketose systems were liable to generate MGO and 3-DG. An interesting finding was that aldoses were more prone to form CEL than ketoses at both 80°C and 100°C; however, the CML content in ketoses was higher than in aldose at 100°C. Thus, the formation of CEL was not obviously related to the MGO content in the solutions. In future study, the fate of CML and CEL can be investigated by the reaction of the intermediates with lysine, which is helpful for understanding the reaction route. The formation relationship of CEL and MGO also needs further study in the future. In addition, the reaction rate is deeply affected by heated temperature. Hence, the effect of temperature on the formation of AGEs must be further investigated.
CONFLICTS OF INTEREST
The authors declare they have no conflicts of interest.
AUTHORS’ CONTRIBUTION
CX contributed in investigation, validation and writing (original draft) the manuscript. ZS contributed in data curation, investigation, validation and writing (original draft) the manuscript. ZH, ZW and FQ contributed in formal analysis. JC and MZ contributed in funding acquisition. ZS and MZ contributed in methodology. MZ contributed in project administration. JC and MZ contributed in supervision. MZ contributed in writing (review and editing) the manuscript.
ACKNOWLEDGMENTS
This work was supported by the
Footnotes
REFERENCES
Cite this article
TY  - JOUR
AU  - Chaoyi Xue
AU  - Zhenhua Shi
AU  - Zhiyong He
AU  - Zhaojun Wang
AU  - Fang Qin
AU  - Jie Chen
AU  - Maomao Zeng
PY  - 2020
DA  - 2020/05/14
TI  - Formation of Three Selected AGEs and their Corresponding Intermediates in Aldose- and Ketose-lysine Systems
JO  - eFood
SP  - 270
EP  - 278
VL  - 1
IS  - 3
SN  - 2666-3066
UR  - https://doi.org/10.2991/efood.k.200508.001
DO  - 10.2991/efood.k.200508.001
ID  - Xue2020
ER  -