
Evaluation of Climate Change Risk Perception in Baoji City Based on AHP-Bayesian Network
 , Qi Zhou1, 2, 3, *, Shuo lin Geng1, 2, 3
- DOI
- 10.2991/jracr.k.201214.001How to use a DOI?
- Keywords
- Climate change risk perception; Bayesian network; AHP; Baoji area
- Abstract
To analyze the gap between the Baoji population’s climate change risk perception and the scientifically measured intensity, danger degree, vulnerability, and exposure of climate change risk based on the basic elements of risk assessment, this paper combines analytic hierarchy process and the Bayesian network to evaluate the climate change risk perception intensity in Baoji City, aiming at simulating climate change risk scenarios and improving the objectivity of assessment results. Specifically, the simulation of climate change risk scenarios is carried out through the measurement of such basic elements as risk, vulnerability, and exposure perceptions, and an objective evaluation of the public climate change risk perception intensity in Baoji City is made, thereby systematically assessing local people’s perception of climate change risk. The model weights the indices of risk perception, vulnerability perception, and exposure perception by analytic hierarchy process, constructs the Bayesian network according to the causal relationship among the risk perception assessment elements, and calculates the risk perception probability at each level by combining the Bayesian network to get the system perception intensity. The perceived intensity of climate change risk was 0.497, being at a medium level. The result has different reference value in terms of the response to and management of different climate change risk categories, so it needs to be adjusted according to the actual situation of Baoji City. The main factors that affect the risk perception intensity in Baoji City are gender, climate change perception trend, ecological environment deterioration degree, and disaster severity degree. Therefore, the decision-makers can make risk management plans accordingly, which plays an important role in regulating and narrowing the gap between people’s perception of climate change risk and the results of scientific measurement.
- Copyright
- © 2020 The Authors. Published by Atlantis Press B.V.
- Open Access
- This is an open access article distributed under the CC BY-NC 4.0 license (http://creativecommons.org/licenses/by-nc/4.0/).
1. INTRODUCTION
The most widespread source of the term “risk” comes from fishermen going out to sea to fish [1]. With the rapid development of modern technology and industrial economy, the concept of “risk” has gradually developed to involve the theoretical explanations of “uncertainty” and “probability”, as well as “loss” and “income” [2]. “Perception” is the combination of sensation and perception. It is the direct reflection of objective things in human brain through sensory organs and a perceptual cognitive process [3]. In a broad sense, perception refers to the functional performance of any organism’s physiological characteristics, whereas in the narrow sense, it refers to the cognitive process of information processing in the human brain [4]. “Risk perception” is also equivalent to “risk” to a certain extent [2]. The concept of “risk perception” was initially an exploratory analysis of consumers’ purchasing behavior and expected psychology [5], and then gradually extended to the fields of financial risk, social risk, internet consumption, and natural disasters [5]. Due to different perspectives in different fields, the methods of defining risk perception also differ greatly. As an important field of risk perception, climate change risk perception is the direct cause of risk response and behavior. It is of great practical significance to study individuals’ perception of climate change risk [5]. For example, James W. Stoutenborough and others compared the general assessment of climate change risk perception with its specific assessment. Two of the three sub-fields of public health, namely economic development and environment, were general risk assessment predictors [6]. Aishath Shakeela and others used the social amplified risk framework to assess the climate change risk perception of tourism leaders in coastal scenic spots. The study provided specific references for policy formulation. Low-risk conflicts could attract jobs, tourism investment, and tourists. Risks should also be urgently emphasized in order to attract professional talents and financial supports so that the policy could be implemented smoothly [7]. Saki and others evaluated the climate change risk perception of farmers and herdsmen in Nevada and found that climate change-related beliefs and political orientations were the most significant determinants of climate change risk perception. Besides, gender played an important role in the formation of risk perception, while vulnerability and age had no significant effect on climate change risk perception [8]. Harlan and others assessed the perception of flood hazard risk among urban residents in the United States. The results showed that there was a significant correlation between flood risk perception and the vulnerability of urban residents, and the residents’ potential exposure to flood disaster significantly enhanced their perception of flood disaster risk [9]. Michal and others evaluated forest planners’ adaptation to climate change based on the framework of uncertainty theory. The results suggested that planners might only take action against such risks as pests and droughts that would threaten forests, without giving high priority to other risks arising from climate change [10]. Zhao Xinyi and others integrated the climate risk index and land vulnerability coefficient from 1961 to 2007 in the middle part of the farming-pastoral ecozone in Northern China (including Hebei Province, Inner Mongolia Autonomous Region, and Liaoning Province) to obtain the ecological risk index, so as to delimit the ecological risk grades and evaluate ecological risks in the northern farming-pastoral zone [11]. Pan Genxing and others assessed the reduction risk of meteorological yield resulted from climate change by using three evaluation indicators of yield reduction rate, variable yield reduction rate, and high-risk probability, as well as other comprehensive indices [12]. Zhou Qian and others, taking the knowledge-attitudinal practice model as the theoretical framework, constructed the assessment index system for residents’ flood risk perception in China from the three aspects of knowledge, attitude, and behavior [13]. Wang Xiaofeng and others took tourists of the Nangong Mountain scenic zone as research subjects, and constructed a three-level index system for rainstorm disaster risk perception evaluation through principal component analysis from the four aspects of disaster knowledge, attitude, behavior, and bounded rationality [14]. Wang Xiaofeng used Analytic Hierarchy Process (AHP) and exponential model to quantitatively calculate the risk perception index, and the tourists’ risk perception ability and individual differences were finally evaluated [15]. In order to effectively reduce the negative effects of climate change, Chang Cheng and others employed the multiple linear regression to identify factors influencing farmers’ perceived vulnerability and measure the climate risk faced by farmers’ apple production in the Loess highland [16]. Yekenalem and others used GIS applications and Bayesian belief network models, which could quantify the uncertainty and capture the accidental connections between the influencing factors of flooding, to assess the vulnerability of cities to small floods. The authors believed that assessing the vulnerability of urban areas to floods was a critical step toward mitigating risks and making adaptation plans [17]. Similarly, Lawrence and others used Bayesian network methods to analyze the vulnerability of suppliers to severe weather risks. The study investigated the main causal relationships and causes of risk spread and disruption in the US drug supply chain after the occurrence of Hurricane Maria. For intermediate events, a causal Bayesian model was established to describe the connection between risk events and quantify the associated cumulative risk [18].
At present, although domestic and foreign scholars have achieved certain outcomes in the study of climate change risk perception assessment, there are still deficiencies. Firstly, the research topics were mostly about influencing factors of climate change risk perception, agricultural production, adaptation methods, regional division, and measurement of climate change risk. Secondly, the research objects were mainly farmers, tourists, urban residents, and decision makers. Thirdly, most of the studies were not in-depth enough to investigate the public’s risk perception of climate change, which makes it impossible to standardize and strengthen risk response based on specific measurement results. Fourthly, while evaluating the level of climate change risk perception, most of the research employed regression analysis which is less compatible with related uncertain events. Although some scholars have used Bayesian networks to assess people’s perception of climate change vulnerability, there were few papers on systematic evaluation of climate change risk perception. Furthermore, previous studies had not compare people’s perception level of climate change risk with scientific evaluation results, thus failing to obtain corresponding reference standards to help people improve their perception of and response to climate change risk. Therefore, this paper starts from the nature of climate change risk perception and the possible loss caused by future climate change risk. In specific, the intensity or level of climate change risk perception is measured by the intensity of exposure perception, risk perception and vulnerability perception, and the AHP-Bayesian network model is used to evaluate people’s perception of climate change risk. In addition, a brief discussion is conducted on the gap between the public’s climate change risk perception intensity and the climate change risk intensity obtained based on scientific calculation. This will lay a foundation for the public to grasp the severity and harm of future climate change risk, so that they can make effective management and response in the face of emergencies. The problems to be solved in this paper are as follows: (1) What is the level of the public’s climate change risk perception in Baoji City? Is this result different from the climate change risk as assessed by scientists? (2) What are the main factors that affect people’s perception of climate change risk in Baoji City? Can these factors be used to bridge the gap between the public’s perception of climate change risk and scientists’ assessment of climate change risk? (3) In view of the above gap, what risk management measures should the public take?
2. MATERIALS AND METHODS
2.1. Study Area
Baoji City is located in the west of Guanzhong region, Shaanxi Province, between longitude 106°18′–108°03′ and latitude 33°35′–35°06′, with its east adjacent to Xianyang and Yangling Demonstration Area, south adjacent to Hanzhong, and northwest adjacent to Tianshui and Pingliang in Gansu Province. The Qinling Mountains in the south make its barrier. Weishui flows through its middle, and the northern Weishui is a fertile plain [19,20]. The city has a permanent population of 3.781 million and a total area of 18,117 km2. It belongs to the warm temperate zone, enjoying semi-humid continental monsoon climate, with an average annual temperature ranging from 7.9°C to 13.2°C, an average annual rainfall from 578 to 737 mm. Baoji has four distinct seasons. It is dry and cold in winter, while the climate in spring is changeable. In summer, hot arid weather and heavy rain alternately appear. In autumn, the temperature drops quickly and it is cloudy and rainy [21].
Baoji City is surrounded by mountains in the south, the west, and the north. Its middle part is relatively low and flat, and the eastern part is spacious and wide. With the Weihe River as the axis, it is in a shape of sharp-angled open trough. The landforms are classified into three types, namely mountains, rivers, and plateaus, among which mountains are the main landforms, accounting for 56% of the total area. Rivers account for 27%, and plateaus account for 17%. According to its topography and natural conditions, Baoji City can be roughly divided into the central plateau area, the southern mountainous area, and the western and northern shallow hilly areas. Due to its intricate nature, the city shows diverse climate types and obvious vertical differences, with frequent weather disasters. The extreme weather events have brought great inconvenience and loss to people’s lives [22–24]. In addition, with the accelerated urbanization and industrialization as well as the growing residential energy demand, the future impact of climate change on Baoji City will be greater [25]. Therefore, conducting a social survey in Baoji area to study the public’s perception of climate change risk and the formation mechanism is of vital significance for relevant policy formulation and people’s effective response (see Figure 1).
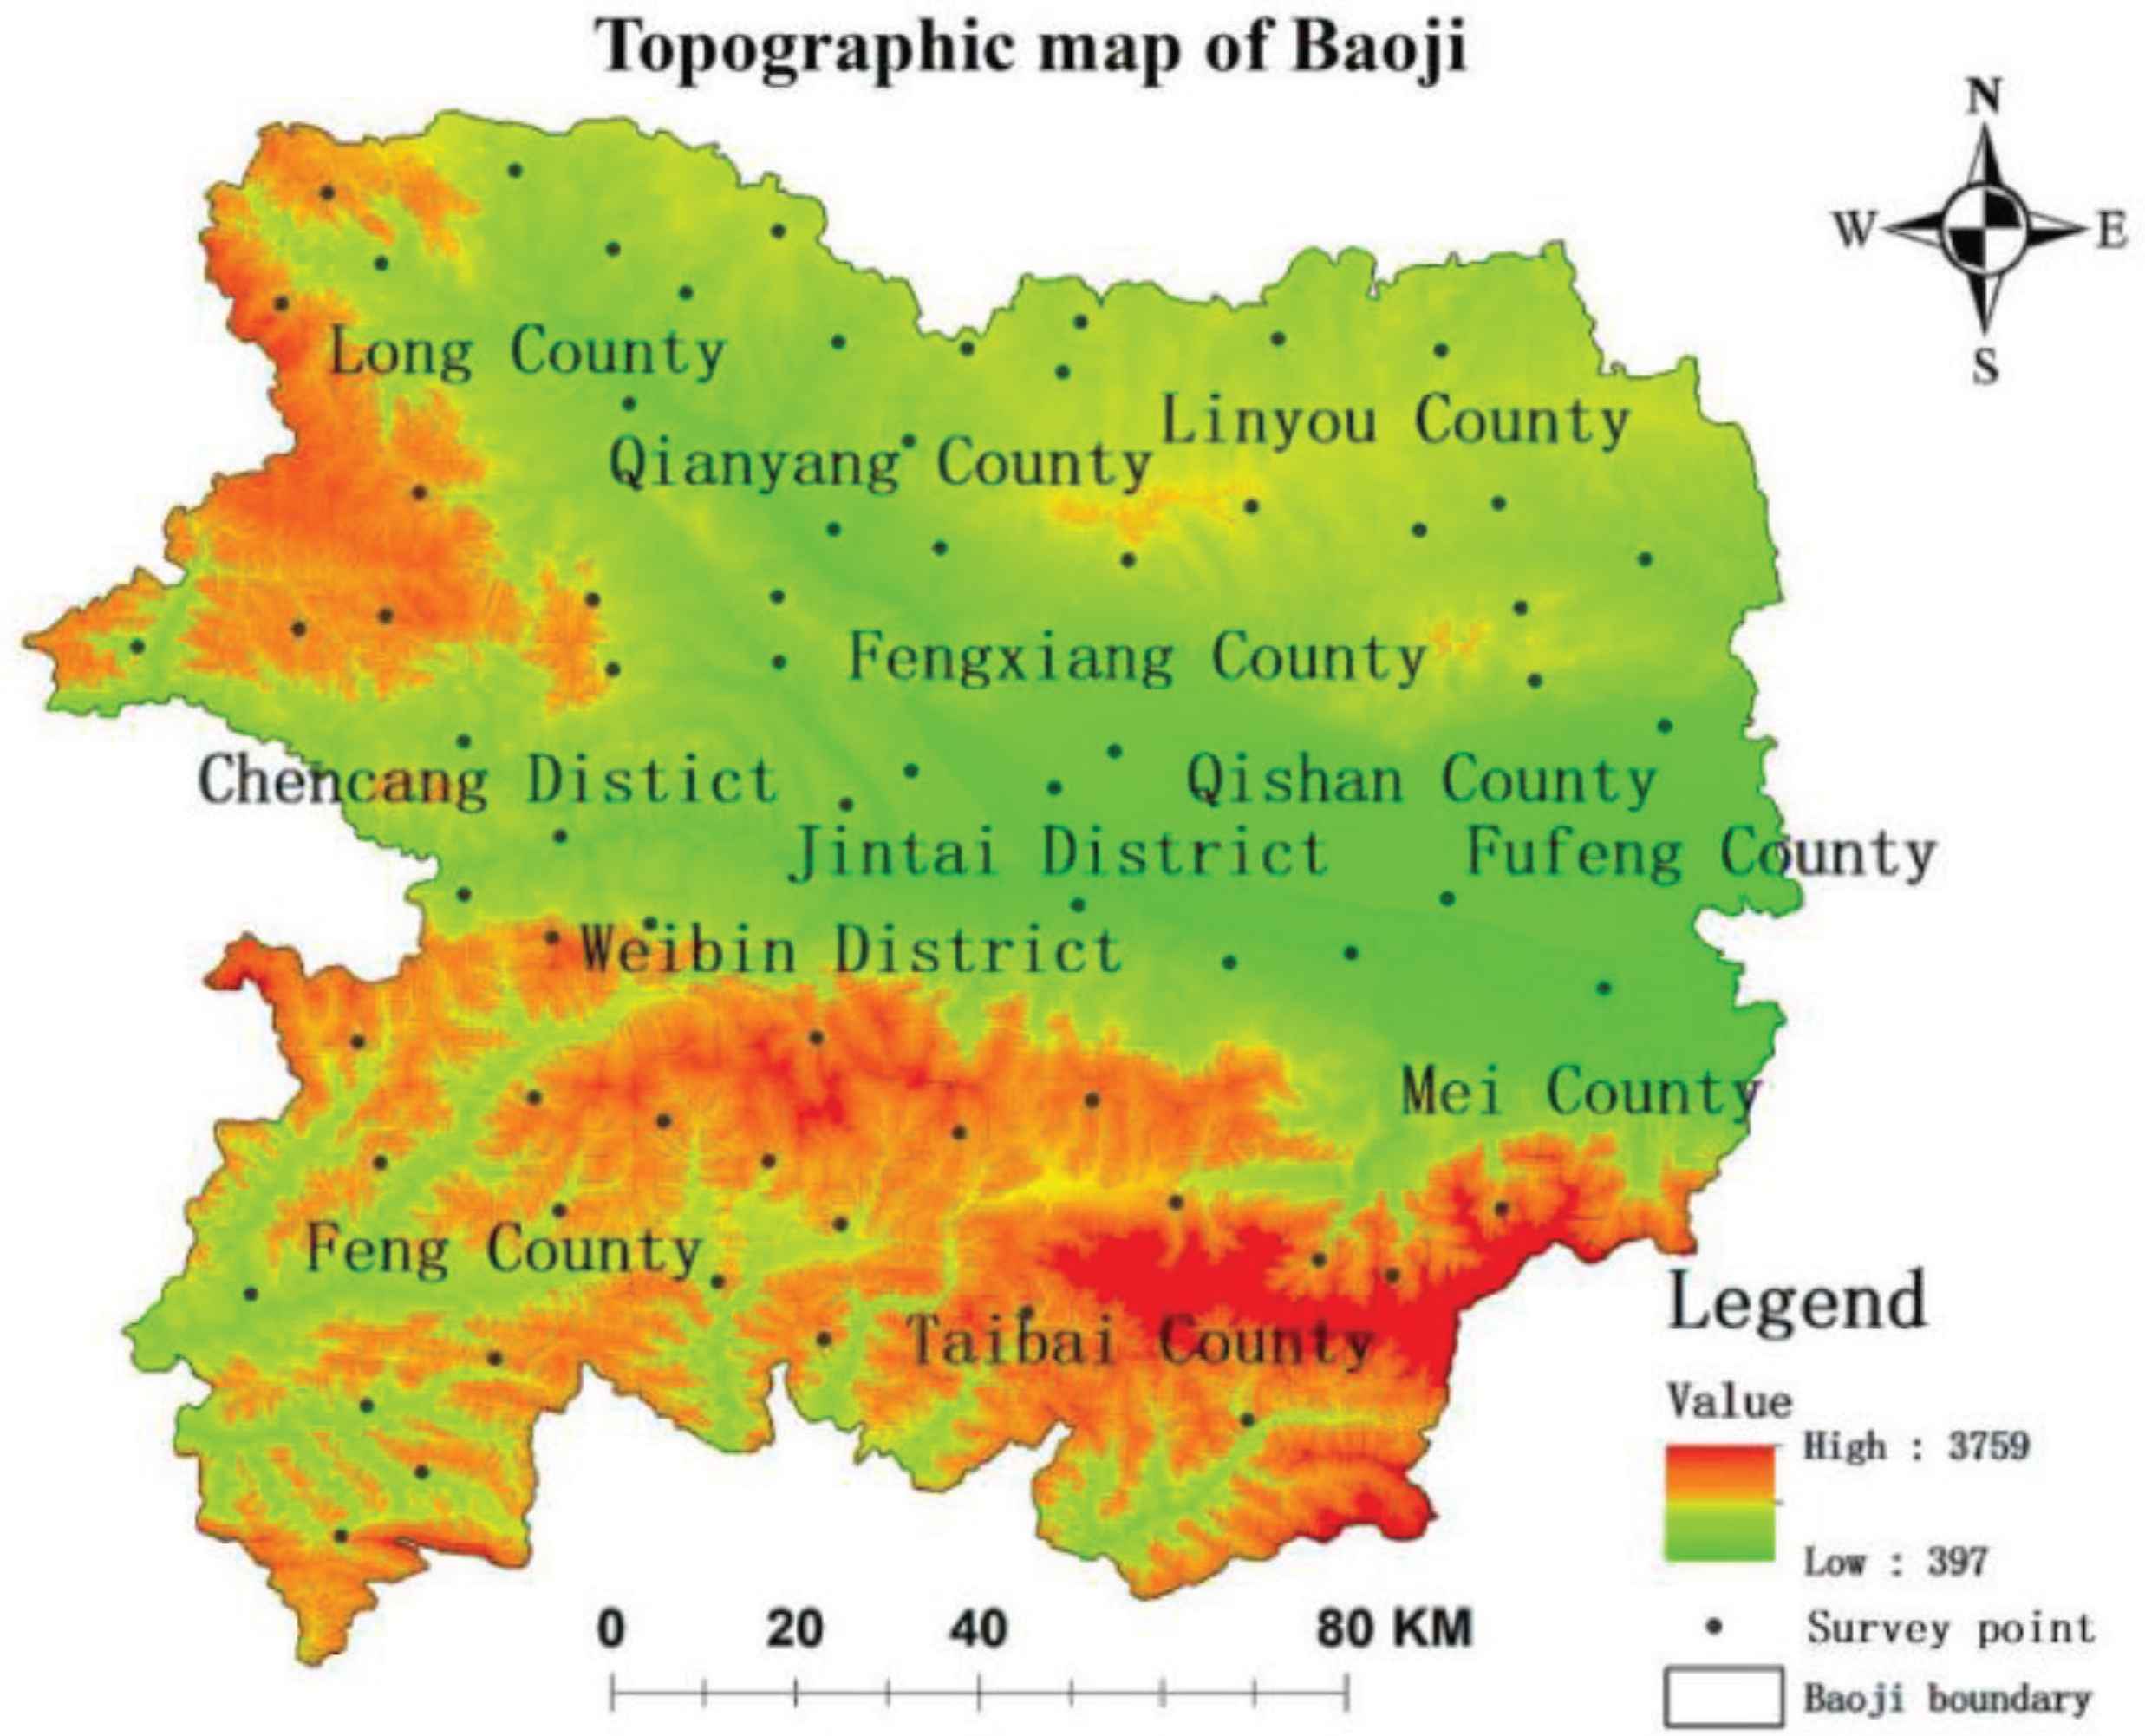
Overview of the study area.
2.2. Data Sources and Questionnaire Contents
According to the social survey conducted by the National Natural Science Foundation of China, the researchers visited three districts and nine counties in Baoji City from August 2018 to September 2020, mainly conducting random field surveys in urban and rural areas with large flow of people. This random survey method not only allowed us to obtain answers to the questionnaire questions, but also enabled the investigators to communicate with and interview the respondents on relevant scientific issues without inducing them to make choices. For survey respondents who were older or less educated, the investigators used question-style interviews to maximally facilitate their understanding of the questions to ensure the validity of the questionnaire. This method also ensured the authenticity and reliability of the data, thus laying a foundation for the follow-up research. A total of 1600 questionnaires were circulated and received, of which 1547 were valid, reaching an effective rate of 96.7% [26]. The distribution of the data survey samples was shown in Figure 1. The questionnaire was mainly composed of 37 questions, each with corresponding sub-questions. The basic information of the samples was shown in Table 1. As climate change is a long-term process, most of the respondents were over 30 years old, and their age structure was similar to that of the overall Baoji residents. The number of male and female respondents was similar, and the gender ratio was the same as that of the total population. The individual characteristics were similar to those of the total population structure [25], and thus the samples were highly representative.
| Survey item | Category | Frequency | Proportion (%) | Survey item | Category | Frequency | Proportion (%) |
|---|---|---|---|---|---|---|---|
| Education level | Primary school or below | 487 | 31.50 | Occupation | Animal Husbandry and Fishery | 283 | 18.30 |
| Junior high school-bachelor | 282 | 18.20 | |||||
| High school or Technical secondary school | 390 | 25.20 | Production and transportation work | 27 | 18.00 | ||
| 188 | 12.10 | ||||||
| Undergraduate or junior college | 200 | 12.90 | Service industry or business | 198 | 12.80 | ||
| 11.10 | |||||||
| Post-graduate | 255 | 16.40 | Government institution | 7 | 5.00 | ||
| Annual per capita household income | 500 and below | 377 | 19.20 | Technician | 195 | 12.60 | |
| 500–1000 | 25 | 24.40 | Medical staff | 148 | 9.60 | ||
| 1001–2000 | 32 | 27.15 | Mentor | 402 | 26.00 | ||
| 2001–3000 | 660 | 1.61 | Soldier | 163 | 10.50 | ||
| 3001–5000 | 306 | 21.00 | Self-employed worker | 75 | 4.80 | ||
| More than 5000 | 237 | 42.60 | Others | 49 | 3.20 | ||
| Age | Under the age of 18 | 182 | 19.80 | Gender | Male | 742 | 47.90 |
| 18–28 | 99 | 15.30 | Female | 805 | 52.10 | ||
| 29–38 | 31 | 11.80 | |||||
| 39–48 | 64.00 | ||||||
| 49–58 | 21.00 | ||||||
| 59–68 | |||||||
| 69 or more | |||||||
Basic characteristics of the survey respondents
The questionnaire consisted of four parts. First, the basic demographic characteristics of the respondents, such as gender, age, residence, education level, and occupation, were mainly used to understand their basic information, so as to facilitate the exploration of the relationship between demographic characteristics and various potential variables in the future. The second part examined people’s economic conditions and their resilience to the risks posed by global climate change, including the income level of personal economic expenditure, family income and expenditure level, other income and expenditure sources, economic income status of family members, basic medical insurance expenses of individuals and other family members, and total expenditure and income sources. Then came the measurement of the subjective perception of the risks posed by global climate change, which included the perception of environmental risk, exposure level, and vulnerability. Among them, the perception of risk was measured by investigating the local people’s perception of the extreme impact of extreme dangerous climate change events in different places and their changing trends; the perception of risk exposure was mainly measured using the latest psychological distance prediction method proposed in geography, and the specific methods including temporal distance, spatial distance, social distance, and probability distance; vulnerability perception was based on Chinese people’s sensitivity to global climate change and the two dimensions of resilience or recoverability. It was an in-depth measurement of the overall vulnerability level of people in Baoji City. Finally, the public’s attitude toward the risk of climate change and their perception level of the state characteristics of the natural environment were surveyed. As for the risks of climate change, this questionnaire mainly involved a number of instances, such as rainstorm, flood, drought, hail, diseases and pests in corps, thunder and lightning, sandstorm, infectious disease, high temperature, and haze. These choices were in line with the climate feature of Baoji City. The above four parts together constituted the climate change risk perception questionnaire, which provided data sources and supports for the investigation and research. All items were measured on a 5-point Likert scale (some questions were 4-point and 7-point respectively), thereby enabling uniform allocation of index options and ensuring the simplicity of the questionnaire (see Table 1).
2.3. Questionnaire Reliability and Validity Test
After the obtained questionnaire data was input into SPSS25.0, reliability analysis of the questionnaire was required to ensure the validity and reliability of the questionnaire. Reliability refers to the consistency and stability of measurement results, as well as the degree of consistency of results obtained by researchers when they make different measurements (in different forms or at different times) for the same or similar phenomena (or groups) [27,28]. The Cronbach coefficient of the questionnaire was tested as 0.644, with acceptable reliability. This indicated that the internal consistency of the questionnaire was relatively good, and the overall correlation between each question and the scale was relatively high, so further analysis could be continued. Questionnaire validity refers to the extent to which the questionnaire results achieve the expected purpose of the survey. The validity is mainly analyzed via exploratory factor analysis method, which takes each question in the questionnaire as a variable, conducts factor analysis on all questions based on the score of the survey results, extracts relatively significant factors, and classifies and summarizes the questions through the load value of each question on each factor. Noteworthily, before carrying out the factor analysis, it is necessary to ensure that the KMO value is greater than 0.5, which indicates a well-designed questionnaire structure. It was found that the KMO value in the present study was 0.897, revealing that the questionnaire had good structural validity and that the analysis of influencing factors of climate change risk perception could be continued (see Table 2).
| KMO value | 0.897 | |
|---|---|---|
| Bartlett’s sphericity test | Approximate chi-square | 19056.193 |
| df | 325 | |
| p-value | 0 | |
KMO and Bartlett tests
3. INTRODUCTION TO THE MODEL
3.1. Bayesian Network Model
The Bayesian network is a language of systems to elaborate the relationship between variables. It was designed by researchers for long-term research in order to deduce the probability of many uncertainties, and such network has been applied to various fields. It is a directed acyclic graph, consisting of nodes that represent variables and combinations that connect those nodes mutually, wherein the directed edges indicate the relation between nodes [29]. Bayesian network mainly evaluates uncertain events. In this paper, not only did the perception of climate change risk have certain subjectivity and randomness, but also the dissemination of climate change risk information was uncertain. Therefore, Bayesian network model served as a proper choice for the present study. A comparison between multiple linear regression and Bayesian networks was made in a later section of the paper for readers’ reference. The risk perception samples of climate change were obtained through the AHP method. Firstly, results from the independent study of the Bayesian network were utilized to divide indicators of climate change risk perception into high, medium, and low levels. Expectation–Maximization (EM) algorithm was then used to optimize parameters of the nodes and to get the Conditional Probability distribution of the Bayesian network. Besides, the medium probability of occurrence for the risk perception was set as 100% to diagnose the factors affecting risk perception of system. Risk control suggestions were proposed based on such results to enhance the risk perception of the public against the extreme climate change. The sensitivity analysis was used to study the effect of uncertainties of the model parameters, and to determine the factors that had the greatest influence on the nodes of the climate change risk perception (see Figure 2) [30].
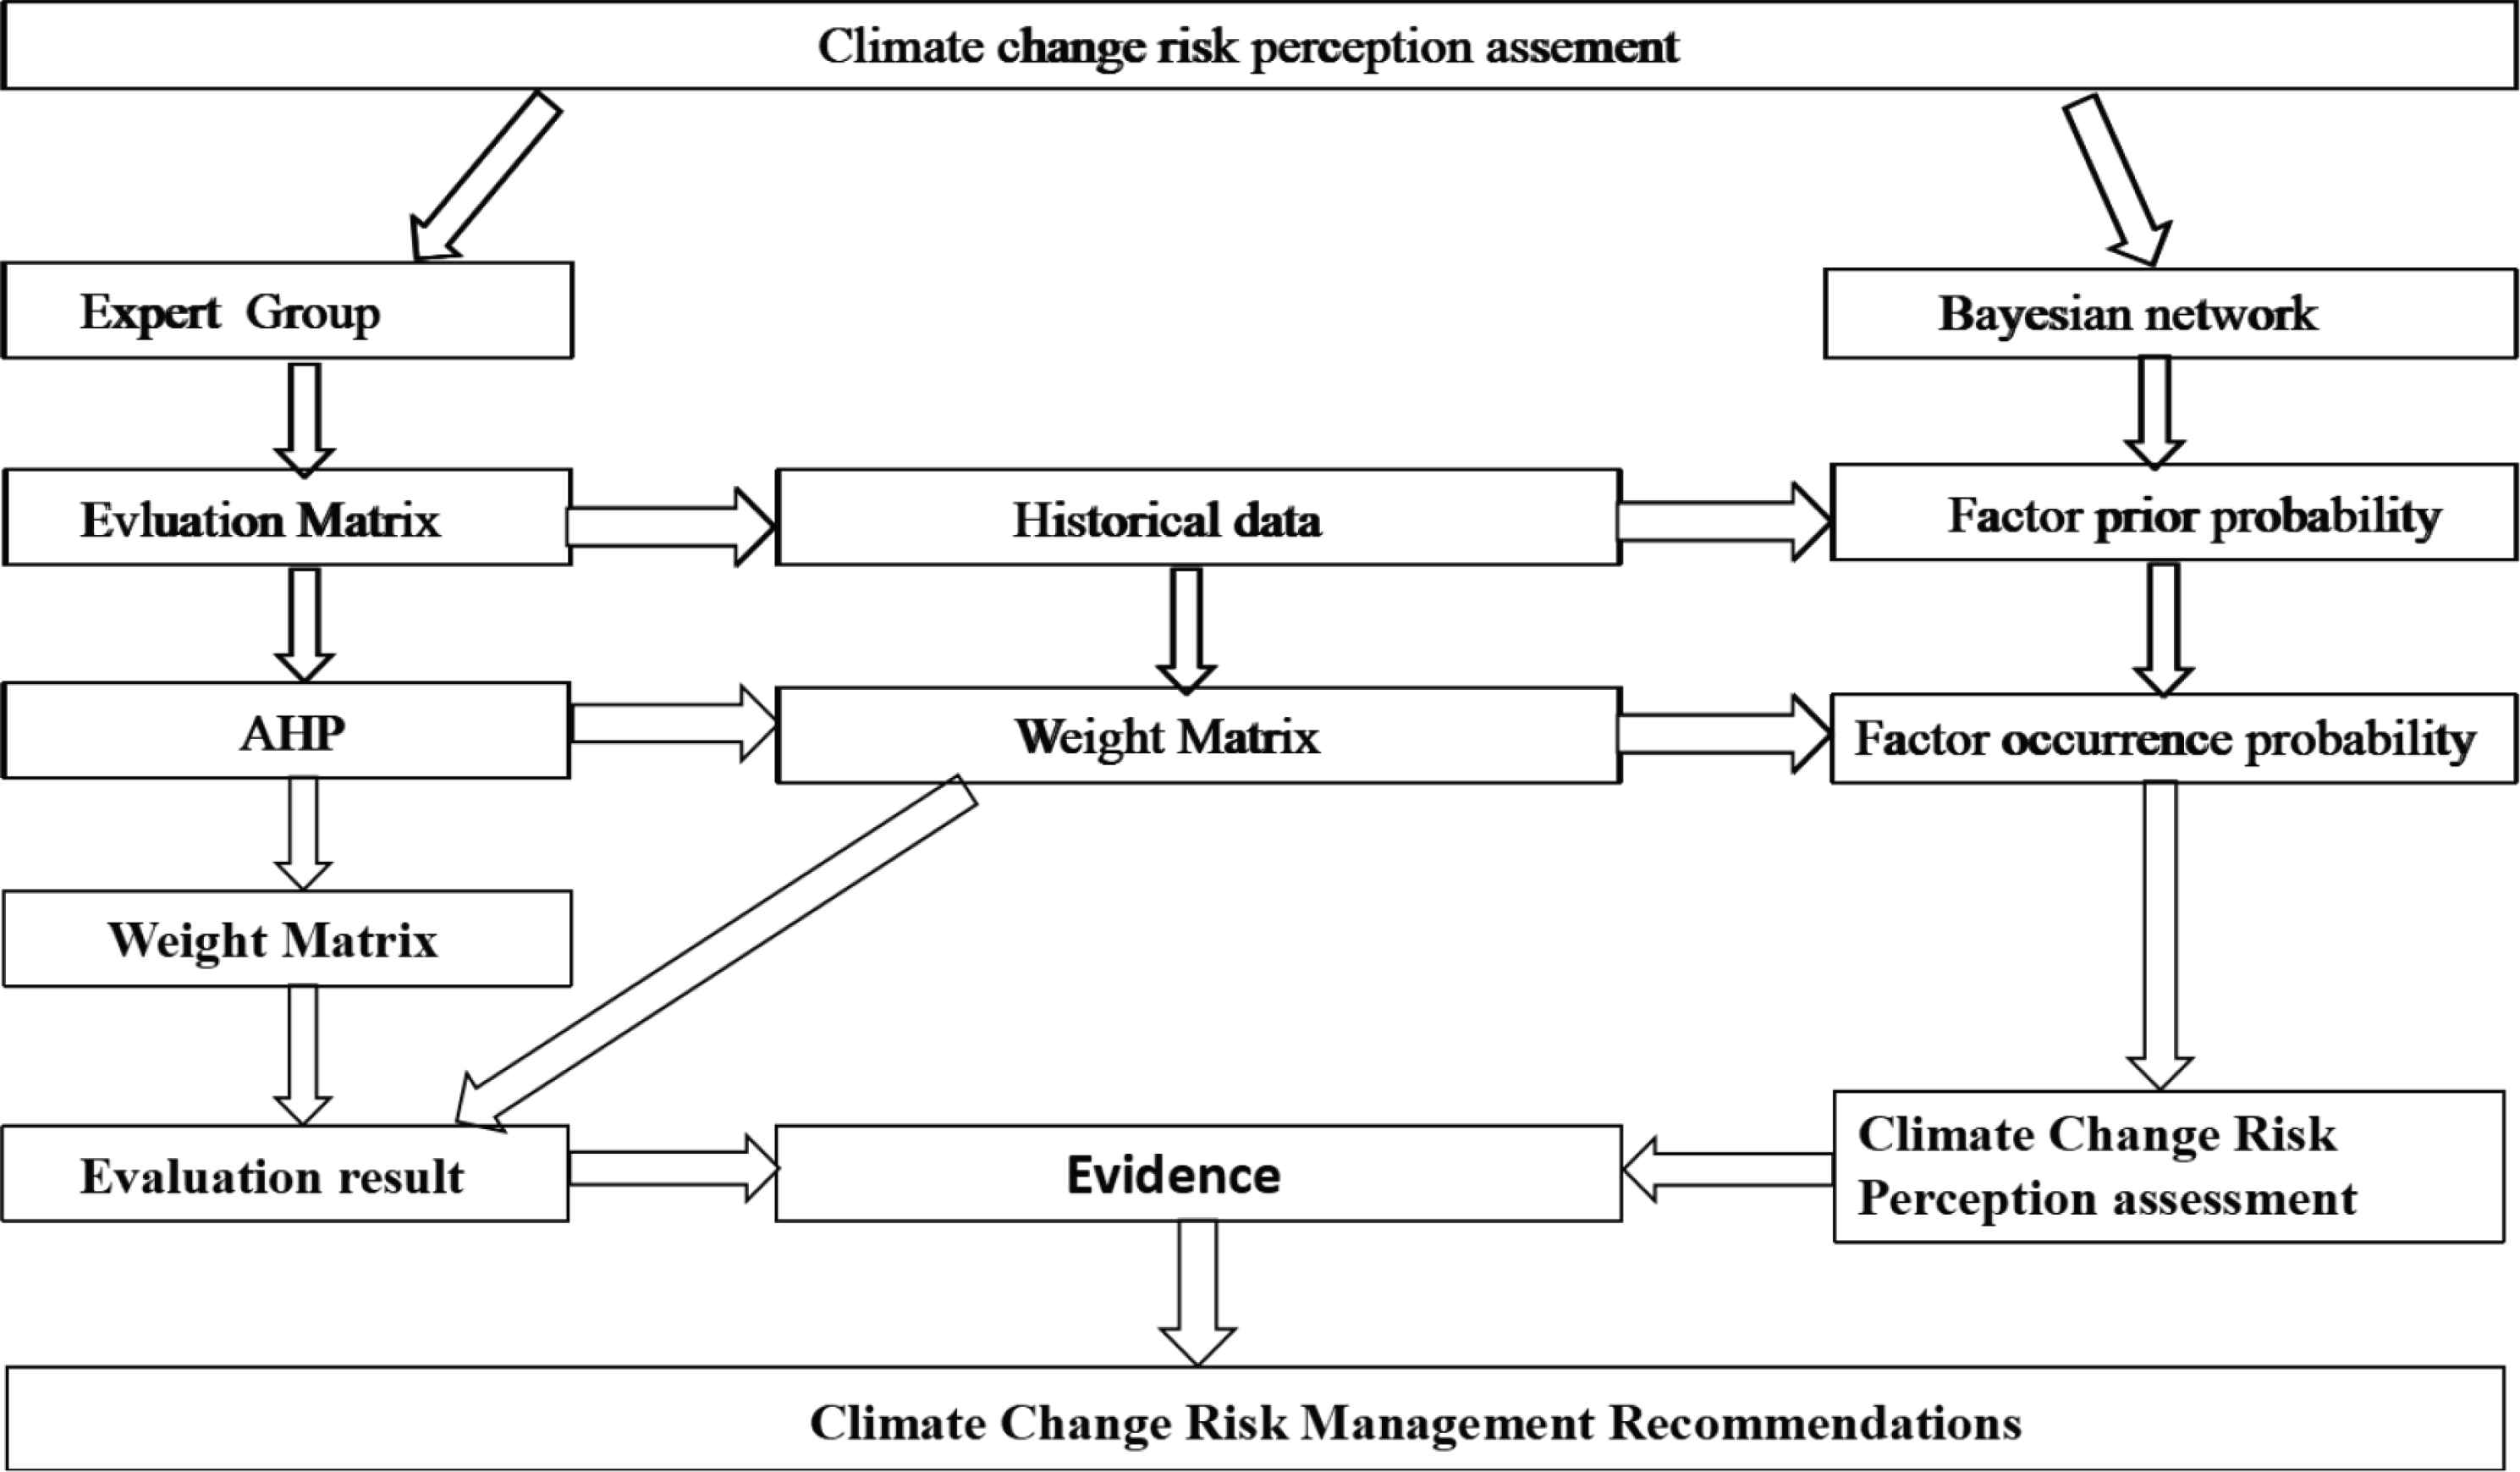
AHP-Bayesian network model of climate change risk perception assessment.
3.2. AHP-Bayesian Network Model of Climate Change Risk Perception
The model was established according to the following steps. Firstly, an assessment index system for the risk perception of climate change was built. Secondly, the range standardization method was used to process the data, which effectively solved the influence of the dimensions between participating indices, reduced the interference of human factors on index values, and enhanced the objectivity of the result [31]. Thirdly, the analytic hierarchy process was used to obtain the weights of different indicators. Furthermore, a reasonable Bayesian network model was built based on the interrelation among exposure perception, danger perception, vulnerability perception, and risk perception levels, and probability of occurrence of each node was attained via the machine learning of Bayesian network [29]. Finally, the intensity of the climate change risk perception was calculated and a certain intensity of perception was set to simulate the risk scenarios [32].
3.3. Establishment and Grading of Index System for Climate Change Risk Perception
The paper took Baoji City as the research area to verify the feasibility of the climate change risk perception assessment. The assessment index system for climate change risk perception was set up according to the assessment procedure of the climate change risk perception, as shown in Figure 3.
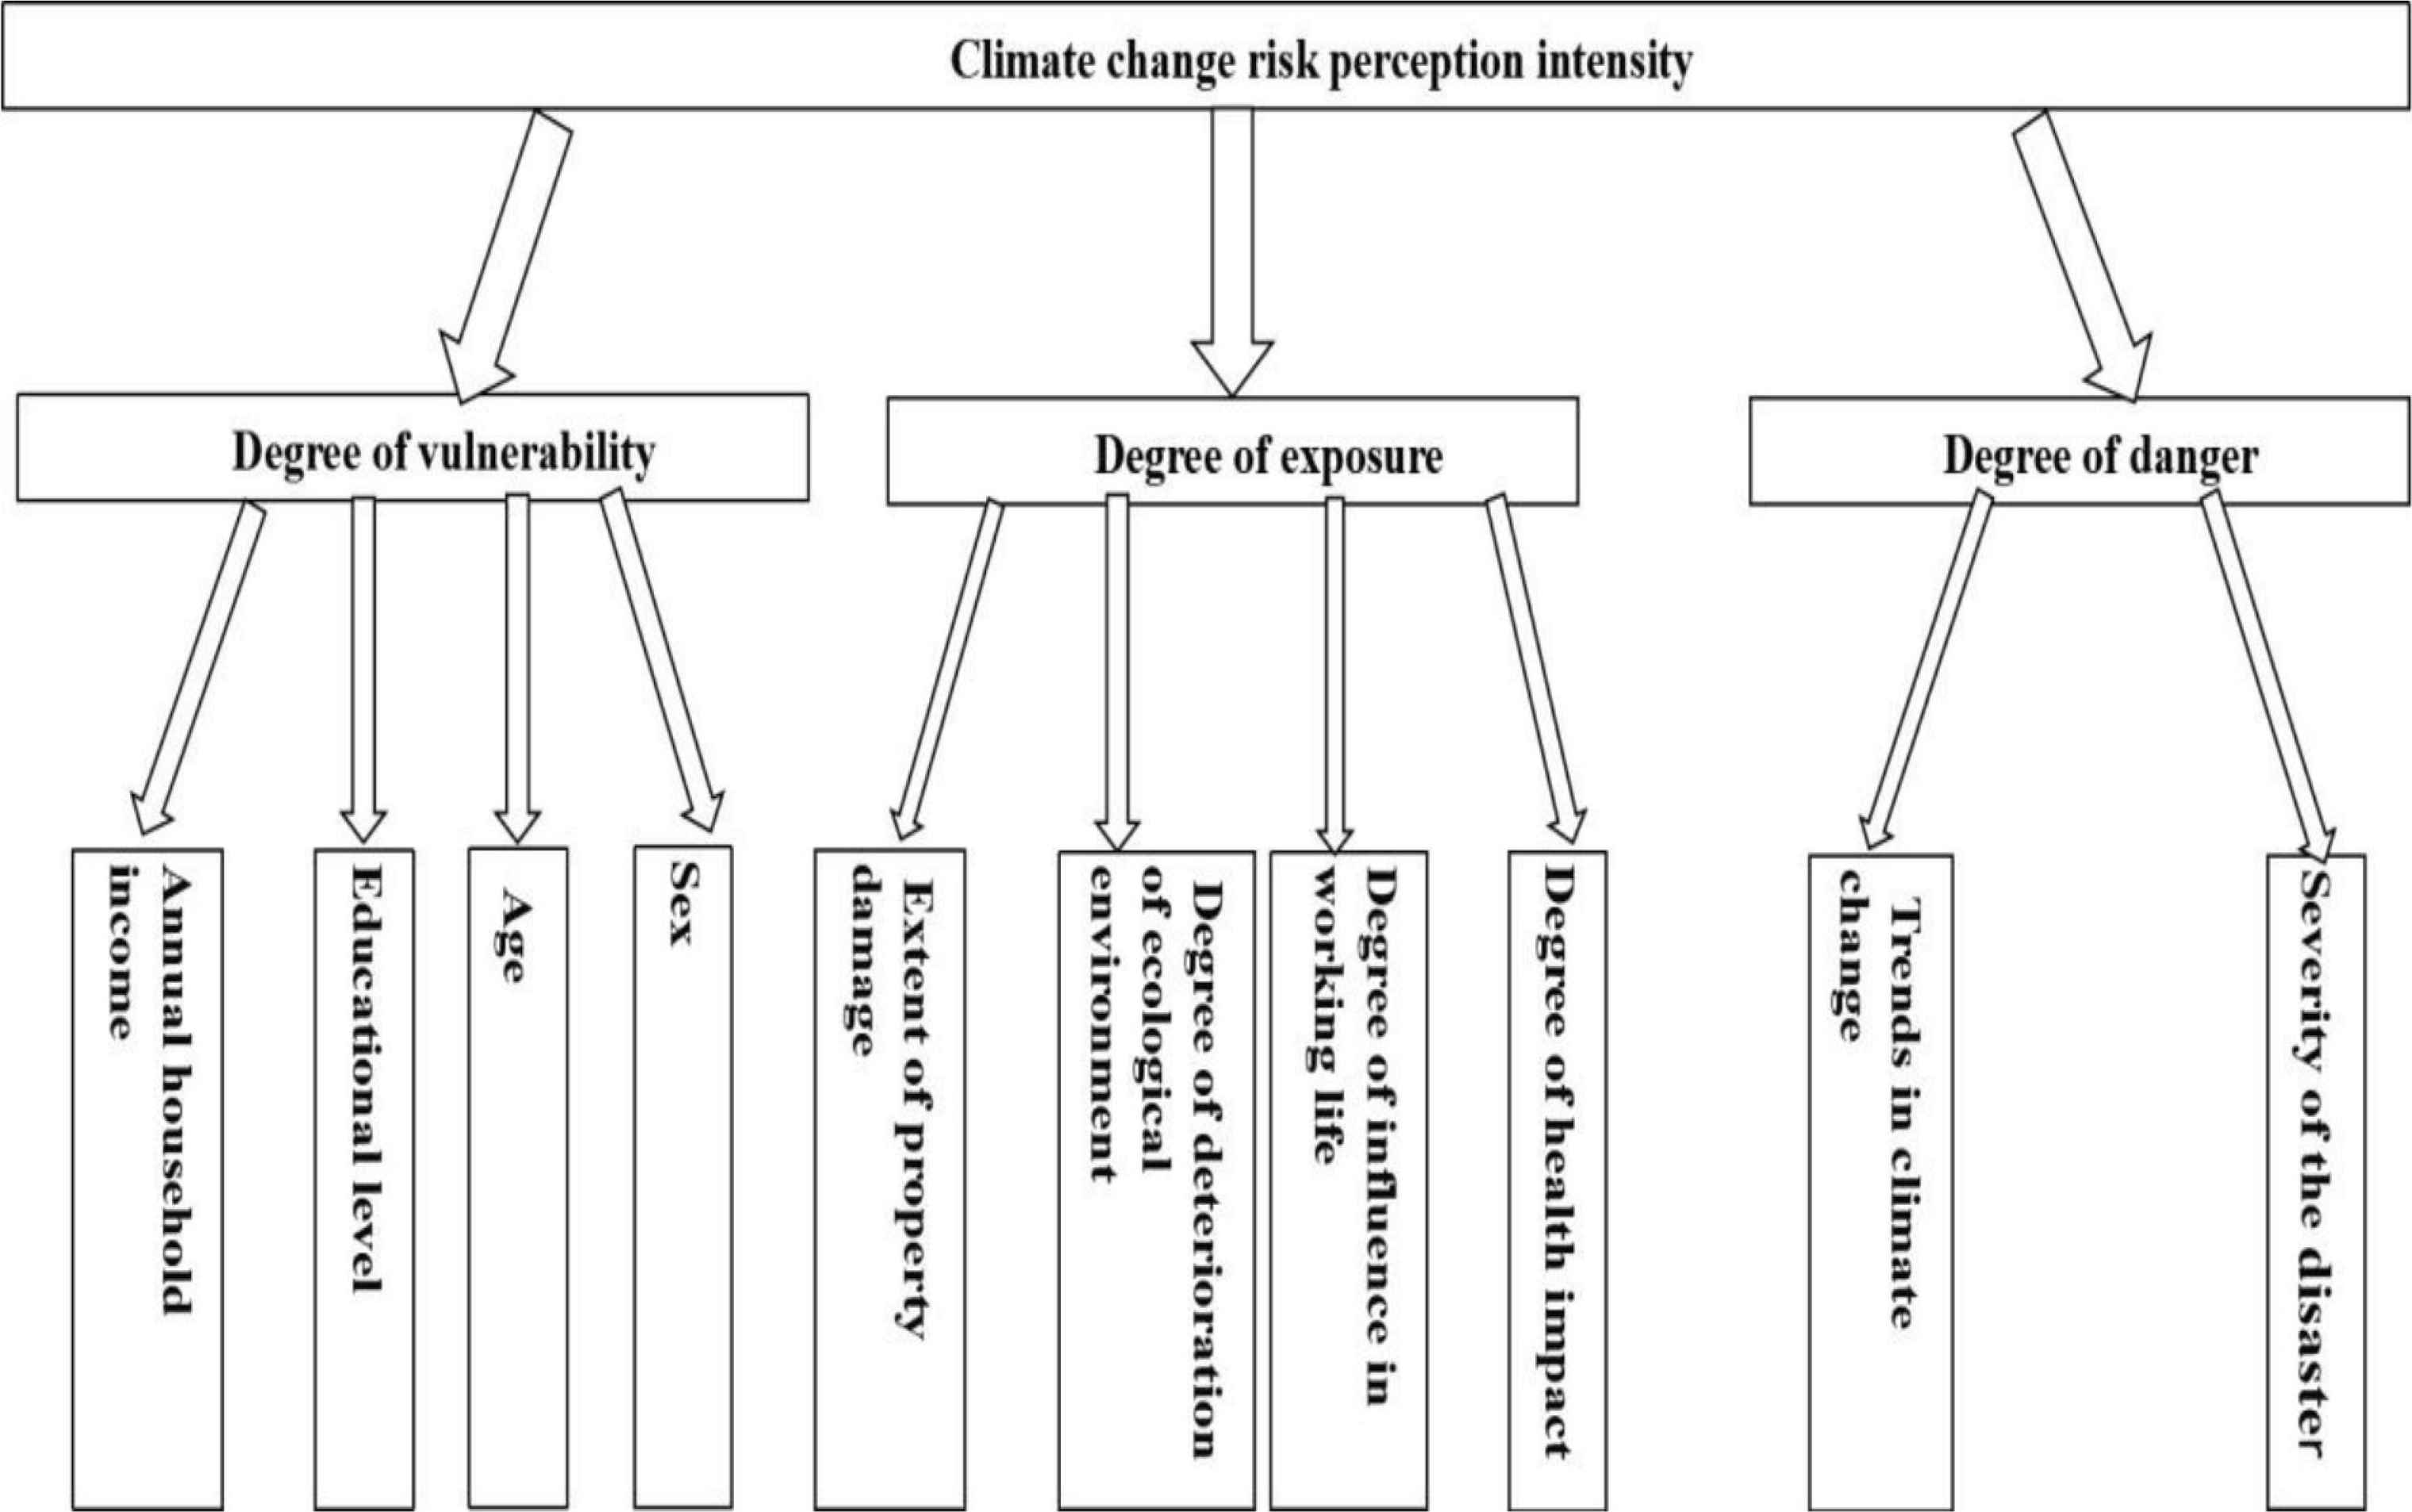
Index system for climate change risk perception assessment.
The Bayesian network result was achieved in accordance with the interrelation among danger, vulnerability, and exposure in the index system [32] in Figure 2 and by referring to the relative opinions of experts, as shown in Figure 4. Next, the pre-treated samples of the AHP-Bayesian network were graded in the paper. Table 3 displayed the criteria for grading the risk perception indices of the climate change in Baoji. The method of Nature Breaks was used in grading, and indices in each category included three levels. Specifically, the criteria for the vulnerability index was selected according to the abovementioned introduction and questionnaire contents [7]. The exposure was measured via probability distance since the paper mainly studied the uncertainty about the public’s risk perception. The danger perception index was measured mainly based on the local public’s perception of the serious influence degree and change tendency of extreme climate change in different places (see Table 3).
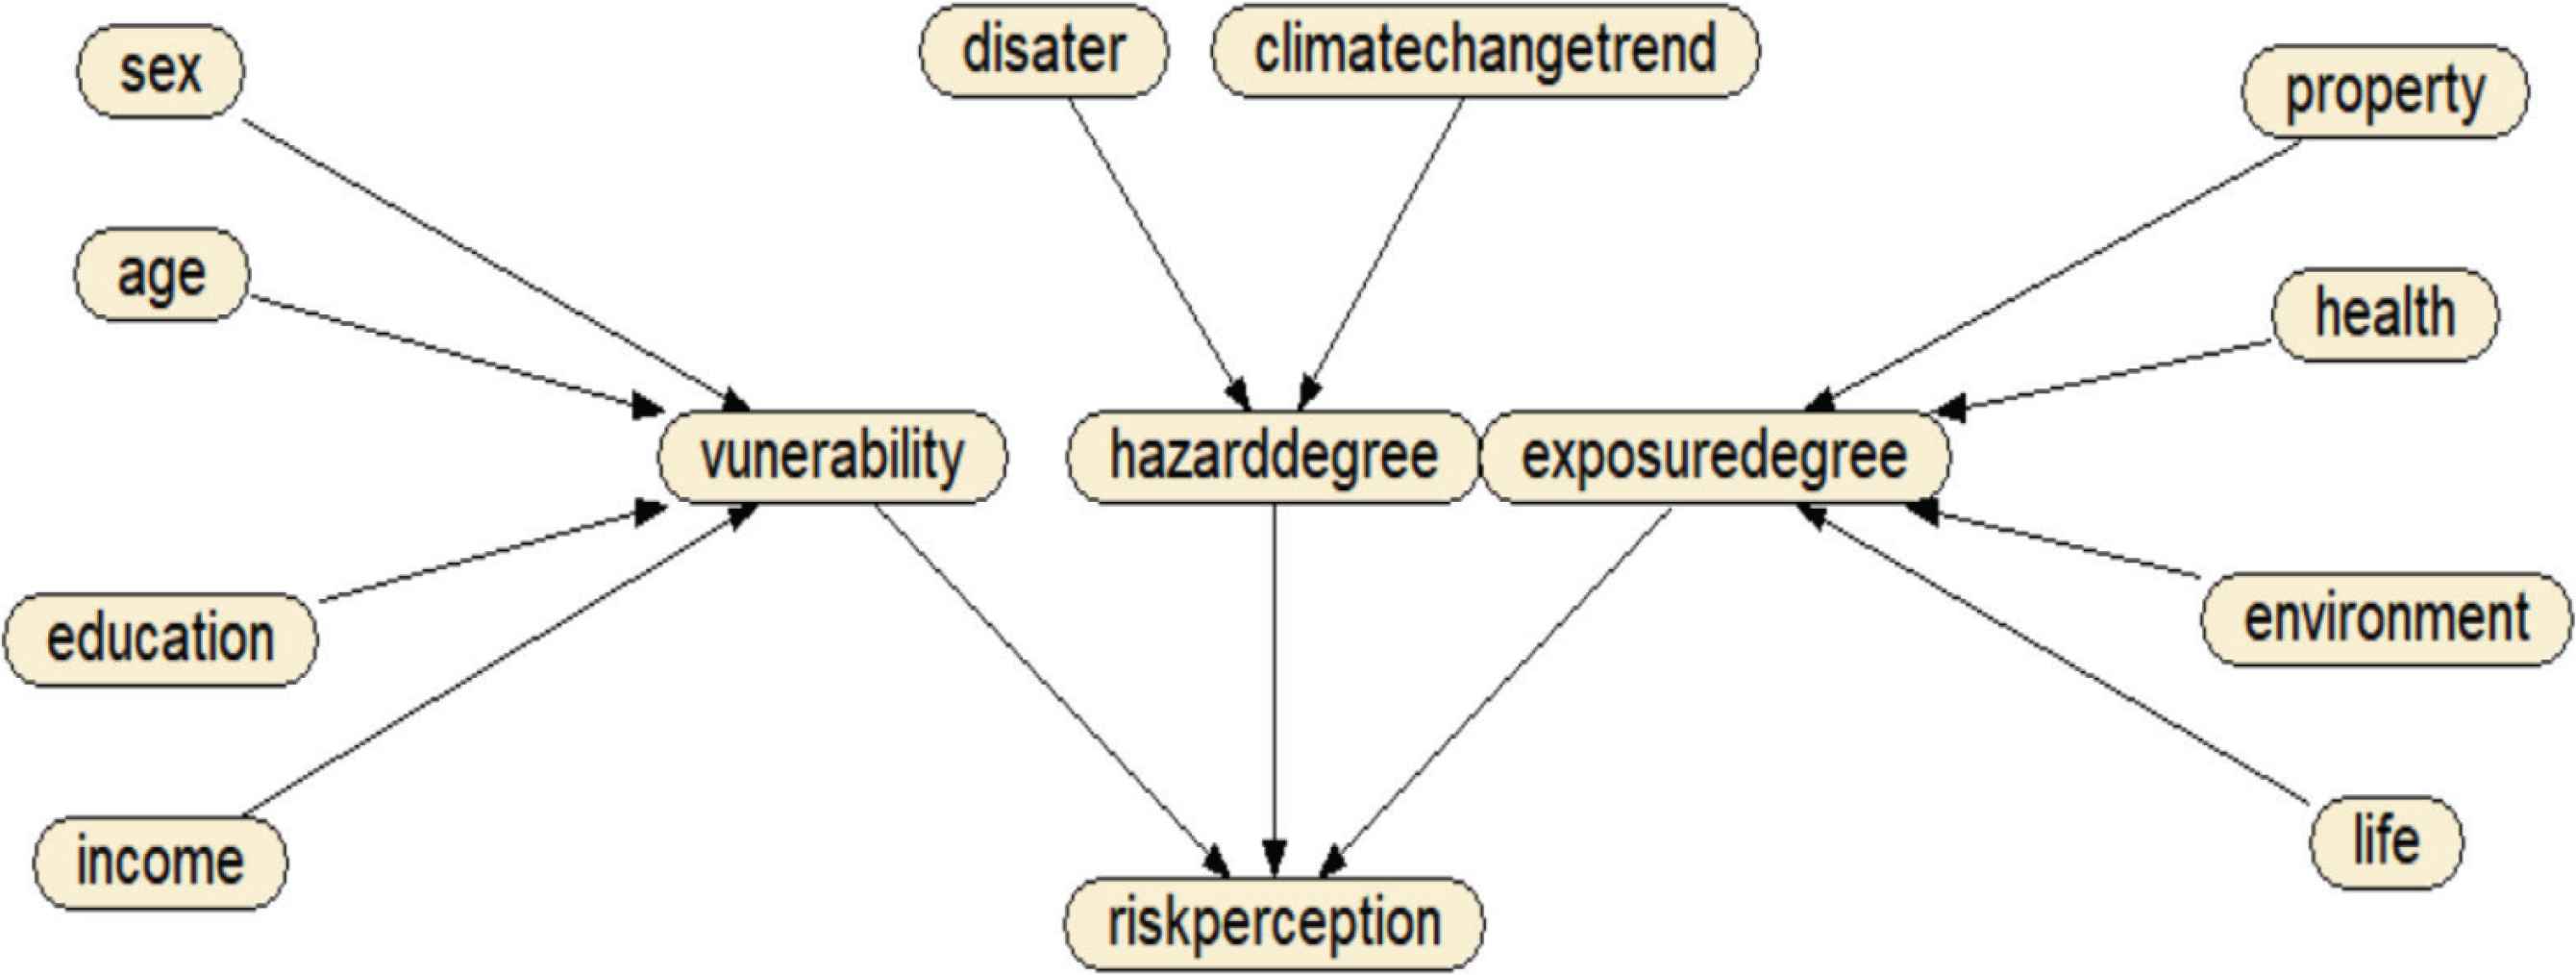
Schematic diagram of climate change risk perception structure of Bayesian network.
| Index/grade | Gender | Age | Education level | Annual household revenue | Property loss severity* | Influence degree on health* | Deterioration of ecological environment* |
| Low | Male = 0 | 3–27 | 1–3 (Primary school or junior high school) | 1–3 (500–2000) | 1–2 | 1–2 | 1–2 |
| Medium | Female = 1 | 27–54 | 4–6 (High school-bachelor) | 4-6 (2001–8000) | 3–4 | 3–4 | 3–4 |
| High | 54–86 | 7–8 (Postgraduate) | 7–9 (8001–15001) | 5 | 5 | 5 | |
| Index/grade | Influence degree on work and life* | Severity of disaster* | Climate change tendency* | Intensity of perception | Vulnerability | Danger level | Exposure |
| Low | 1–2 | 1–2 | 1–2 | 0.000–0.330 | 0.00–0.30 | 0.00–0.38 | 0.00–0.39 |
| Medium | 3–4 | 3–4 | 3–4 | 0.340–0.660 | 0.31–0.60 | 0.39–0.78 | 0.40–0.79 |
| High | 5 | 5 | 5 | 0.670–0.860 | 0.61–0.90 | 0.79–1.00 | 0.80–1.00 |
The Likert scale was applied to the score of 1–5, respectively.
Grading table of risk perception indices of climate change in Baoji
3.4. Calculation of Climate Change Risk Perception Intensity
where R indicated the intensity of climate change risk perception; P(Tl) represented probability at the corresponding level of exposure, danger, and vulnerability in the AHP-Bayesian network model, indicating the level (low, medium, and high) of risk perception; Qi denoted the average perception intensity of exposure, danger, and vulnerability at each level via AHP method; Wi indicated the perception weight of exposure, danger, and vulnerability at each level calculated via AHP method; and i represented the intensity level of exposure, danger, and vulnerability perception of climate change risk.
where V was the intensity of vulnerability; E was the intensity of exposure; D and Q were the intensity of danger level and climate change risk perception respectively, the values of which were within 0–1, consistent with Formula (7); P(Vl), P(El), and P(Dl) represented the probability values of the perception of exposure, danger, and vulnerability at corresponding level; Qvl, Qel, Qdl represented respectively the intensity of exposure, danger, and vulnerability according to the AHP analytical method.
3.5. Regression Analysis of Factors Affecting Climate Change Risk Perception Intensity
Firstly, the dependent variables of the climate change risk perception intensity (including the degree of public concern about climate change and the closeness of individuals to climate change risk) were averaged. The average value was then positively normalized to obtain the intensity of climate change risk perception. Finally, the obtained climate change risk perception intensity and the dependent variables shown in Table 2 were used for multiple linear regression analysis. The obtained results were compared with those of the Bayesian network model, which further verified the rationality of using the Bayesian network for climate change risk perception evaluation. The descriptive statistics of the dependent variable were as shown in Table 4.
| Climate change risk concern | Closeness of individuals to climate change risk | ||
|---|---|---|---|
| Average | 2.389392 | Average | 4.029754 |
| Standard error | 0.026517 | Standard error | 0.02797 |
| Standard deviation | 1.042646 | Standard deviation | 1.099759 |
| Variance | 1.087111 | Variance | 1.20947 |
| Kurtosis | 9.172399 | Kurtosis | −0.00364 |
| Skewness | 1.345191 | Skewness | −0.94468 |
Descriptive statistics of the dependent variables of climate change risk perception intensity
3.6. AHP-Bayesian Network Model Data pre-Processing
For the top-level decision objective of “climate change risk perception”, the lower-level materiality matrix was shown in Table 5.
| Average value | Item | Vulnerability | Degree of danger | Exposure |
|---|---|---|---|---|
| 1.92 | Vulnerability | 1.000 | 0.727 | 1.103 |
| 2.64 | Degree of danger | 1.375 | 1.000 | 1.517 |
| 1.74 | Exposure | 0.906 | 0.659 | 1.000 |
AHP hierarchical analysis judgment matrix
For the decision objective for level 2, exposure, danger, and vulnerability, the lower-level significance matrixes were shown in Tables 6–8.
| Average value | Item | Education level | Influence degree on work and life | Annual household revenue | Gender |
|---|---|---|---|---|---|
| 2.100 | Education level | 1.000 | 0.882 | 4.221 | 4.773 |
| 2.380 | Influence degree on work and life | 1.133 | 1.000 | 4.784 | 5.409 |
| 0.497 | Annual household revenue | 0.237 | 0.209 | 1.000 | 1.131 |
| 0.440 | Gender | 0.210 | 0.185 | 0.884 | 1.000 |
Judgment matrix of vulnerability via AHP hierarchy analysis
| Average value | Item | Severity of disaster | Climate change tendency |
|---|---|---|---|
| 0.503 | Severity of disaster | 1.000 | 1.115 |
| 0.451 | Climate change tendency | 0.897 | 1.000 |
Judgment matrix of risk via AHP level analysis
| Average value | Item | Property loss severity | Influence degree on health | Deterioration of ecological environment | Influence degree on work and life |
|---|---|---|---|---|---|
| 1.92 | Property loss severity | 1 | 0.865 | 0.897 | 0.807 |
| 2.22 | Influence degree on health | 1.156 | 1 | 1.037 | 0.933 |
| 2.14 | Deterioration of ecological environment | 1.115 | 0.964 | 1 | 0.899 |
| 2.38 | Influence degree on work and life | 1.24 | 1.072 | 1.112 | 1 |
Judgment matrix of risk via AHP level analysis
The weight of each index of climate change risk perception in Baoji City was obtained using AHP method (see Table 9).
| Exposure (27.619%) | Danger level (41.905%) | Vulnerability (30.476%) | CI = 0 |
|---|---|---|---|
| Property loss severity (22.171%) | Severity of disaster (52.729%) | Education level (38.763%) | RI = 0.415 |
| Influence degree on health (25.635%) | Influence degree on work and life (43.932%) | ||
| Deterioration of ecological environment (24.711%) | Climate change tendency (47.271%) | Annual household revenue (9.183%) | |
| Influence degree on work and life (27.483%) | Gender (8.122%) | ||
| λmax= 3, CI = 0, RI = 0.52, CR = 0 | λmax= 2, CI = 0, RI = 0 | λmax= 4, CI = 0, RI = 0.89, CR = 0 | CR = 0 |
% represents the weight of each index.
Weight of climate change risk perception indices based on AHP
The EM algorithm was used to calculate the probability of occurrence of the elements represented by each node in the Bayesian network, as shown in Figure 5.
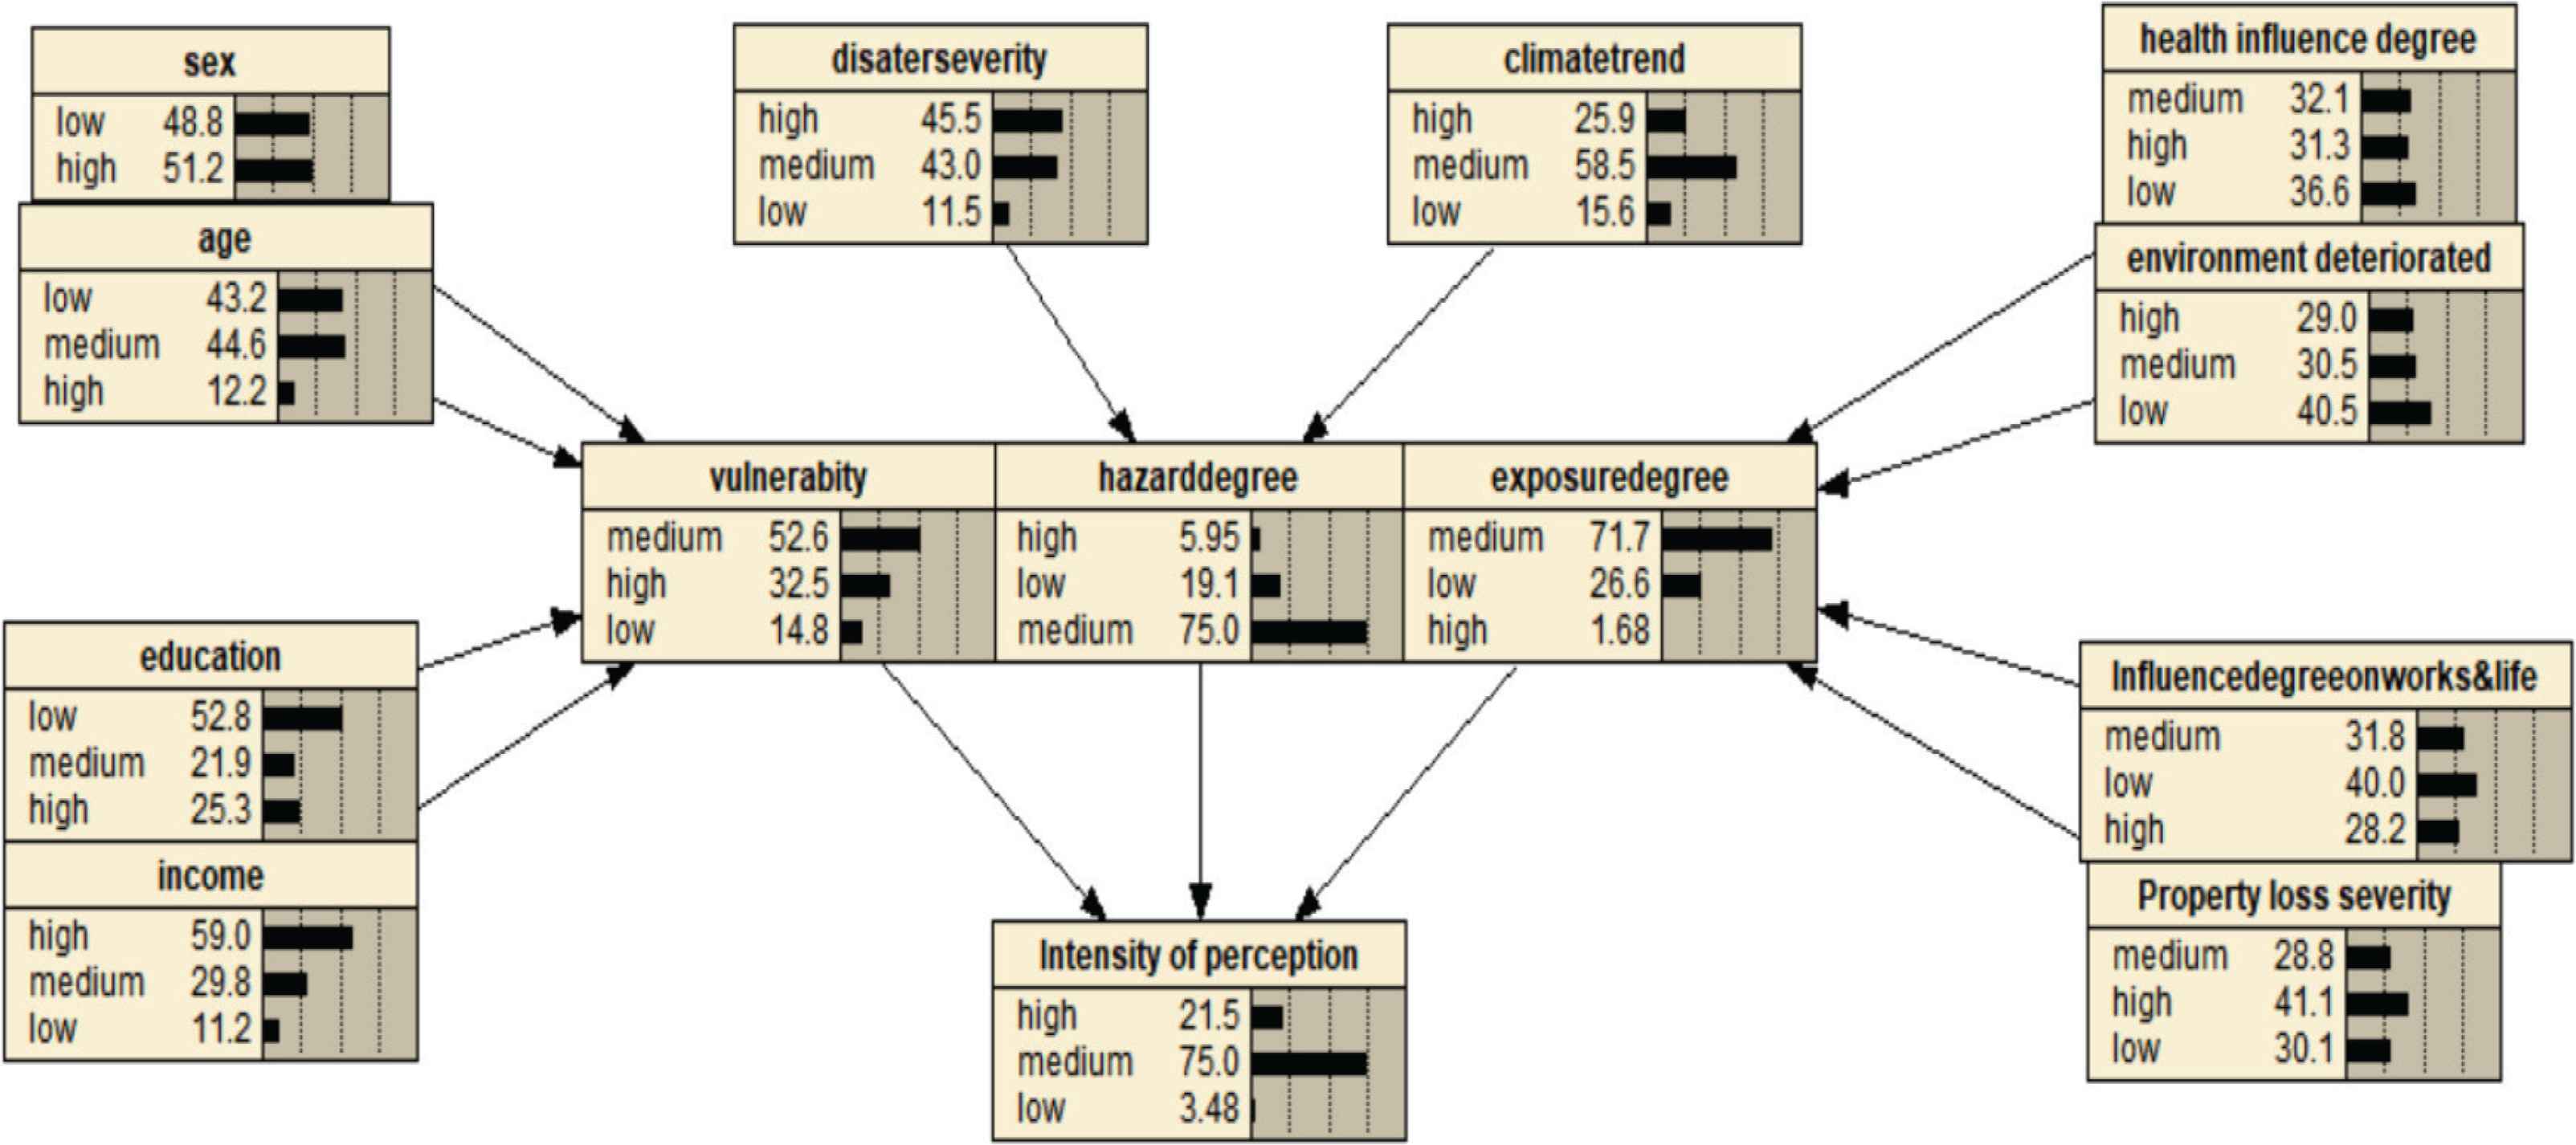
Probability table of Bayesian network.
According to the probability of climate change risk perception intensity and risk perception level in Table 9, the decision goal of “climate change risk perception” was calculated by Formula (1). The climate change vulnerability, danger degree, and exposure degree optimized by the Bayesian network were 0.436, 0.540, and 0.501 respectively. Further calculations showed that the intensity of climate change risk perception was 0.497. According to Table 2, people in Baoji showed a moderate level of climate change risk perception, which was consistent with the conclusion obtained through the Bayesian network. Comparing the probability obtained by the AHP-Bayesian network model classification with that of the corresponding samples obtained based on actual investigation, the maximum likelihood probability of the AHP-Bayesian network model was 74.2%. This indicated that the algorithm not only reduced the calculation error of the climate change risk perception intensity, but an overall assessment of the level of climate change risk perception in Baoji had also been undertaken, thus avoiding the risk perception bottleneck associated with the grade of intensity.
4. RESULT ANALYSIS
4.1. Synthesis of Risk Perception Results
The most important function of the Bayesian network is that it can use Bayes formula to deduce the probability according to the network structure. In this model, the posterior probability of one or more variables could be obtained under the given state of some variables (that is, prior knowledge or prior probability), and then the risk could be predicted. In this paper, a Priori probability was introduced into the Bayesian network model, and a Posteriori probability was obtained through probability reasoning to measure the probability of future climate change risk perception in Baoji. This was achieved through Netica software, which is widely used for Bayesian network.
4.1.1. Perceived sensitivity to climate change risk and posterior analysis
Judging from the calculations in Subsection 3.1 and the probabilities shown in Figure 5, it is clear that the climate change risk perception system was at a moderate level, being 0.497. Moreover, the results of Bayesian network showed that 75% of the residents in Baoji City had moderate climate change risk perception, thus implying that the overall perception level of Baoji City was moderate. By adjusting the probability of climate change risk perception at the medium level to 100%, it was found that the probability of other indicators at the high level had increased (see Figure 6). The biggest change in risk was the climate change trend rate (3.2%), and the disaster severity was also large (2.9%); the biggest change in exposure was the degree of ecological environment deterioration (2.0%); and the biggest change in vulnerability was gender (5.1%) (see Figure 6). Therefore, in order to improve people’s climate change risk perception level, it is necessary to widely publicize climate change trends, emphasize the deterioration degree of ecological environment, pay attention to the climate change risk perception status of different genders, and release corresponding information timely to predict the disaster severity of climate change. The mutual information between climate change risk perception node and its parent node was obtained by sensitivity analysis [32] (see Table 10).
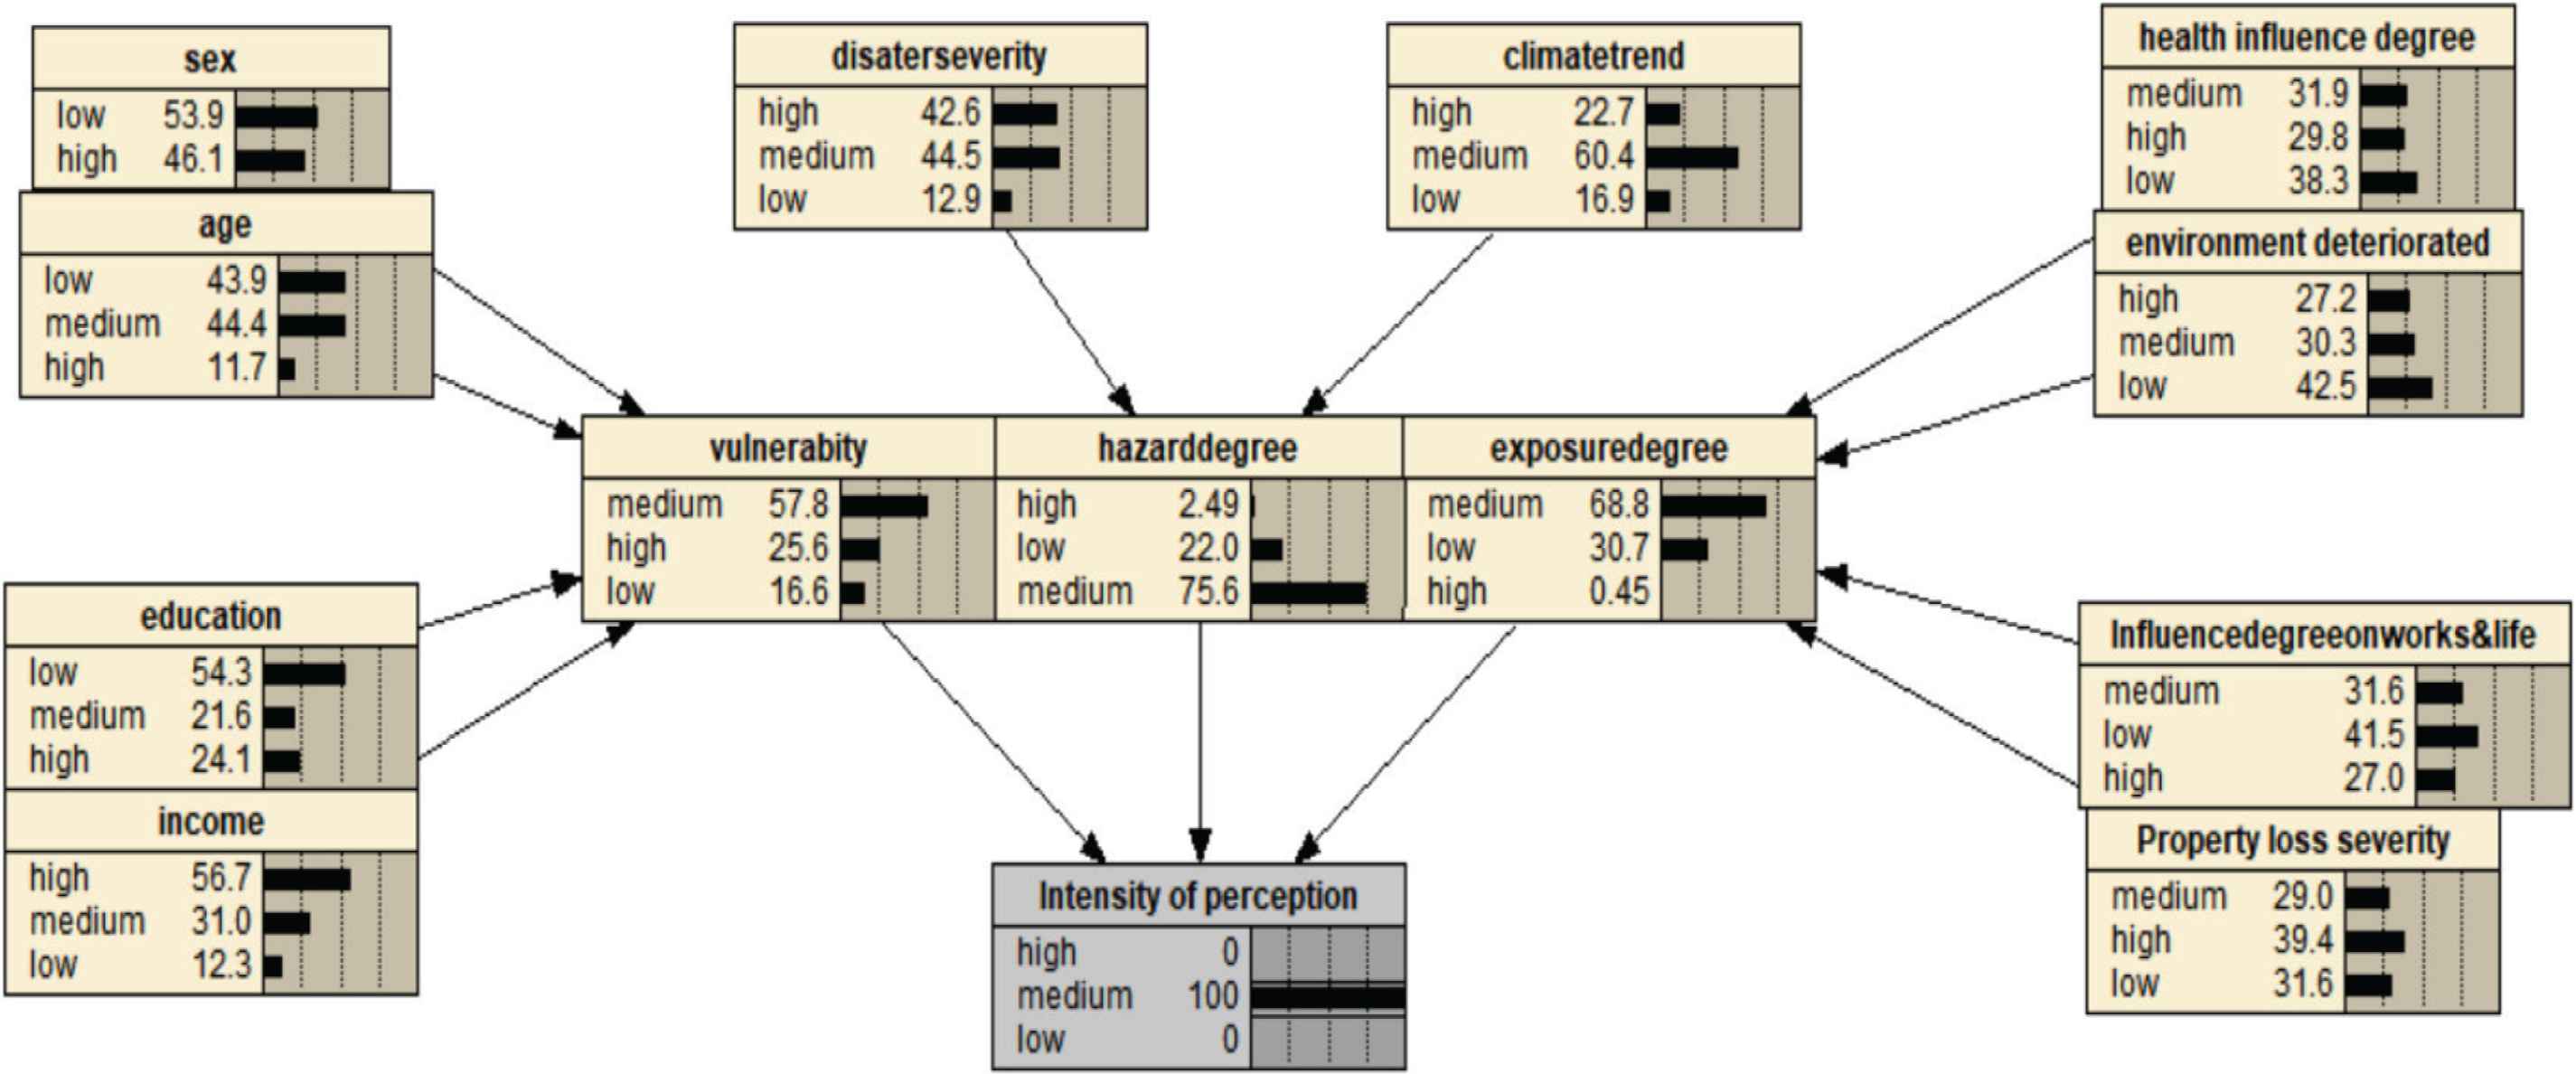
Posterior probability diagram of climate change risk perception.
| Index/Level | Vulnerability perception | Exposure perception | Risk perception | Climate change risk perception |
|---|---|---|---|---|
| Low | 0.229 | 0.242 | 0.285 | 0.273 |
| Medium | 0.471 | 0.588 | 0.579 | 0.507 |
| High | 0.717 | 0.908 | 0.863 | 0.729 |
Average perceived intensity of each index in Baoji City based on AHP
Mutual information refers to the amount of information shared between two variables, which is a measure of the interdependence degree of variables. The greater the amount of mutual information, the smaller the degree of information entropy reduction, and the stronger the correlation between nodes [32]. Table 11 showed high correlations between disaster severity, climate change trend, property damage severity, ecological degradation, annual household revenue, gender, and climate change risk perception. In order to scientifically compare the factors that showed the greatest impact on the perception of climate change risk, the cumulative percentage of mutual information and cumulative percentage of probability change rate were used as horizontal and vertical axes respectively. The results demonstrated that the cumulative curve of probability change rate was above the absolute fair curve, thereby indicating that the probability change rate could better reflect the influence factors of climate change risk perception than mutual information (see Table 12 and Figure 7).
| Node | Mutual information | Percentage |
|---|---|---|
| Gender | 0.04410 | 4.610 |
| Disaster severity | 0.03676 | 3.840 |
| Climate change trend | 0.02861 | 2.990 |
| Deterioration degree of ecological environment | 0.01503 | 1.570 |
| Severity of property damage | 0.01437 | 1.500 |
| Annual family income | 0.01522 | 1.590 |
| Impact on work and life | 0.01135 | 1.190 |
| Health impact | 0.01169 | 1.220 |
| Education level | 0.00566 | 0.592 |
| Age | 0.00141 | 0.148 |
Mutual information between climate change risk perception and parent node
| Index | Cumulative percentage of mutual information | Cumulative percentage of probability change rate |
|---|---|---|
| Age | 1 | 19 |
| Education level | 4 | 24 |
| Health impact | 10 | 30 |
| Impact on work and life | 16 | 36 |
| Annual family income | 24 | 43 |
| Severity of property damage | 32 | 50 |
| Deterioration degree of ecological environment | 41 | 59 |
| Climate change trend | 56 | 70 |
| Disaster severity | 76 | 81 |
| Gender | 100 | 100 |
Statistics table of probability change comparison curve

Comparison curve of probability change rate.
4.1.2. Multiple regression analysis of climate change risk perception
From the above Tables 12 and 13, it could be found that the model matching degree of using multiple linear regression to explore the factors affecting climate change risk perception was low. In particular, R2 was only 0.017 < 0.6, and the goodness of fit was also very low. According to the test results of the respective variables T, only the severity of property loss, the deterioration degree of ecological environment, the severity of disasters, and climate change trend were found to be very significant, and other significant levels were <0.5, revealing poor accuracy. Therefore, compared with the multiple linear regression model, the Bayesian network model (fitting accuracy of 74.2%) was more suitable for assessing the level of climate change risk perception and exploring its influencing factors (Table 14).
| R | 0.1303 |
| R-squared | 0.0169780 |
| Adjusted R | 0.01057 |
| Standard error | 0.152813 |
Statistics results of regression
| Independent variables | Independent variables | Independent variables | Independent variables | Independent variables |
|---|---|---|---|---|
| Constant term | 0.543839 | 0.018591 | 29.25278 | 7.4E−150 |
| Gender | 0.002604 | 0.007989 | 0.325971 | 0.744491 |
| Age | −0.01261 | 0.026086 | −0.48345 | 0.628844 |
| Education level | 0.006516 | 0.016942 | 0.384608 | 0.700581 |
| Family income | −0.00798 | 0.016748 | −0.47646 | 0.633814 |
| Severity of property damage | −0.02675 | 0.018094 | −1.47857 | 0.13946 |
| Health impact | 0.012994 | 0.021054 | 0.617159 | 0.537222 |
| Deterioration of ecological environment | −0.03171 | 0.021546 | −1.47191 | 0.14125 |
| Impact on work and life | 0.004319 | 0.019665 | 0.219624 | 0.826193 |
| Severity of disaster | 0.100144 | 0.021499 | 4.658171 | 3.47E−06 |
| Climate change trend | −0.04857 | 0.021747 | −2.23328 | 0.025674 |
Multiple linear regression coefficient table
5. DISCUSSION AND CONCLUSION
In general, the uncertainties of Bayesian networks lie in structural uncertainty, input data uncertainty, and parameter uncertainty [31]. This paper has selected some indicators to evaluate the risk perception of climate change in Baoji City. However, there are many factors influencing climate change risk perception [33], such as climate change risk outcome perception and cause perception. In the future, more influencing factors should be incorporated into the network to reduce structural uncertainty caused by incomplete understanding of the process of climate change risk perception, so that the research results could have more practical significance. The perception of climate change risk cause, which mainly involves the public’s perception of the factors affecting climate change risk, is also a part of climate change risk perception. The limitation resulted from expert scoring of the AHP method could be transcended by combing AHP with the Bayesian network model to assess the risk perception of climate change in Baoji City as a whole. In so doing, the poor fitting results in the process of multiple linear regression analysis could also be improved, so that the connection between indicators could be consistent with the actual scenarios to the largest extent. However, this paper used the AHP method to determine the weights of secondary indicators to calculate the strength of risk perception, and the ANP method could be used for future weight calculation improvements. During the simulation of risk scenarios, the medium-level intensity of Baoji City’s climate change risk perception was adjusted to 100%. The sensitivity analysis method was used to further verify that the factors influencing the risk perception intensity of Baoji were mainly gender, climate change perception trends, deterioration degree of ecological environment, and disaster severity. In the future, the commissioning of different perception scenarios can be used to find the threshold of climate change risk perception. Besides, the present study found that 75% of the people’s climate change risk perception level was moderate. This is consistent with the climate change risk perception index of the majority of the public in Baoji calculated by Hong Juan based on the risk view [25], indicating that the calculation results in this paper were more reasonable. The climate change risk perception intensity of 0.497 was at a medium level, which is more consistent with the survey results of related scholars. For example, 54.9% of the public in Baoji City had a correct understanding of the uncertainty of risk, while 43.6% of the public believed that the danger degree of risk was small [27]. These findings were not much different from the research results of the present paper, thus revealing that our use of AHP-Bayes model to measure the intensity of climate change risk perception was more reasonable. In addition, some researchers have suggested that Baoji had the most extensive flood hazard low-risk area, followed by medium-low risk area [34], indicating a certain gap between people’s flood risk perception and scientific calculation result. To be specific, the hailstorm risk index in Longxian County was the largest, and the urban center and the southern high mountain area were mainly low-risk areas [35]. It indicated that the calculated Baoji’s climate change risk perception intensity slightly differed from the scientifically measured result of hail disaster risk in the overall judgment. By regulating people’s perception of hail disaster risks in different areas of Baoji City, they could be encouraged to better deal with this kind of risks. For example, people in Longxian County need to raise the awareness of the hail disaster risk and take precautions in advance, while the residents in the urban central area and the southern high mountain area can appropriately reduce their risk response level to avoid unnecessary panic. It can be clearly inferred that the results of this paper have different reference value in terms of the response to and management of different climate change risk categories, so different adjustments need to be made in accordance with the actual situation of Baoji City. In addition, since Baoji City has frequent meteorological disasters and it is more sensitive to climate change, the assessment of the local people’s climate change risk perception also has certain reference value for the whole country. For example, given a small gap between people’s perception of climate change risk and the scientific result, it is suggested to further publicize the severity of disasters and the deterioration of the ecological environment, and pay attention to the status of climate change risk perception of different genders to prevent the loss caused by climate change risk. On the other hand, when people’s perception of climate change risk is higher than the results of scientific calculations, it is necessary to appropriately reduce the publicity of information on climate change trends in order to reduce the panic caused by climate change risk. Noteworthily, the limitation of this paper lies in that it failed to explore the gap between Baoji City’s climate change risk perception and its overall climate change risk intensity.
The innovation of this paper is reflected in the following two aspects. Firstly, the research content shows a certain degree of innovation in terms of the assessment of climate change risk perception. Most previous studies have been based on the three aspects of climate change risk management, mitigation, and adaptation. Among them, Climate Risk Management (CRM) is a term used to represent a large and growing body of work, connecting such aspects as the Climate Change Adaptation (CCA), disaster management and development sectors. The approach aims to promote sustainable development by reducing vulnerabilities related to climate risks. CRM involves strategies aiming at maximizing positive and minimizing negative outcomes for communities in fields such as agriculture, food security, water resources, and health [36]. Climate change mitigation consists of actions to limit the magnitude or rate of global warming and its related effects [37]. The current trajectory of global greenhouse gas emissions appears to be inconsistent with limiting global warming to below 1.5°C or 2°C [38–40]. However, globally, the benefits of keeping warming under 2°C exceed the costs. Moreover, CCA is a response to global warming also known as “climate change” [41]. The Intergovernmental Panel on Climate Change defines CCA as “the process of adjustment to actual or expected climate and its effects [42]. In human systems, adaptation seeks to moderate or avoid harm or exploit beneficial opportunities. In some natural systems, human intervention may facilitate adjustment to expected climate and its effects” [43]. In general, the above research has only focused on the simple assessment of climate change risk perception. By comparison, the present paper has not only systematically evaluated the public’s climate change risk perception by considering hazard, vulnerability, and exposure at the same time, but also comprehensively verified the influencing factors of climate change risk perception. Besides, the content of this research are more in-depth and solid. Secondly, this paper has compared the climate change risk perception level of the people in Baoji City with the results of scientific assessment, and provided a reference standard for the people in terms of climate change risk management and response. This is of certain practical value, and reflects again the originality of the present study. As for the research methods, this paper has additionally conducted the regression analysis commonly used in previous literature for comparison, and found that the AHP-Bayesian network method is more effective.
In short, this paper has evaluated the risk perception of climate change in Baoji City by combing the AHP analysis and the Bayesian network. It has also combined the posterior and sensitivity analysis to diagnose the factors affecting climate change risk perception. The conclusions are as follows. First, AHP-Bayesian network model is more suitable for the assessment of climate change risk perception than multiple linear regression. Second, the climate change risk perception intensity is 0.497, being at a medium level. Comparing this result with the scientific assessment of climate change risk, it is found that there is a certain gap between the assessment results of climate change risk in different regions or different categories in Baoji City and the public perception. Third, judging from the calculation results of the Bayesian network, 75.0% of the people have a moderate level of risk perception of climate change, 21.5% have a higher level of perception, and about 3.5% have a lower level of perception. It further confirms that the majority of Baoji’s population have a moderate level of climate change risk perception. Moreover, the main factors that influence the risk perception intensity of Baoji City are gender, climate change perception trend, deterioration degree of ecological environment, and disaster severity. At the meanwhile, compared with previous studies, this paper has systematically evaluated the people’s climate change risk perception and comprehensively verified the main factors affecting climate change risk perception. The research content is more in-depth and solid. Furthermore, in order to improve the public’s ability to perceive climate change risk, it is necessary to strengthen the publicity of climate change trends and the severity of property loss, and pay attention to the status of different genders’ perceptions of climate change risk in a timely manner. In the process of risk management, more attention should be paid to the information on climate change disaster severity, and the prevention and control of disasters should be enhanced to reduce property loss and minimize the climate change risk’s impact on people’s work and life. Nonetheless, when the gap between people’s perception of climate change risk and the scientifically assessed result is small, it is suggested to further publicize the severity of disasters and the deterioration of the ecological environment, and pay attention to different genders’ status of the climate change risk perception to prevent loss caused by climate change risk. However, when people’s perception of climate change risk is higher than the scientific results, it is necessary for the public to appropriately reduce their attention to climate change trend information, so as to decrease the panic caused by climate change risk.
CONFLICTS OF INTEREST
The authors declare they have no conflicts of interest.
ACKNOWLEDGMENTS
This work is supported by the National Natural Science Foundation of China “Regional Climate Change Risk Perception and Response” (41771215). The authors appreciate the time and effort of the editors and reviewers in providing constructive comments which have helped to improve the manuscript.
REFERENCES
Cite this article
TY  - JOUR
AU  - Siwen Xue
AU  - Qi Zhou
AU  - Shuo lin Geng
PY  - 2020
DA  - 2020/12/11
TI  - Evaluation of Climate Change Risk Perception in Baoji City Based on AHP-Bayesian Network
JO  - Journal of Risk Analysis and Crisis Response
SP  - 147
EP  - 159
VL  - 10
IS  - 4
SN  - 2210-8505
UR  - https://doi.org/10.2991/jracr.k.201214.001
DO  - 10.2991/jracr.k.201214.001
ID  - Xue2020
ER  -